báo cáo hóa học:" Assessing normative cut points through differential item functioning analysis: An example from the adaptation of the Middlesex Elderly Assessment of Mental State (MEAMS) for use as a cognitive screening test in Turkey" docx
Bạn đang xem bản rút gọn của tài liệu. Xem và tải ngay bản đầy đủ của tài liệu tại đây (248.25 KB, 8 trang )
BioMed Central
Page 1 of 8
(page number not for citation purposes)
Health and Quality of Life Outcomes
Open Access
Research
Assessing normative cut points through differential item
functioning analysis: An example from the adaptation of the
Middlesex Elderly Assessment of Mental State (MEAMS) for use as
a cognitive screening test in Turkey
Alan Tennant*
1
, Ayse A Küçükdeveci
2
, Sehim Kutlay
2
and Atilla H Elhan
3
Address:
1
Academic Unit of Musculoskeletal Disease, University of Leeds, UK,
2
Department of Physical Medicine and Rehabilitation, School of
Medicine, University of Ankara, Turkey and
3
Department of Biostatistics, School of Medicine, University of Ankara, Turkey
Email: Alan Tennant* - ; Ayse A Küçükdeveci - ;
Sehim Kutlay - ; Atilla H Elhan -
* Corresponding author
Abstract
Background: The Middlesex Elderly Assessment of Mental State (MEAMS) was developed as a
screening test to detect cognitive impairment in the elderly. It includes 12 subtests, each having a
'pass score'. A series of tasks were undertaken to adapt the measure for use in the adult population
in Turkey and to determine the validity of existing cut points for passing subtests, given the wide
range of educational level in the Turkish population. This study focuses on identifying and validating
the scoring system of the MEAMS for Turkish adult population.
Methods: After the translation procedure, 350 normal subjects and 158 acquired brain injury
patients were assessed by the Turkish version of MEAMS. Initially, appropriate pass scores for the
normal population were determined through ANOVA post-hoc tests according to age, gender and
education. Rasch analysis was then used to test the internal construct validity of the scale and the
validity of the cut points for pass scores on the pooled data by using Differential Item Functioning
(DIF) analysis within the framework of the Rasch model.
Results: Data with the initially modified pass scores were analyzed. DIF was found for certain
subtests by age and education, but not for gender. Following this, pass scores were further adjusted
and data re-fitted to the model. All subtests were found to fit the Rasch model (mean item fit 0.184,
SD 0.319; person fit -0.224, SD 0.557) and DIF was then found to be absent. Thus the final pass
scores for all subtests were determined.
Conclusion: The MEAMS offers a valid assessment of cognitive state for the adult Turkish
population, and the revised cut points accommodate for age and education. Further studies are
required to ascertain the validity in different diagnostic groups.
Background
With the rapid expansion of the population in Turkey, as
well as a shift in the population distribution with the
emergence of groups susceptible to age-related chronic
Published: 23 March 2006
Health and Quality of Life Outcomes 2006, 4:18 doi:10.1186/1477-7525-4-18
Received: 10 November 2005
Accepted: 23 March 2006
This article is available from: />© 2006 Tennant et al; licensee BioMed Central Ltd.
This is an Open Access article distributed under the terms of the Creative Commons Attribution License ( />),
which permits unrestricted use, distribution, and reproduction in any medium, provided the original work is properly cited.
Health and Quality of Life Outcomes 2006, 4:18 />Page 2 of 8
(page number not for citation purposes)
diseases such as stroke, the need for adequate outcome
measures for use in clinical practice becomes paramount.
To this end, a programme of adaptation of measures,
mostly concerned with activity limitation and quality of
life, has been undertaken using standardised adaptation
protocols [1-3]. However, there still remains an urgent
need for scales measuring aspects of cognitive impair-
ment.
One such scale, the Middlesex Elderly Assessment of Men-
tal State (MEAMS) was developed as a screening test to
detect gross impairment of specific cognitive skills in the
elderly [4,5]. Thus if problems are identified then more
detailed neuropsychological assessment should be under-
taken. Clinical psychologists using this scale in the UK
suggested to the authors that it would be of use for routine
screening in a rehabilitation setting in Turkey, and that it
could be used for the adult population, not just for the
elderly, given proper adaptation. Thus we set out to adapt
the measure for use in Turkey and to assess its internal and
external construct validity in an adult population [6], and
determine the validity of the existing cut points for pass-
ing subtests, given the wide range of the level of education
in the Turkish population. This paper focuses on the
methodological issues associated with internal construct
validity and the cut points, and introduces a novel form of
testing the validity of the cut points in these circum-
stances.
Methods
Sample
A sample of 350 normal people aged 16 and over were
recruited by one clinical psychologist and two occupa-
tional therapists at the Department of Physical Medicine
& Rehabilitation, in the School of Medicine of Ankara
University (Table 1). The people in this sample were
recruited from the hospital staff, relatives of hospital staff
and relatives of patients. All participants gave informed
consent. Potential subjects for MEAMS administration
were questioned regarding their health status and medical
history to exclude conditions that might interfere with
cognitive performance. These conditions included neuro-
logical and psychiatric disorders, including dementia,
mental retardation or significant learning disorder, alco-
holism, major sight and hearing impairment and the use
of psychotropic drugs.
In addition, because the distribution of normative scores
tends to the upper limit, data from 158 consecutive
patients with acquired brain injury undergoing rehabilita-
tion were included in the analysis so that the effect of age
and education could be viewed across the wider construct
of cognition (that is, from those without cognitive impair-
ment to those with severe levels of cognitive impairment).
Patients with significant difficulties in language expres-
sion or comprehension were excluded, as were those
meeting the exclusion criteria applied to the normal pop-
ulation.
Table 1: Distribution of the a) normal subjects and b) patients according to age, gender and educational level, expressed as a % of total
within each education/gender group.
a) Normal subjects
Age
Primary (n = 132) Education Middle (n = 97) High (n = 121) Total (n = 350)
Male Female Male Female Male Female Male Female
16–30 (n = 84) 21.3 21.2 26.5 22.9 25.4 27.4 24.5 23.6
31–45 (n = 92) 29.8 17.6 30.6 29.2 28.8 27.4 29.7 23.6
46–60 (n = 91) 25.5 22.4 22.4 29.2 25.4 32.3 24.5 27.2
61+ (n = 83) 23.4 38.8 20.4 18.8 20.3 12.9 21.3 25.6
n 478549485962155195
b) Patients
Age
Illiterate & Primary (n = 94) Education Middle (n = 43) High (n = 21) Total (n = 158)
Male Female Male Female Male Female Male Female
16–30 (n = 11) 2.1 0.0 21.9 9.1 5.9 25.0 9.3 3.3
31–45 (n = 16) 2.1 6.5 12.5 27.3 23.5 25.0 9.3 11.5
46–60 (n = 42) 27.1 26.1 25.0 27.3 29.4 25.0 26.8 26.2
61+ (n = 89) 68.8 67.4 40.6 36.4 41.2 25.0 54.6 59.0
n 4846321117 4 9761
Health and Quality of Life Outcomes 2006, 4:18 />Page 3 of 8
(page number not for citation purposes)
The Middlesex Elderly Assessment of Mental State
(MEAMS)
The MEAMS requires the patient to perform a number of
simple tasks, each of which is designed to test some aspect
of current cognitive functioning. These tasks are grouped
into twelve sub-tests each of which has a 'pass score'
(Table 2). A screening score of either 0 (fail) or 1 (pass) is
assigned to each subtest. These subtests are sensitive to the
functioning of different areas of brain, providing separate
assessments of perceptual skills, memory, language and
executive functions.
Briefly, 'orientation' includes five questions, which test if
the patient is orientated in space and time. The patient
must answer all five correctly to pass (Table 2). 'Name
learning' is for testing memory and asks the patient to
remember both the first and second name associated with
a photograph given earlier in the test. 'Naming' is a subtest
in which three objects are presented to the patient for rec-
ognition and naming (e.g. a watch, strap and buckle).
Each object correctly identified gains a point. 'Compre-
hension' requires the subject to name three items from
three verbal descriptions. 'Remembering pictures' requires
recognition of ten line drawings of common objects,
which are presented amongst a set of twenty drawings at a
later stage. 'Arithmetic' requires subjects to perform two
simple additions and a subtraction. In 'spatial construc-
tion' the subject is asked to draw a square and to copy a
four-point star. 'Fragmented letter perception' tests the
subjects' ability to perceive an item (letters) when it is pre-
sented in a fragmented and incomplete form. 'Unusual
views' shows objects from unusual angles. Where the sub-
ject fails to identify all of these objects, a set of usual views
are presented. 'Verbal fluency' involves asking the subject
to think of as many animals as possible in two minutes
(ten is the pass mark). Finally, 'motor perseveration' tests
executive function in five trials. Subsequently a total
screening score is calculated as the sum of the screening
scores of the 12 subtests.
Internal construct validity
The internal construct validity (unidimensionality and
validity of summed raw score) of the Turkish adaptation
of the MEAMS was assessed using the Rasch measurement
model [7,8]. The Rasch model is a unidimensional model
which asserts that the easier the item the more likely it will
be passed, and the more able the person, the more likely
they will pass an item compared to a less able person. For-
mally the probability that a person will affirm an item (in
its dichotomous form) is a logistic function of the differ-
ence between the person's ability [
θ
] and the difficulty of
the item [b] (i.e. the ability required to affirm item i), and
only a function of that difference.
where p
ni
is the probability that person n will answer item
i correctly [or be able to do the task specified by that
item],
θ
is person ability, and b is the item difficulty
parameter. From this, the expected pattern of responses to
an item set is determined given the estimated
θ
and b.
When the observed response pattern coincides with or
does not deviate too much from the expected response
pattern then the items constitute a true Rasch scale [9].
Such a scale will be unidimensional and will provide a
valid summed score which, through the Rasch transfor-
mation, will give objective linear measurement [10]. In
the analysis below it is the sum of the twelve subtests
which are fitted to the Rasch model. The Rasch model can
be extended to cope with items with more than two cate-
gories [11], and this involves an explicit 'threshold'
parameter (
τ
), where the threshold represents the equal
probability point between any two adjacent categories
within an item. When subtest scores from the MEAMS
were combined (see below) a further derivation for poly-
tomous items, the Partial Credit Model [12] was used:
where no assumptions are made about the equality of
threshold locations relative to each item.
Cut point analysis
Initially, appropriate pass scores for the normal group
were examined by distribution scores on each item. Gen-
erally all normal respondents would be expected to pass
the subtest by scoring the maximum. Thus, where less that
95% scored the maximum, further analysis was under-
taken through ANOVA, where evidence was sought of var-
iation by age, gender or education. For these sub-tests,
p
e
e
ni
b
b
ni
ni
=
+
−
−
()
()
[]
θ
θ
1
1
ln [ ]
P
P
b
nik
nik
nik
1
2
1
−
=−
−
θ
Table 2: Subtest scores of the original MEAMS.
Subtest Score
range
Pass
score
Screening score
(Total 0–12)
Orientation 0–5 5 0–1
Name Learning 0–4 2 0–1
Naming 0–3 3 0–1
Comprehension 0–3 3 0–1
Remembering Pictures 0–10 8 0–1
Arithmetic 0–3 3 0–1
Spatial Construction 0–2 2 0–1
Fragmented Letter Perception 0–4 3 0–1
Unusual Views 0–3 2 0–1
Usual Views 0–3 3 0–1
Verbal Fluency 0–10 10 0–1
Motor Perseveration 0–5 3 0–1
Health and Quality of Life Outcomes 2006, 4:18 />Page 4 of 8
(page number not for citation purposes)
post-hoc tests (Tukey B) identified homogeneous sub
groups, showing the influence of the socio-demographic
factors. From this analysis, pass rates were selected to
reflect significant differences, often varying by age and
educational level (gender seemed to be subsumed into
education). For educational level 'primary' requires a min-
imum of 5 years of education; 'middle' 8–11 years (the
duration has changed during the lifetime of many of the
subjects) and 'Higher education' at least 14 years
Following this initial adjustment, a formal test of the effi-
cacy of the revised cut points for passing a subtest was
made through Differential Item Functioning analysis
within the framework of the Rasch model [13]. This anal-
ysis pooled the data from the normal and patient groups
where, in the latter case, the first level of education also
included a number of illiterate patients. The basis of the
DIF approach lies in the item response logistic function,
the proportion of individuals at the same ability level who
can do a particular task. In the case of cognition, the prob-
ability of a person passing a subtest, at a given level of cog-
nition, should be the same for younger or older people,
men and women, and so on. Thus subtests that do not
yield the same response function for two or more groups
display DIF. In the case of determining cut points for pass-
ing a subtest, as is the case for the MEAMS, a formal test of
the validity of the cut point is the absence of DIF. For
example, if a cut point is set for passing a subtest and DIF
is present for that subtest by age, then further adjustments
need to be made to the cut point, adjusting for age, until
such a time that DIF is absent. It is crucial to remember
that this approach conditions on the construct level, in this
case cognition. Therefore it does not preclude differences
in the distribution of cognitive ability by age, rather states
that at any given level of cognitive ability, then age should
not influence pass rates. RUMM2020 provides both
graphical interpretation of DIF, as well as an ANOVA of
the residuals. Thus this DIF based ANOVA analysis is sub-
tly different from the distributional analysis of the
ANOVA approach which preceded it, as the latter does not
condition on the trait. Consequently it is possible to find
no significant difference in distribution by groups with
the distributional ANOVA, yet find DIF (through the
ANOVA of the residuals) when the underlying trait level is
taken into account, and vice versa. Where DIF was found,
further adjustments to the pass score was made until DIF
was found to be absent.
Due to the ceiling effect in the normal population it was
necessary to combine some of the subtests for the DIF
analysis when comparing invariance between the normal
and patient population. This avoided what is called
'extreme' subtests where everyone scored the maximum
and which would have precluded their analysis by the
Rasch model. Given this, data were then fitted to the
Rasch partial credit model to determine overall fit, and
how well each subtest fitted the model (to test the validity
of summating the 12 subtest pass/fail marks into an over-
all score). Three overall fit statistics were considered. Two
are item-person interaction statistics distributed as a Z sta-
tistic with mean of zero and standard deviation of one
(which indicates perfect fit to the model). A third is an
item-trait interaction statistic reported as a Chi-Square,
reflecting the property of invariance across the trait. This
means that the hierarchical ordering of the items remains
the same at different levels of the underlying trait, indi-
cated by a non-significant Chi-Square. These types of fit
statistic are mirrored at the individual item level [14].
First, as residuals (a summation of individual person and
item deviations – usually acceptable within the range ±
2.5 and approximately equivalent to the widely reported
OUTFIT zsd [15]) and secondly as a chi square statistic
(deviation from the model by groups of people defined by
their ability level – requiring a non-significant chi square
i.e. a p value of 0.05 and above, with appropriate adjust-
ment for repeated tests). Misfit of items indicates a lack of
the expected probabilistic relationship between the item
and other items in the scale. Finally, a measure of reliabil-
ity, the Person Separation Index (PSI), was computed.
This is equivalent to Cronbach's alpha but has the linear
transformation from the Rasch model substituted for the
ordinal raw score. A value of 0.7 would indicate the ability
to differentiate two groups, and 0.8 three groups [16]. Tra-
ditionally, values above 0.7 would be adequate for group
comparison, above 0.85 for individual use [17].
Statistical software and significance levels
Rasch analysis was undertaken using the RUMM2020
package [18]. During the Rasch analysis, Bonferroni cor-
rections are applied to both fit and DIF statistics due to the
number of tests undertaken [19]. A value of 0.05 is used
throughout, and corrected for the number of tests.
Results
350 subjects were recruited for the normal population,
with mean age 45.1 (SD 16.6) (Table 1). 56% were female
and 38% had a primary education. 158 patients were also
recruited with a mean age of 58.8 (SD 14.7); 38% were
Table 3: ANOVA post-hoc tests indications of significant
differences (non-overlapping homogeneous subsets) in subtests.
Subtest Age Education
Orientation * *
Name Learning *
Comprehension * *
Arithmetic * *
Spatial Construction * *
Usual Views * *
Health and Quality of Life Outcomes 2006, 4:18 />Page 5 of 8
(page number not for citation purposes)
female and 43% had a primary education. In addition
16.5% were illiterate.
Initially, scores on the various subtests for the normal
group fell into two response groups, the first being those
where at least 95% scored the maximum, suggesting that
existing pass (cut) scores were appropriate. The second
group included those subtests with a wider distribution of
scores. Here evidence was sought for variation by age, gen-
der or education. Post-hoc tests (Tukey B) identified
homogeneous sub groups, showing the influence of age
and education, but not of gender (Table 3). From these
analyses, pass rates were modified for six subtest to reflect
these significant differences (Post Anova in Table 4a).
Following this, using the pooled data of both the normal
and patient groups, data (based on pass-fail for each
subtest) were fitted to the Rasch measurement model. DIF
was found for certain subtests by age and education, but
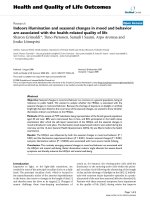
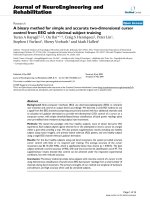
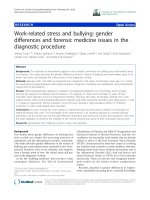
not by gender. For example, the 'fragmented Letter Percep-
tion' subtest showed clear DIF with the older least edu-
cated group having a much lower probability of passing,
at any given level of cognitive ability, than all other ages
and educational levels (age and education are con-
founded, that is those who were illiterate were predomi-
nately in the oldest age group) (Figure 1). Figure 1 plots
this probability with respect to two groups at different lev-
els of cognitive ability, with mean logit scores of around
zero for the lower cognitive ability group, and about 2 log-
Fragmented Letter Perception subtest DIF by educationFigure 1
Fragmented Letter Perception subtest DIF by education.
Table 4: MEAMS subtests requiring adjustment of pass scores by ANOVA and Rasch analysis. Bold numbers indicate adjusted scores.
Subtest Score
range
Pass score in
original version
Turkish Pass Scores (where P = primary; M = Middle and H = Higher education)
Age 16–30 Age 31–45 Age 46–60 Age 61+
PMHPMHPMHPMH
a) Post ANOVA
Orientation 0–5 5 5 5 5 5 5 5 4 554 55
Name Learning 0–4 2 22 222 211 1111
Comprehension 0–3 3 33 333 333 322 3
Arithmetic 0–3 3 33 333 333 32 33
Spatial Construction 0–2 2 1 221 221 2211 1
Usual Views 0–3 3 3 3 3 3 3 3 22 3 22 3
b) Post-Rasch
Spatial Construction 0–2 2 12 212 212 2122
Fragmented Letter Perception 0–4 3 44 444 433 3333
Unusual Views 0–3 2 22 222 222 211 1
Health and Quality of Life Outcomes 2006, 4:18 />Page 6 of 8
(page number not for citation purposes)
its for the higher cognitive ability group (termed class
intervals in the Rasch analysis). Following this, pass scores
were adjusted (e.g. in the case of 'Fragmented Letter Per-
ception' the pass score was raised for the younger group),
and data re-fitted to the model. Three subtests were
adjusted in this way (Post-Rasch in Table 4b).
Fit of the pooled data (normal plus patients) was ade-
quate with all subtests fitting the model. Overall mean
item fit was 0.184 (SD 0.319) and person fit was -0.224
(SD 0.557). The item-trait interaction was non-signifi-
cant, confirming the invariance of items (Chi Sq (df = 8)
19.6, p = 0.012). The Person Separation Index was satis-
factory (0.816) indicating the ability of the scale to differ-
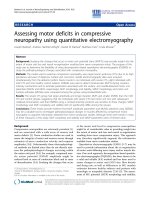
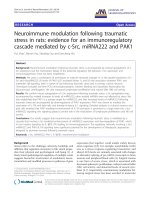
entiate at least three groups. Figure 2 shows the clear
difference in distribution of the normal (pink) and
patient (green) population (at admission), with a mean
logit location on the cognitive construct of 2.776 (SD 0.6)
for the former, and 0.580 (SD 1.5) for the latter. The final
pass scores for all subtests are presented in Table 5 and the
percentage passing each subtest are given in Table 6. All
subtests significantly discriminated between the normal
and patient groups (Chi-Square; p <.001).
Discussion
Introducing cognitive screening questionnaires into a
population such as that found in Turkey presents prob-
lems over an above those experienced in other countries
within Europe or the USA. In the first instance, access to
representative samples of the population is difficult, and
would require expensive house-to-house visiting. In part,
this is necessitated by another factor which has also been
Table 5: Final pass scores of MEAMS, adjusted for age and educational level for use in Turkey.
Subtest Score range Pass score Turkish Pass Scores (where P = primary; M = Middle and H = Higher education)
Age 16–30 Age 31–45 Age 46–60 Age 61+
PMHPMHPMHPMH
Orientation 0–5 5 555555455455
Name Learning 0–4 2 222222111111
Naming 0–3 3 333333333333
Comprehension 0–3 3 333333333223
Remembering Pictures 0–10 8 888888888888
Arithmetic 0–3 3 333333333233
Spatial Construction 0–2 2 122122122122
Fragmented Letter Perception 0–4 3 4 4 4 4 4 4 3 3 3 3 3 3
Usual Views 0–3 3 333333223223
Unusual Views 0–3 2 222222222111
Verbal Fluency 0–10 10 101010101010101010101010
Motor Preservation 0–5 3 333333333333
Distribution of the normal (pink) and the patient population (green), and subtest location, on metric cognitive scaleFigure 2
Distribution of the normal (pink) and the patient population (green), and subtest location, on metric cognitive scale.
Health and Quality of Life Outcomes 2006, 4:18 />Page 7 of 8
(page number not for citation purposes)
shown to influence scores on such measures, that is edu-
cation level and, in the case of the Turkish population, a
substantive minority of illiterate people. This is why we
undertook a preliminary study, to try and obtain at least
crude estimates of likely normal scores for the Turkish
population.
It is possible that, for example, educational levels improve
over the years, and that younger people display more
skills in some areas that give them an advantage during
cognitive testing. This is one reason why normative scores
are provided for such tests. Initially we used an ANOVA to
identify differences in scores by age, gender and education
for the normal group. We took an arbitrary level of 95%
passing the original pass score for identifying differences
in scores, and only investigated those differences below
this level. Given all scores will have a certain level of error,
we thought this was a perfectly reasonable starting point
for this analysis. The design of the normative population
sample meant that group sizes at the level of age and edu-
cational group were similar. Although we used parametric
ANOVA where perhaps a non-parametric approach would
have been more correct, we needed to see the results of
post-hoc tests where there were, for example, four groups.
Generally only two-way tests are available to determine
where pair-wise differences lie in the non-parametric
mode.
We also introduced a novel approach by assuming that
pass scores should be adjusted to ensure the absence of
DIF by age and education on each subtest. Irrespective of
distributional aspects associated with age and educational
levels, this analysis provides a formal test of the invariance
of the subtest (their values determined by the pass score)
across groups where bias is expected. Rasch analysis is par-
ticularly powerful in that both person and item parame-
ters are estimated independently and thus, for example,
item difficulties are estimated independently from the dis-
Table 6: Percentage pass scores of MEAMS, after adjustment of cut points, by subtest, for each level of educational level and age.
a) Normative
Subtest Educational Level (where P = primary; M = Middle and H = Higher education)
Age 16–30 Age 31–45 Age 46–60 Age 61+
PMHPMHPMHPMH
Orientation 96.4 87.5 100 72.4 100 91.2 83.9 84.0 88.6 84.1 89.5 75.0
Name Learning 92.9 91.7 96.9 86.2 89.7 97.1 67.7 92.0 88.6 79.5 84.2 75.0
Naming 100 100 100 100 100 100 100 100 100 100 100 100
Comprehension 92.9 91.7 96.9 58.6 89.7 97.1 93.5 100 100 95.5 94.7 95.0
Remembering Pictures 100 100 100 100 100 100 96.8 100 100 93.2 100 100
Arithmetic 92.9 100 93.8 82.8 96.6 97.1 90.3 96.0 100 86.4 89.5 100
Spatial Construction 100 100 100 100 86.2 94.1 93.5 88.0 100 93.2 84.2 90.0
Fragmented Letter Perception 100 100 100 100 100 100 100 100 100 100 100 100
Unusual Views 100 100 100 93.1 89.7 100 77.4 80.0 94.3 93.2 89.5 95.0
Usual Views 100 100 100 96.6 89.7 100 90.3 100 100 97.7 89.5 95.0
Verbal Fluency 100 100 100 100 100 100 90.3 100 100 97.7 100 100
Motor Perseveration 100 100 100 100 100 100 100 100 100 95.5 100 100
n 282432292934312535441920
b) Patients
Subtest Educational Level (where P = illiterate/primary; M = Middle and H = Higher education)
Age 16–30 Age 31–45 Age 46–60 Age 61+
PMHPMHPMHPMH
Orientation 100 62.5 50.0 50.0 71.4 60.0 52.0 72.7 66.7 45.2 52.9 37.5
Name Learning 100 50.0 100 50.0 42.9 60.0 52.0 54.5 83.3 40.3 52.9 62.5
Naming 100 100 100 100 100 100 88.0 100 83.3 96.8 100 75.0
Comprehension 100 87.5 100 50.0 28.6 80.0 44.0 90.9 83.3 77.4 100 50.0
Remembering Pictures 100 62.5 100 75.0 57.1 80.0 40.0 81.8 83.3 40.3 70.6 62.5
Arithmetic 100 75.0 50.0 50.0 42.9 100 64.0 90.9 83.3 72.6 88.2 37.5
Spatial Construction 100 50.0 50.0 75.0 14.3 60.0 44.0 45.5 66.7 37.1 29.4 50.0
Fragmented Letter Perception 100 87.5 100 100 85.7 100 76.0 90.9 100 48.4 82.4 75.0
Unusual Views 0.0 75.0 100 75.0 28.6 80.0 44.0 63.6 83.3 29.0 88.2 75.1
Usual Views 100 87.5 100 100 42.9 80.0 52.0 72.7 83.3 38.7 100 75.0
Verbal Fluency 0.0 87.5 100 100 42.9 80.0 54.0 72.7 83.3 74.2 88.2 62.5
Motor Perseveration 100 62.5 100 50.0 57.1 80.0 36.0 63.6 100 27.4 58.8 75.0
n 1824752511664178
Health and Quality of Life Outcomes 2006, 4:18 />Page 8 of 8
(page number not for citation purposes)
tribution of persons [8]. Normality of distribution is not
assumed and thus the lack of normality amongst the
patient sample does not affect parameter estimates.
Indeed, for purposes of parameter estimation, it is more
important to have a good distribution across the trait,
which is why we combined the normal and patient popu-
lation for this purpose. However, we did have to accept
some reduced precision when we created combinations of
subtests to overcome ceiling effects when we wanted to
compare patients with the normal population.
It is important to note that this type of analysis is linked
to the internal construct validity of the scale – whether or
not it meets the requirements of fundamental measure-
ment – and does not indicate whether or not the pass rate
is clinically useful or valid, which is the province of exter-
nal validity. However, where clinical or other cut points
are established by other means, if they fail to meet the
requirements of the absence of DIF by relevant groups,
then the unidimensionality of any summative score is
compromised and group comparison is not valid. Where
cut points are already established, as in the current case,
we would argue that analysis of DIF represents an elegant
mechanism for establishing and correcting for bias under
such circumstances. This bias does not necessarily mani-
fest though the ANOVA distributional analysis, and raises
important issues about the mechanisms used to adapt
scales with cut points into populations which differ from
the original.
Conclusion
In conclusion, the MEAMS demonstrates good internal
construct validity for the measurement of mental state in
the adult Turkish population, and the revised cut points
accommodate for age and educational differences.
Although most subtests show a ceiling effect in the nor-
mal population, for example, 'naming' and 'fragmented
letter perception', no subtest shows a ceiling effect in the
patient group, and the subtests have been shown to be
highly discriminatory between the normative group and
the patients. Further studies are required to ascertain the
validity of the instrument in different diagnostic groups.
Finally, the use of DIF as a basis for analysing bias in cut
points is recommended as a routine assessment where
clinical cut points may be confounded by socio-demo-
graphic characteristics.
Competing interests
The author(s) declare that they have no competing inter-
ests.
Authors' contributions
AK, SK and AT were involved with the conception and
design of the study. AK and SK arranged the data collec-
tion, took part in the interpretation of the data, and the
writing of the manuscript. AT and AE undertook the data
analysis and interpretation, and also participated in writ-
ing the manuscript. All authors read and approved the
final manuscript.
References
1. Beaton DE, Bombardier C, Guillemin F, Ferraz MB: Guidelines for
the process of cross-cultural adaptation of self-report meas-
ures. Spine 2000, 25:3186-3191.
2. Kutlay S, Kucukdeveci AA, Gonul D, Tennant A: An Adaptation
and validation of the Turkish version of the Rheumatoid
Arthritis Quality of Life Scale. Rheumatol Int 2003, 23:21-26.
3. Küçükdeveci AA, Sahin H, Ataman S, Griffiths B, Tennant A: Issues
in cross-cultural validity: Example from the adaptation, reli-
ability and validity testing of a Turkish version of the Stan-
ford Health Assessment Questionnaire (HAQ). Arthritis Rheum
2004, 51:14-19.
4. Golding E: Middlesex Elderly Assessment of Mental State.
Thames Valley Test Company; 1988.
5. Shiel A, Wilson BA: Performance of stroke patients on the Mid-
dlesex Elderly Assessment of Mental State. Clin Rehabil 1992,
6:283-289.
6. Nunnally JC: Psychometric Theory. 2nd edition. New
York:McGraw Hill; 1978.
7. Rasch G: Probabilistic models for some intelligence and
attainment tests. Chicago: University of Chicago Press; 1960.
(Reprinted 1980).
8. Andrich D: Rasch models for measurement London:Sage; 1988.
9. Angoff WH: Perspectives on Differential Item Functioning
Methodology. In Differential Item Functioning (pp 3–23) Edited by:
Holland PW, Wainer H. Hillsdale, New Jersey: Lawrence Erlbaum;
1993.
10. Perline R, Wright BD, Wainer H: The Rasch model as additive
conjoint measurement. Applied Psychological Measurement 1979,
3:237-256.
11. Andrich D: Rating formulation for ordered response catego-
ries. Psychometrica 1978, 43:561-573.
12. Masters GN: A Rasch model for partial credit scoring. Psy-
chometrika 1982, 47:149-174.
13. Tennant A, Penta M, Tesio L, Grimby G, Thonnard J-L, Slade A, Law-
ton G, Simone A, Carter J, Lundgren-Nilsson A, Tripolski M, Ring H,
Biering-Sørensen F, Marincek C, Burger H, Phillips S: Assessing and
adjusting for cross cultural validity of impairment and activ-
ity limitation scales through Differential Item Functioning
within the framework of the Rasch model : the Pro-ESOR
project. Med Care 2004, 42:37-48.
14. Tennant A, McKenna SP, Hagell P: Application of Rasch Analysis
in the Development and Application of Quality of Life Instru-
ments. Value Health 2004, 7:S22-S26.
15. Wright BD, Stone MH: Best Test Design. Chicago:Mesa Press;
1979.
16. Fisher WP: Reliability statistics. Rasch Measure Transactions 1992,
6:238.
17. Streiner DL, Norman GR: Health measurement scales. Oxford:
Oxford University Press; 1995.
18. Andrich D, Lyne A, Sheridon B, Luo G: RUMM 2020. Perth WA:
RUMM Laboratory; 2002.
19. Bland JM, Altman DG: Multiple significance tests: the Bonfer-
roni method. BMJ 1995, 310:170.