báo cáo hóa học:" A reliable measure of frailty for a community dwelling older population" doc
Bạn đang xem bản rút gọn của tài liệu. Xem và tải ngay bản đầy đủ của tài liệu tại đây (596.13 KB, 14 trang )
RESEARC H Open Access
A reliable measure of frailty for a community
dwelling older population
Shahrul Kamaruzzaman
1,2*
, George B Ploubidis
1
, Astrid Fletcher
1
, Shah Ebrahim
1
Abstract
Background: Frailty remains an elusive concept despite many efforts to define and measure it. The difficulty in
translating the clinical profile of frail elderly people into a quantifiable assessment tool is due to the complex and
heterogeneous nature of their health problems. Viewing frailty as a ‘latent vulnerability’ in older people this study
aims to derive a model based measurement of frailty and examines its internal reliability in community dwelling
elderly.
Method: The British Women’ s Heart and Health Study (BWHHS) cohort of 4286 women aged 60-79 years from 23
towns in Britain provided 35 frailty indicators expressed as bi nary categorical variables. These indicators were
corrected for measurement error and assigned relative weights in its association with frailty. Exploratory factor
analysis (EFA) reduced the data to a smaller number of factors and was subjected to confirmatory factor analysis
(CFA)which restricted the model by fitting the EFA-driven structure to observed data. Cox regression analysis
compared the hazard ratios for adverse outcomes of the newly developed British frailty index (FI) with a widely
known FI. This process was replicated in the MRC Assessment study of older people, a larger cohort drawn from
106 general practices in Britain.
Results: Seven factors explained the association between frailty indicators: physical ability, cardiac symptoms/
disease, respiratory symptoms/disease, physiological measures, psychological problems, co-morbidities and visual
impairment. Based on existing concepts and statistical indices of fit, frailty was best described using a General
Specific Model. The British FI would serve as a better population metric than the FI as it enables people with
varying degrees of frailty to be better distinguished over a wider range of scores. The British FI was a better
independent predictor of all-cause mortality, hospitalization and institutionalization than the FI in both cohorts.
Conclusions: Frailty is a multidimensional concept represented by a wide range of latent (not directly observed)
attributes. This new measure provides more precise information than is currently recognized, of which cluster of
frailty indicators are important in older people. This study could potentially improve quality of life among older
people through targeted efforts in early prevention and treatment of frailty.
Background
Identifying frail elderly people in clinical practice or in
the wider population through various aspects o f their
health and social status is a challenge worth attemp ting
as it would enable pre-emptive action to be taken that
might avoid serious sequelae at individual and popula-
tion levels. Frailty has been measured using markers
such as physical ability, self reported health indicators
and wellbeing, co-morbidity, physiological markers as
well as psycho social factors. Despite the efforts to quan-
tify this experience, there is currently no standardized
definition of frailty in older adults or a consensus on
how it should be measured. This is evident from the
numerous existing frailty measures which were driven
by a common goal of reducing the burden of suffering
that frailty entails - hospitalisation [1,2], falls [2- 4], insti-
tutionalisat ion [5,6] and death [1-3,5-9]. A standardized
definition could target health and social care for elderly
people by enabling early detection and thereby reduce
adverse outcomes and costs of care. This may also lead
to more effective strategies to prevent or delay the onset
of frailty as well as interventions that target the ‘pre-frail
* Correspondence:
1
Department of Epidemiology and Population Health, London School of
Hygiene and Tropical Medicine, Keppel Street, WC1E7HT, London, UK
Full list of author information is available at the end of the article
Kamaruzzaman et al. Health and Quality of Life Outcomes 2010, 8:123
/>© 2010 Kamaruzzaman et al; licensee B ioMed Central Ltd. This is an Open Access article distributed under the te rms of the Creative
Commons Attribution License ( whic h permits unrestricted use, distribution, and
reproduction in any medium, provided the original work is properly cited.
elderly’ or those at high risk of becoming frail. These
efforts would be aimed at improving the quality of life
of older people.
The current situationhasevolvedwhere“ frailty” is
used without a standardized definition, measured in a
variety of ways and for a range of purposes [10]. The
lack of consensus is reflected in three types of measures
that exist in literature - rules based, clinical judgement
and indexes [11]. The first determined that frailty was
made up of a set number of criteria. Fried’ s rul es- bas ed
frailty criteria as validated by other studies [1,3,7], give
primacy to physical measures of frailty. Other measures
assumeamulti-dimensional form [12-14] or, at the
other extreme, a single component physical/physiologi-
cal measure such as grip strength [15], walking speed
[16], functional reach [17] and blood markers [18,19].
Frailty m easures relying on clinical judgement to inter-
pret results of history taking and clinical examination
are unlikely to be repeatable and will vary from clinician
to clinician making them of little value for research or
audit purposes[6]. The frailty index approach is based
on a propo rtion of deficit s accumulated in an individual
in relation to age [20,21]. The problem with this mea-
sure is the use of ‘unweighted’ variables that assume
that deficits such as ‘cancer’ and ‘arthritis’ are of equal
importance to one another in indexing frailty. Also, in
large indexes (40 or more variables) a smaller subset of
items, selected at random, were similarly associated with
the risk of adverse outcomes as the whole set of items
[21]. The more variables considered, the greater the pro-
blems of measurement error and missing data. Despite
its reproducibility, [22,23] and high correlation with
mortality[5,21],theindexmeasureistimeconsuming
and not widely used clinically. Additionally, all three
types of measures may not be measuring frailty alone
but also comprise other entities that overlap with frailty
such as morbidity or disability. Although these frailty
measures provide useful information on frailty markers
from clinical and physiological characteristics that show
strong correlation with the risk of adverse outcomes, a
standardized measure of frailty would be better placed
to provide adequate evidence to inform policy and clini-
cal practice.
To date, no model of frailty based on defining and
quantifying frailty on a purely data driven approach has
been produced. Thus we proposeafrailtymodeldevel-
oped from factor analysis (FA), a rob ust analytical tech-
nique which uses latent variables as a means of data
reduction to represent a wide range of attributes/varia-
bility among observed variables on a smaller number of
dimensions or factors[24]. These latent factors are not
directly observed but rather inferred (through a statisti-
cal model) from directly observed or measured variables
[25]. This mirrors the concept of frailty as a latent
vulnerabilit y in older adults, subtl e, often asymptomatic
and only evident over time when exces s vulnerability to
stressors reduces the older person’ s ability to maintain
or regain their homeostasis[26]. Our model’ sadvantage
over previous frail ty measures is that it corrects for
measurement error and assigns relative weights in the
association of each indicator with frailty. By controlling
for measurement error, this method tested the assump-
tion of whether the frailty measure is uni-dimensional
or not. Potential sources of the amount of error, both
random and systematic inherent in any measurement
can range from the mistaken or biased r esponse of
patients on self rated health questionnaires to the error
of measurement when taking their weight, height or
blood pressure
In this paper we develop a model- based measure of
frailty and examine its reliability for use in a community
dwelling elderly population. We also compared the pre-
dictive ability of this new frailty measur e with a widely
known frailty index[27] in relation to adver se outco mes
such as all cause mortality, time to hospitalization and
institutionalization.
Method
Data and study population
The British Women’s Heart and Health Study (BWHHS)
cohort of women provide the dataset for the construct
of frailty. Its methodology has been fully described else-
where[28]. Briefly, between 1999 to 2001, a cohort of
4286 women aged 60-79 years was recruited from gen-
eral practice lists in 23 nationally representative UK
towns. Participants attended an interview where they
were asked about diagnosed diseases and underwent a
medical examination that recorded blood pressure, waist
and hip circumference, height and weight. The women
completed a questionnaire collecting behavioural and
lifestyle data, including smoking habit, alcohol consump-
tion and indicators of socio-economic position.
Thirty five (35) indicators represented a multidimen-
sional view of frailty incorporating its physical, physiolo-
gical, psychological and social aspects. These frailty
indicators included those in existing literature
[11,13,20,26,27,29,30] that were also available in the data-
set. These included variables derived from self-reports of
health status, diseases, symptoms and signs, social as well
as lifestyle indicators (see Additional file 1: Supplemen-
tary Table S1). Blood investigations (see Additional file 1:
Supplementary Table S2) were deliberately excluded to
create a measure that was non- invasive and practical to
identify elderly people at risk i n a primary care setting.
These were extracted from the BWHHS database and
recoded into binary categorical variables.
This model derived from the BWHHS data was repli-
cated using data from the “usual care” arm of a large
Kamaruzzaman et al. Health and Quality of Life Outcomes 2010, 8:123
/>Page 2 of 14
randomised trial of health care in general practice for
people aged 75 and over. General practices from the
MRC General Practice Research Framework were
rec ruited to the trial[31]. The sampling of practices was
stratified by tertiles of the standardized mortality ratio
(mortality experience of a local area relative to the
national mortality) and the Jarman score [32] (a measure
of area deprivation) to ensure a representative sample of
the mortality experience and deprivation levels of gen-
eral practices in the United Kingdom. Practices were
randomly assigned to two groups receiving targeted or
universal screening. All participants received a brief
multidimensional assessment followed, in the universal
arm by a nurse led in-depth assessment while in the tar-
geted arm the in-depth assessment was off ered only to
participants with pr e-determined problems at the brief
assessment. The in depth assessment included a wide
range of health related, social and psychological factors
while in the targeted arm only elected patients had a
full assessment. The baseline assessments were per-
formed between 1995 and 1999. In these analyses we
used data only from participants in the universal arm
(53 practices) as they were considered a representative
sample of com munity dwelling older people receiving
“usual” care. People living in nursing homes were not
eligible for the trial. This study has approval from the
23 Local Research Ethics Committees covering our
BWHHS study population. All women gave signed
informed consent at baseline. Local Research Ethics
Committee approvals were similar ly obtained for all the
practices participating in the MRC trial.
In both cohorts, a complete case was defined as those
respondents with complete data on all 35 frailty indica-
tors. There were 4286 women r espondents from the
BWHHS database of which 1568 had complete data.
People in the MRC replication dataset comprised 9032
women (6709 compl ete data) and 5622 men (4486 com-
plete data).
Since their time of entry into the study until the cen-
sored date of 10
th
August 2008, there were 633 deaths
among the BWHHS study cohort giving a median follow
up period of 8.2 years (range 4 months to 9.3 years). In
the MRC assessment study, since their entry into the
study until th e 4th of October 2007, 7469 out of 11195
respondents of the MRC Asses sment study have died
(66.7%). Of the 6709 women, 4197 had died (62.6%). Of
the 4486 men, 3272 had died (72.9%). In the mortality
analysis, all MRC respondents were followed up for a
median time of 7.9 years (range 22 days to 12.6 years.
When ‘time to first hospital admission’ wasusedasthe
outcome measure, the MRC respondents were followed
up for a median time of 2 years (range 22 days to 2
years). This shorter follow up period for hospitalization
data was because these data were not collected for the
full duration of follow up. For similar reasons, in the
analysis using admission into an institution as the out-
come measure, all MRC respondents were followed up
for a median time of 3.9 years (range 1.6 to 5.7 years).
Statistical analysis: Factor analysis with Exploratory Factor
Analysis (EFA) and Confirmatory Factor Analysis (CFA)
In order to better define frailty, factor analysis (FA)
appropriate for binary data was conducted using the
Mplus s oftware (version 4.2). FA is a statistical techni-
que used to analyze correlat ions among a wide range of
observed variables to explain these variables, largely or
entirely, in terms of their common underlying (latent)
dimensions called factors, in t his case, frailty[24]. EFA
was used to explore the underlying factor structure of
the frailty indicators and develop the construct/hypoth-
esis of frailty. The resulting EFA model was subjected to
CFA to furt her test this latent structure. We proceeded
by testing the higher order dimensionality of the EFA
driven 1
st
order solution by estimating a 2
nd
order and a
general specific model. In EFA as well as the three CFA
models (1
st
order, 2nd order and General Specific Mod-
els), Mplus initially estimated the factor loadings and
item thresholds. Standardised factor loadings can be
thought of as the correlation of the original/manifest
variable (frailty indicator) with a latent factor and are
useful in determining the importance of the original
variable to the factor. Item threshold refers to the level
of the latent factor (i.e. frailty) that needs to be attained
for a response shift in the observed variables. Although
the response sca le for each frailty indicator is binary (1
“present” or 0 “absent”), the underlying factor model
assumes that each indicator varies on an underlying
continuous scale and each person can be located on
that continuum[33]. Persons located above a certain
threshold on that continuum will endorse that the frailty
indicator was present. Each of these possible measure-
ment models were analyzed to see which best fit the
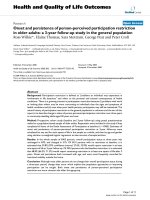
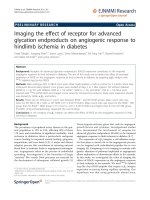
data as well as the concept of frailty. Figure 1 gives an
overview of the steps taken in factor analysis.
Factor analysis was carried out on respondents with
complete data on all 35 frailty indicators, which resu lted
in a stud y population of 1568 complete cases, as well as
the total study population of 4286 women which
included those with partial data (i.e. those with at least
one frailty indicator missing). In addressing the problem
of missing data in the frailty indicators used in the ana-
lysis, the model was estimated with the WLSMV
(Weighted Least Squares, Mean and Variance adjusted)
which applies pair-wise missing data analysis using all
individuals with observations for all possible pairs of
variables in the data. Individu als with partial data are
therefore retained in the analyses and their information
was used for all further analyses. In our case, the pairs
Kamaruzzaman et al. Health and Quality of Life Outcomes 2010, 8:123
/>Page 3 of 14
are frailty items. A sensitivity analysis using an
unpaired t-test was carried out to compare the mean
difference between the complete case frailty score of
1568 women and the frailty scores of the total popula-
tion of 4286 women with m issing frailty indicators
included. At a 5% level, the difference in means was not
significant with a p value of 0.54, showing no difference
in mean scores derived from both groups. Hence further
analysis was carried out using the total BWHHS study
population of 4286 women
In both datasets, complete c ases were compared to
cases with missing data, by looking at goodness of fit
indices and at factor loadings in eac h dataset. In the
model of choice, the derived factor score for frailty (i.e.
scores of a subject on the frailty factor) was examined
to explore the distribution of frailty by age and/sex in
each study population.
Goodness of fit test
The Scree plot approach, the Kaiser-Guttman rule (for
EFA only) and indices of fit such as the Comparative Fit
Index (CFI), the Tucker Lewis Index (TLI) and the Root
Mean Square Error of Approximation (RMSEA) (for both
EFA and CFA) were used as a means of evaluating results
of the FA. Both the Scree p lot and Kaiser-Guttman rule
was used to decide on the number of factors/dimensions
to be retained for further analysis[34]. The Scree plot is a
graph of each eigen value which represents the total
variance of each factor, (Y-axis) against the factor with
which it is associated (X-axis). The Kaiser Guttman rule
retains only factors with eigen value larger than 1[34].
The CFI refers to the discrepancy function adjusted for
sample size. TLI was used to assess the incremental fit of
a model compared to a null model . Both range from 0 to
1 with a larger value indicating better model fit . Accepta-
ble model fit is indicated by a CFI and TLI value of 0.95
or greater. RMSEA is related to residual in the model.
RMSEA values range from 0 to 1 where an acceptable
model fit is indicated by an RMSEA value of 0.06 or less.
A chi-squared goodness of fit test and these indices of fit
were used to assess model fit as suggested by guidelines
proposed by Hu and Bentler [35]. These goodness of fit
indices were emphasized since the chi-squared test was
deemed highly sensitive to sample size, leading to rejec-
tion of well-fitting models.
Comparison of the new frailty measure with a widely
known frailty index
We compared the predictive ability of our new measure,
the British frailty index (BFI), with the Canadian Study
of Health and Aging (CSHA) frailty index[27]. Apart
from being closely related to a more multi dimensional
concept of f railty, the CSHA index is one of the most
widely published frailty measures, having been evaluated
in many study populations [22,36-38]. The CSHA frailty
index was calculated as the proportion (from a given
set) of deficits present in a given individual, and indicat-
ing the likelihood that frailty was present. The ranges of
deficits were counted from variables collected from self-
reports or clinically designated symptoms, signs, disease
and disabilities that were readily available in survey or
clinical data. The variables for each FI were recoded as
binary with value ‘1’ when the deficit was present and ‘0’
when absent. For example, if a total of 20 deficits were
considered, and the individual had 3, then the frailty
index value is 3/20 = 0.15.
FI = X/Y = Sum of deficits/total number of variables
Using the equation above, the CSHA frailty index was
developed using unweighted variables from the BWHHS
and MRC assessment study datasets. The difference
between the variables included in the CSHA FI and
those used w hen developing the BFI are given in Addi-
tional file 1. This identifies the more important and
higher weighted variabl es in the BFI that were derived
from factor analysis and allows us to differentiate it
from the unweighted CSHA FI.
Cox regression analysis
Cox proportional hazards regression analysis was used
to compare the difference between hazard ratios for
Figure 1 Overview of steps in factor analysis using the BWHHS
frailty indicators.
Kamaruzzaman et al. Health and Quality of Life Outcomes 2010, 8:123
/>Page 4 of 14
adverse outcomes when using the British FI and the
CSHA frailty index. Hazard ratios for all cause mortality
were compared in both the BWHHS and MRC assess-
ment study datasets and risk of first hospital admission
and institutionalization was assessed using da ta that was
only available in the MRC assessment study.
As there was no violation of the proportional hazards
ass umption in the BWHH S dataset, the hazard ratio for
all cause mortality was calculated for the whole follow
up period ranging from 4 months up to 9.3 years. How-
ever, the assumption of non-proportional hazards was
violated in the MRC assessment study. To fulfill the
assumption of proportional hazards, the analysis time
was split or divided into three shorter time periods: 0 to
2.5 years, 2.5 to 5.5 years and 5.5 to 12.6 years (end of
follow up time).
In both datasets, the covariates introduced into the
Cox regression model were age, sex (MRC study only),
marital status, housing tenure, living alone or otherwise,
social contact (good or poor), smoking, alcohol intake
and socioeconomic position (SEP) scores (BWHHS
only). Crude, partially adjusted (age and/or sex) and
fully adjusted models were fitted for these outcomes. To
address the problem of missing data in the BWHHS
covariates that were adjusted for in the Cox regression
model,amultipleimputationprocedureprovided
unbiased estimates of the parameters and their standard
errors in the model. This was not necessary for the
MRC assessment covariates adjusted for, as they had
less than 2% missing data.
Results
Exploratory factor analysis (EFA)
Seven factors were needed to adequately explain the
association between the frailty indicators and were
labelled as: physical ability, cardiac disease or symptoms,
respiratory disease or symptoms, physiological measures,
psychological problems, co morbidity and visual
impairment.
Each of these identified latent factors was derived
from subsets of indicators that correlated strongly w ith
each other and weakly with other indicators in the data-
set. They provided meaningful theoretical ‘explanations’
or ‘interpreta tions’ linking them to the overall construct
of frailty. ’Physical ability’ comprised of highly corre-
lated indicators such as level of activity, ability to do
household chores, go up and downstairs, walk out and
about wash, dress or groom oneself. ‘ Cardiac and
respiratory disease or symptoms’ included self report or
doctor diagnosis of myocardial infarction, angina,
asthma, chronic obstructive airways disease or emphy-
sema and their associated symptoms of chest pain or
disc omfort, pain on uphill or level walking, shortness of
breath, increase cough or frequent wheeze. The
‘ physiological measures’ in cluded body mass index
(BMI), waist hip ratio (WHR), pulse rate, blood pressure
as well a s evidence of orthostatic hypotension. Markers
such as subjective feelings of anxiety or depression, self
reports and diagnosis of m emory problems and depres-
sion were meaningfully explained by ‘psychological pro-
blems’ . Other indicators such as stroke, diabetes,
hypertension, peptic ulcers, thyroid disease and cancer
were also explained by ‘ comorbidity’ .Lastly,’ visual
impairment’ explained the correlations betwe en indica-
tors of diagnosed cataract or glaucoma as well as a self-
report of visual problems.
Confirmatory Factor Analysis (CFA)
We empirically compared three latent structures based
on the EFA seven factor model: 1st order, 2nd order
and General specific models. Model fit statistics for each
of the models tested in both BWHHS and MRC datasets
are shown in Table 1. These results support the conten-
tion that the frailty model of choice for both BWHHS
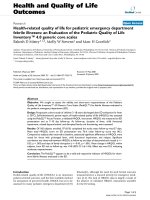
women and the MRC Assessment study (both men and
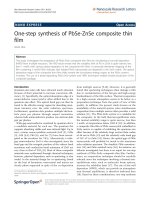
women) was the General Specific model (see Figure 2).
General refers to frailty, the general factor that is loaded
(explained by) all the indicators. Specific refer to the 7
latent factors t hat account for the association between
the frailty indicators and the specific dim ensions/factors.
The fit of the General Specific frailty model was better
than each of the other two models (see Additional file 1:
Supplementary figure F1: First order model and Supple-
mentary figure F2: Second order model) in both data-
sets. This was true for participants with complete data
as well as those with missing data, with very little differ-
ence between them.
In the BWHHS complete data, standardized factor
loadings of the frailty indicators by the overall Frailty
factor (i.e. correlations of the observed frailty indicators
with Frailty) revealed highest loadings (0.60-0.77) on
indicators such as being ‘short of breath on level walk-
ing’, the inability to do ‘ household chores’, ‘walking up
and down stairs’, ‘walking about’, ‘wash and dress’,’ hav-
ing a low ‘status activity level’ as well as ‘difficulty going
out’. This is followed by midrange loadings (0.3-0.55) of
having symptoms of ‘ angina’, ‘chest discomfort’ or ‘ever
having ches t pain’ , ‘ art hritis’ ,’ feeling ‘ anxious or
depressed’ , ‘memory problems’ ,havinga‘ high body
mass index (BMI)’ or ‘waist hip ratio’, ‘eyesight trouble’,
‘hearing trouble’ as well as having specific diseases (see
Table 2). These ‘weighted’ loadings form the basis of an
idea for which indicator woul d be useful to include in a
frailty measure. When replicated in the MRC complete
dataset of women, these factor loadings were similar to
the BWHHS dataset. Factor loadings for ‘
hypertensi on’
and ‘waist hip ratio’ by overall frailty were lower in men
compared to women in the MRC dataset.
Kamaruzzaman et al. Health and Quality of Life Outcomes 2010, 8:123
/>Page 5 of 14
In the general specific model, the standardized factor
loadings of frailty indicators on the seven specific laten t
factors (correlation of individual frailty indicators with
each specific factor), are s hown in Table 3. These load-
ings show how differently the frailty indicators correlate
with frailty, compared to their specific factors. The dif-
ferences in the values reflect the degree of correlation of
the variable with either factor, for example; the variable
‘ angina’ has a factor loading of 0.550 on the general
(frailty) factor and a loading of 0.619 on its speci fic fac-
tor (Cardiovascular symptoms/disease) with both factors
independent of each other. Hence although ‘angina’
loads highly under its specific factor, its correlation with
frailty in relation to all other variables is lower. The
model produced indiv idual frailty scor es for all subjects
in each dataset.
The distribution of frailty in BWHHS women and
both men and women of the MRC assessment study, by
Table 1 Results from confirmatory factor analysis for the BWHHS and MRC Assessment Study (Complete cases and
Missing)
CFA 1
st
ORDER MODEL
Indices of
Model Fit
BWHHS Complete Cases
(FEMALE)
BWHHS
Missing
(FEMALE)
MRC Complete Cases
(FEMALE)
MRC Missing
(FEMALE)
MRC Complete Cases
(MALE)
MRC Missing
(MALE)
X
2
6404.29 22275 42380 76468 23473 39003
df 195 251 292 290 266 264
p 0.000 0.000 0.000 0.000 0.000 0.000
CFI 0.938 0.932 0.962 0.968 0.941 0.962
TLI 0.949 0.950 0.970 0.976 0.955 0.972
RMSEA 0.032 0.032 0.025 0.027 0.029 0.027
CFA 2
nd
ORDER MODEL
Indices of
Model Fit
BWHHS Complete Cases
(FEMALE)
BWHHS
Missing
(FEMALE)
MRC Complete Cases
(FEMALE)
MRC Missing
(FEMALE)
MRC Complete Cases
(MALE)
MRC Missing
(MALE)
X
2
6404 22275 42380 76468 1820 39003
df 195 251 292 290 355 264
p 0.000 0.000 0.000 0.000 0.000 0.000
CFI 0.931 0.925 0.954 0.960 0.937 0.957
TLI 0.944 0.946 0.965 0.970 0.953 0.969
RMSEA 0.034 0.033 0.027 0.029 0.030 0.028
GENERAL SPECIFIC MODEL
Indices of
Model Fit
BWHHS Complete Cases
(FEMALE)
BWHHS
Missing
(FEMALE)
MRC Complete Cases
(FEMALE)
MRC Missing
(FEMALE)
MRC Complete Cases
(MALE)
MRC Missing
(MALE)
X
2
6404 22275 42380 76468 23473 39003
df 195 251 292 290 266 264
p 0.000 0.000 0.000 0.000 0.000 0.000
CFI 0.957 0.948 0.967 0.969 0.954 0.970
TLI 0.964 0.962 0.974 0.976 0.964 0.978
RMSEA 0.027 0.028 0.024 0.026 0.026 0.024
Cut off criteria for good fit- CFI&TLI > 0.95, RMSEA < 0.06- Hu and Bentler 1990.
Figure 2 The General Specific Model.
Kamaruzzaman et al. Health and Quality of Life Outcomes 2010, 8:123
/>Page 6 of 14
age group and sex show that the BWHHS women (ages
ranged from 60 to 79 years) in the older age group
(over 75 years) had higher frailty scores i.e. were more
frail compared to the younger age group (median scores
0.015 vs. 0.276). They also appeared to be more frail
when compared to the MRC women, all of whom were
over 75 years old (median scores 0.276 vs. 0.132). In the
MRC women, the median frailty scores increased with
age and when stratified, were higher in those in the
older age groups of 80-84 years and 85 years and above,
with scores of 0.213 and 0.578 respectively. The MRC
men, whose scores also increased with age, were less
frail compared to the women (median scores -0.811 vs.
0.132). A comparison of the dist ribution of the BFI and
Table 2 Standardized Factor loadings of the general/overall Frailty factor derived from the General Specific model in
both the BWHHS and the MRC Assessment study
Variable factor
Loadings:
BWHHS complete
cases
BWHHS
Missing
MRC female
Complete cases
MRC Female
missing
MRC Male Complete
cases
MRC Male
missing
Household chores 0.736 0.759 0.632 0.722 0.718 0.765
Up and downstairs 0.725 0.748 0.739 0.800 0.791 0.808
Walkabout/walkout 0.685 0.673 0.745 0.821 0.865 0.878
Difficulty going out 0.601 0.635
Wash and/or dress 0.612 0.594 0.592/0.521 0.683/0.620 0.657/0.604 0.712/0.685
Status activity level 0.616 0.585 0.655 0.731 0.746 0.785
Arthritis 0.421 0.434 0.324 0.322 0.176 0.206
Falls 0.261 0.390 0.342 0.389 0.387 0.444
Eye sight trouble 0.410 0.385 0.485 0.486 0.438 0.467
Cataract 0.325 0.305 0.229 0.201 0.180 0.186
Glaucoma 0.195 0.158 0.054 0.063 0.065 0.031
Angina 0.550 0.587
Ever had chest pain 0.401 0.413 0.287 0.254 0.274 0.250
Chest discomfort 0.405 0.482 0.331 0.279 0.341 0.297
Myocardial Infarction 0.344 0.433 0.303 0.281 0.310 0.273
Asthma 0.263 0.347 0.196 0.154 0.224 0.201
Bronchitis/emphysema 0.260 0.320 0.336 0.284 0.369 0.311
Short of breath on
level walking
0.770 0.815 0.676 0.624 0.699 0.683
Increased cough/phlegm 0.247 0.303 0.193 0.150 0.220 0.220
Morning phlegm 0.305 0.394 0.267 0.231 0.281 0.278
Depression 0.300 0.390 0.172 0.150 0.214 0.195
Anxious or depressed/sad 0.418 0.462 0.426 0.405 0.367 0.404
Memory problems 0.365 0.399 0.349 0.354 0.396 0.447
Hypertensive (baseline >
140/90)
0.036 -0.009 -0.054 -0.076 -0.110 -0.116
Waist Hip Ratio (>/<
0.85)
0.362 0.262 0.228 0.278 0.034 0.040
BMI (high) 0.412 0.346 0.342 0.420 0.232 0.348
Postural hypotension 0.114 0.048 -0.020 -0.009 0.046 0.060
Sinus tachycardia 0.111 0.058 -0.030 -0.028 0.120 0.102
Diabetes 0.305 0.244 0.196 0.196 0.178 0.205
Hypertension 0.340 0.304 0.110 0.060 0.090 0.064
Stroke 0.412 0.403 0.372 0.411 0.402 0.432
Stomach/peptic ulcers 0.241 0.340 0.258 0.196 0.120 0.103
Thyroid disease 0.191 0.250 0.143 0.104 -0.090 0.095
Cancer 0.150 0.072 0.033 0.014 0.042 0.018
Hearing trouble 0.310 0.344 0.357 0.337 0.265 0.290
Kamaruzzaman et al. Health and Quality of Life Outcomes 2010, 8:123
/>Page 7 of 14
Table 3 Standardized factor loadings of specific factors derived from the General Specific model
Specific Factors BWHHS complete
cases
BWHHS
Missing
MRC female
Complete cases
MRC Female
missing
MRC Male Complete
cases
MRC Male
missing
Physical Ability
Household chores 0.533 0.524 0.624 0.561 0.500 0.477
Up and downstairs 0.557 0.532 0.483 0.414 0.399 0.378
Walkabout/walkout 0.622 0.627 0.562 0.459 0.366 0.343
Difficulty going out 0.622 0.581
Wash and/or dress 0.635 0.627 0.641/0.632 0.577/0.602 0.657/0.604 0.605/0.540
Status activity level 0.217 0.263 0.470 0.411 0.746 0.274
Arthritis 0.372 0.356 0.106 0.043 0.176 0.115
Falls 0.104 0.097 0.179 0.138 0.387 0.183
Visual Impairment
Eye sight trouble 0.792 0.792 0.488 0.467 0.470 0.448
Cataract 0.678 0.706 0.612 0.636 0.649 0.626
Glaucoma 0.668 0.673 0.523 0.515 0.566 0.567
Cardiac symptoms/
disease
Angina 0.619 0.602
Ever had chest pain 0.674 0.674 0.835 0.829 0.838 0.866
Chest discomfort 0.411 0.387 0.466 0.476 0.344 0.393
Myocardial Infarction 0.885 0.797 0.68 0.702 0.737 0.733
Respiratory symptoms/
disease
Asthma 0.659 0.650 0.607 0.601 0.480 0.501
Bronchitis/emphysema 0.653 0.674 0.471 0.478 0.440 0.497
Short of breath on level
walking
0.245 0.236 0.317 0.372 0.304 0.354
Increased cough/phlegm 0.582 0.546 0.491 0.533 0.550 0.546
Morning phlegm 0.621 0.596 0.509 0.538 0.540 0.525
Psychological problems
Depression 0.583 0.524 0.156 0.228 0.365 0.335
Anxious or depressed/sad 0.773 0.8 2.174 1.501 0.721 0.792
Memory problems 0.208 0.207 0.107 0.174 0.367 0.346
Physiological markers
Hypertensive
(baseline>140/90)
0.754 0.258 1.853 0.084 1.282 1.063
Waist Hip Ratio (>/<0.85) 0.147 0.540 0.018 0.338 0.089 0.086
BMI (high) 0.149 0.464 0.045 0.722 0.039 0.068
Postural hypotension 0.339 0.111 0.120 -0.040 0.181 0.222
Sinus tachycardia 0.319 0.235 0.008 -0.060 0.058 0.016
Other co-morbidities
Diabetes 0.353 0.382 0.305 0.267 0.253 0.188
Hypertension 0.567 0.467 0.542 0.647 0.507 0.591
Stroke 0.576 0.490 0.380 0.318 0.386 0.340
Stomach/peptic ulcers -0.090 -0.077 -0.111 -0.073 -0.154 -0.092
Thyroid disease -0.077 0.095 0.045 0.042 0.036 -0.059
Cancer -0.144 -0.062 -0.011 0.009 -0.018 -0.005
Hearing trouble -0.075 -0.208 -0.130 -0.095 -0.012 -0.044
Kamaruzzaman et al. Health and Quality of Life Outcomes 2010, 8:123
/>Page 8 of 14
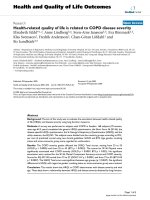
CSHA FI in both the BWHHS and MRC assessment
study cohorts are shown in Figure 3 and Figure 4. The
median score for the BFI was lower than the median
score for the CSHA FI in bot h the BWHHS study
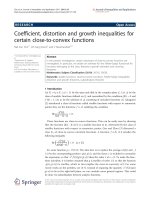
cohort (0.07 vs. 0.15) (see Figure 3) and the MRC
assessment study respondents (0.038 vs.0.19) (see Figure
4).
Cox regression analysis
The British FI was a better predictor of all cause mortal-
ity in the women of the BWHHS cohort as shown in
Table 4, when compared to the unweighted CSHA
frailty index (age adjusted HR 1.7(95% C.I: 1.6,1.7) ver-
sus 1.4(95% C.I: 1.3,1.4).
This was also true in both men and women of the
MRC assessment study cohort (see Table 5), with frailty
being a stronger predictor o f mortality earlier on in the
follow up period (between 0 to 2.5 years). The British FI
was also a better predictor of the risk of hospital admis-
sion; fully adjusted HR 1.5(95% C.I: 1.4,1. 6) vs. 1.3 (95%
C.I: 1.2,1.3) as well as institutio nalization; fully adjusted
HR 1.6 (95% C.I: 1.4,1.8) vs. 1.3 (95% C.I: 1.2,1.4) in the
MRC assessment study cohort (see Table 6). These pre-
dictions were independent of covariates such as age, sex,
socioeconomic positi on scores, smoking, alcohol intake,
living alone, marital status, housing tenure and social
contact.
Figure 3 A comparison of the distribution of the British FI and
the CSHA FI in the BWHHS cohort of 4286 women.
Figure 4 A comparison of the distribution of the British FI and
the CSHA FI in the MRC assessment study cohort of 11195
men and women.
Table 4 Hazard ratios for mortality per unit increase in
frailty scores in 4286 BWHHS women
Frailty Total(N) British FI CSHA FI
Crude 4286 1.8(1.7-2.0) 1.4(1.4,1.5)
Age adjusted 4286 1.7(1.6-1.8) 1.4(1.3,1.4)
Fully adjusted* 4280 1.4(1.3-1.5) 1.3(1.2,1.4)
p-value ** < 0.001 < 0.001
*fully adjusted for age, socioeconomic status (SES), smoking, alcohol intake,
marital status, living alone and housing tenure.
**p value is for crude, age and fully adjusted hazard ratio (HR).
Kamaruzzaman et al. Health and Quality of Life Outcomes 2010, 8:123
/>Page 9 of 14
Discussion
In order t o better define the concept of frailty in older
adults, we introduce a measurement model which was
based on theoretical underpinnings of this concept,
derived from an ‘ apriori’ knowledge and research from
existing literature [11,26,29,30] as well as statistical cri-
teria. We used factor analysis (FA) to develop and test
thehypothesisoffrailtyasa‘ latent vulnerability’ in
older adults by incorporating all possible frailty indica-
tors available to both datasets based on these criteria.
Although the BFI is most related to the deficit accumu-
lation index, its advantage over other meas ures is that it
has weighted frailty indicators corrected for measure-
ment error, which thus supports a more internally reli-
able measurement of frailty. EFA provided an initial
latent structure of seven first order latent factors and
CFA tested the hypothesis and confirmed the General
specific model as the choice to form the conceptual
basis for frailty in older adults. Using factor analysis,
specific variance and random error is removed resulting
in frailty, which is captured by the General factor (this
factor represents the common variance bet ween all the
frailty indicators, thus capturing frailty). This model best
reflects the association between frailty, its indicators and
its underlying factors, in that particular indicators are
explained by both a dominant general factor, (i.e. frailty),
as well as seven specific factors, and these factors are
mutually uncorrelated (see Figure 2). The implication is
that frailty serves as the underlying factor that contri-
butes to different forms of frailty indicators, and in addi-
tion, there are processes separ ate from this that
contribute to the development of specific factors of
visual impairment, respiratory disease/symptoms, cardiac
disease/symptoms, physical a bility, physiological mar-
kers, psychological problems and co-morbid disease,
which vary independently of frailty. By contrast, in the
2
nd
order model, frailty was seen to drive/subsume all
the factors/dimensions acting as a single broad, coherent
construct broken down into increasingly specific factors
and indicators (see Additiona l file 1: Sup plementary fig-
ure F2: Second order model).
In the 1
st
order model, frailty was represented by each
of the seven specific factors that were correlated to each
other (see Additional file 1: S upplementary figure F1:
First order model).
On a conceptual level, these models (1
st
and 2
nd
order) do not fit in with the idea of frailty. Not all the
specific factors need to be present for an individual to
be considered frail, as implied by the second order
model. For example, an elderly diabetic with ‘eyesight
trouble’ and ‘difficulty in going out’ may still be consid-
ered frail despite not having other co-morbidities, car-
dio-respiratory disease or symptoms. The problem wit h
the 1
st
order model was that the factors do not necessa-
rily need to be correlated to one another for frailty to
occur (see Additional file 1to compare the models).
External/exogenous to this measurement model were
socioeconomic status (SES) indicators such as income,
Table 5 Hazard ratios for mortality per unit increase in frailty scores in the MRC Assessment study
Follow up time (years)
0-2.5 2.5-5.5 > 5.5
Outcome Hazard ratio (95% C.I) Hazard ratio (95% C.I) Hazard ratio (95% C.I)
Crude Age Full* Crude Age Full* Crude Age Full*
British FI
All cause mortality 2.0**
(1.9,2.2)
1.9**
(1.8,2.1)
1.8**
(1.7,1.9)
1.7**
(1.6,1.8)
1.6**
(1.5,1.6)
1.5**
(1.4,1.5)
1.5**
(1.4,1.6)
1.4**
(1.3,1.5)
1.4**
(1.3,1.5)
CSHA FI (44 variables)
All cause mortality 1.6**
(1.5,1.7)
1.5**
(1.4,1.6)
1.5**
(1.4,1.6)
1.4**
(1.4,1.5)
1.3**
(1.3,1.4)
1.3**
(1.2,1.4)
1.3**
(1.3,1.4)
1.2**
(1.2,1.3)
1.3**
(1.2,1.3)
*fully adjusted for age, sex, smoking, alcohol intake, marital status, living alone, social contact and housing tenure
**p value < 0.001
Table 6 Hazard ratios for hospitalization and
institutionalization per unit increase in frailty scores in
the MRC Assessment study
Outcome Hazard ratio (95% C.I)
Crude Age Full*
British FI
First hospital admission† 1.6**(1.5-1.6) 1.5**(1.4,1.6) 1.5**(1.4,1.6)
Institutionalization‡ 2.0**(1.8,2.2) 1.7**(1.5,1.9) 1.6**(1.4,1.8)
CSHA FI (44 variables)
First hospital admission† 1.4**(1.3,1.4) 1.3**(1.2,1.4) 1.3**(1.2,1.4)
Institutionalization‡ 1.5**(1.4,1.6) 1.4**(1.2,1.5) 1.3**(1.2,1.4)
*fully adjusted for age, sex, smoking, alcohol intake, marital status, living
alone, social contact and housing tenure.
**p value < 0.001
† refers to time to first hospital admission in the first two years of follow up.
‡ refers to time to institutionalization over a median time of 3.9 years of
follow up
Kamaruzzaman et al. Health and Quality of Life Outcomes 2010, 8:123
/>Page 10 of 14
educ atio n, social clas s, marital status, lifestyle indicators
as well as soc ial contact. As frailty is likely to be socially
patterned [26], SES was expected to have a causally
influence on frailty[39]. H ence frailty can be thought of
as a mixed (reflective and formative) construct, that is
reflected in the binary frailty indicators, but also driven
by SES status[40] among other external/exogenous
forces.
Although some measures of frailty were developed by
defining and quantifying the cons truct through data dri-
ven approaches, they were n ot developed appropriately
for the binary/ordinal nature of the data. Other popula-
tion studies have developed frailty measures using prin-
cipal component analysis (PCA) [13,41,42]. Unlike one
particular study that looked for sub dimensions of a
pre-existing physical phenotype of frailty[42], our mea-
sure used all known and easily available frailty indicators
in the datasets so as to fulfil its multi-dimensional con-
cept. FA is used to identify the structure underlying a ll
the frailty indicators and provides more internal reliabil-
itytothemeasurebycontrollingformeasurement
error, as it analyzes only the variability in an indicator
that is shared among the other indicators (common var-
iance without error or unique variance) while PCA
assumes that all variability in an indicator should be
used in the analysis.
In both datasets, a majorit y of ind icators represented
by physical ability were ones that best explained frailty.
This supports the theory that frailty is identified through
characteristics directly related to physical function [26].
The analysis also highlighted the importance of ‘ short-
ness of breath on level walking’ as a more important
frailty indicator than diagnosed respiratory diseases.
Similarly, reports of symptoms such as ‘ ever having
chest pain/chest discomfort’ had higher factor loadings
than having had a myocardial infarction. These higher
loadings of self reported symptoms compar ed to d iag-
nosed conditions might reflect that the diagnosed dis-
eases were already under control or treated in our
respondents. Although co-morbidities feature d strongly
in some existing measures [13,43], our model focused
specifically on diseases such as myocardial infarction,
angina, stroke, diabetes, peptic ulcers and hypertension.
Whilst frailty has been conceptualized as a wasting
syndrome with weight loss as a key component, it was
also explained by having a high BMI and a high waist to
hip ratio in both cohorts. This finding supp orts a recent
study that showed increased levels of frailty among
those with low and very high BMI and within each BMI
category; those with a high waist circumference were
significantly more frail[44] . In view of the rise in obesity
in older populations, lifesty le modifications incorporat-
ing a healthy diet and regular exercise should be an
important agenda in the prevention of frailty and its
adverse outcomes. However these efforts should not
merely target the usual overweight/obese older adults
but those who exhibit signs of central obesity, regardless
of BMI category.
Comparisons between the British frailty index (FI) and
the well validated CSHA frailty index showed that the
British FI had greater variance in the distribution of
scores compared to the C SHA FI (see Figure 5 and 6).
Hence, the British FI would serve as a better population
metric than the CSHA FI as it enables those people
with varying degrees of frailty from low to mild, moder-
ate and severe to be better distinguished over a wider
range of scores. The British FI was a better predicto r of
all cause mortality than CSHA FI in both cohorts inde-
pendent of similar potential confounders. It was also a
better estimate of the respondents’ increased risk of hos-
pital admission per unit of frailty score than both ver-
sions of the CSHA index. However, the outcome of
hospitalization in this study only involved the time to
first hospital a dmission for each respondent during the
whole follow up period of the MRC assessment study.
These results suggest that further analyses into those
with multiple admissions would indeed be of value in
classifying the frailest among this population as it is a
comm on problem among older people and drive a large
part of the burden and costs associated with fra ilty.
Institutionalized older people are oft en labeled as frail
and hence, the risk of institutionalization has become a
recognized frailty adverse outcome. Using the British FI,
frailty also estimated a better increased and independent
risk of institutionali zation, per unit score than the
CSHA index. These f indings explain the ad vantage of
the British frailty measure over the CSHA index; in that
it is a reduced measure that corrects for measurement
error and assigns relative weights in the association of
each indicator with frailty. In developing this measure,
Figure 5 Graph-box showing median and inter-quartile ranges
of the British FI and CSHA FI in 4286 BWHHS women.
Kamaruzzaman et al. Health and Quality of Life Outcomes 2010, 8:123
/>Page 11 of 14
the weighted l atent variables that best explained frailty
were captured, excluding those that did not. This
resulted in a measure that attempts to measure frailty
itself as opposed to being an indicator of an older per-
son’s global health status. As the two different measures
of frailty are based on different theoretical constructs,
they would certainly capture different groups of older
people. Hence the results above suggest that the B ritish
FI would serve as a better predictor of adverse outcomes
in community dwelling older people than an unweighted
and additive type of index.
The strength of this study lie in the construction of a
measurement model of frailty in a large representative
cohort of British women and its replication in a further
large cohort representative of the British community-
dwelling older population of men and women, using
variables that were direct inputs from the respondents,
including both objective and subjective attributes. FA
enabled the identification of latent dimensions of frailty
that may not have been apparent from direct observa-
tion of the data. This also enabled us to develop a reli-
able measure that translated into a frailty score for use
in future analyses. Although the identification of these
seven factors were in keeping with other measures
based on similar domains[8,12,21], the development of a
tool (using indicators which are both weighted and cor-
rected for measurement error) lends added credibility to
it being a more reliable measurement of frailty. The
reliability or internal consistency of the ‘ General Speci-
fic’ model was shown by the good ness of fit of the con-
firmatory factor analysis. The validation of the model as
a measurement of frailty was reaffirmed when the same
model was tested in a larger independent cohort of the
MRC assessment study whose respondents were older of
both sexes. The higher weighted frailty indicators
provide more precise information than is currently
recognized, as to which cluste r of frailty indicators are
important in identifying frailty in older people. Further-
more, it provides important information about the survi-
val prediction of older people over long follow up
periodswhichmakesitagoodprognostictoolthat
would aid in the planning and allocation of health care
services for them.
A limitation of this study is that as the majority of the
participants are older Cau casians, our results may not
necessarily be g eneralisable to younger adults or other
ethnic groups. The BWHHS study respondents were
those who were able to attend the interview and medical
examination at baseline suggests that they were rela-
tively less frail compared to non-responders. Therefore,
this study cohort may underestimat e the degree of
frailty amo ng the populat ion it derived its sampl e from.
Another limitation is that the frailty indicators used
were derived from self-reports of symptoms/disease at
baseline; hence it is not a dynamic measure of frailty.
We concentrated on only complete cases but found
similar findings for those with missing data. Although
indicators used were ba sed on kn own indicators from
existing measures, we were limited to those available in
both datasets.
In this paper we wish to highlight the additional co n-
tribution of the BFI to the existing concepts and mea-
sures of frailty from a purely measurement point of
view. In its current form, the BFI is still in the early
stage of d evelopment and wil l need further refinement.
Although it is ready for use in a research setting, its
clinical application (as with any other scale) will require
further appropriate models in order to establish reliable
cut off points. The refined version would be able to
include missing data with fewer, higher weighted indica-
tors which are controlled for meas urement error. These
indicators represent each of the seven latent factors
ass ociated with frailty, which would be translate d into a
short answer questionnaire, making it more amenable
for use in a clinical setting. Existing measures suggests
two perspectives on frailty; its use as an indicator of
health and its use as a clinical tool. In constructing the
BFI, we recommend that the measurement of frailty
should include both perspectives.
Conclusion
This study provides a better understanding of the widely
held view of the multi-dimensional domains of frailty
and its concept as a latent vulnerability in older people.
It does so by providing a more reliable method of its
measurement that demonstrates better validity particu-
larly in relation to serious adverse outcomes when com-
pared to a widely known frailty index. This new frailty
measure may provide further opportunities and
Figure 6 Graph-box showing median and inter-quartile ranges
of the British FI and CSHA FI in 11195 MRC assessment study
respondents.
Kamaruzzaman et al. Health and Quality of Life Outcomes 2010, 8:123
/>Page 12 of 14
modifiable strategies for prevention and health promo-
tion at a population level as well improved detection,
treatment and intervention of frailty in older people at a
clinical level. Future work will involve translating this
mod el into a si mple index that is easy and non invasive
for use in a primary care setting.
Additional material
Additional File 1: Supplementary tables and figures.
SUPPLEMENTARY TABLE S1: ALL FRAILTY INDICATORS (Non-
Invasive). All the non- invasive frailty indicators included in the factor
analysis that was derived from existing literature and available to both
cohorts. SUPPLEMENTARY TABLE S2: ADDITIONAL FRAILTY
INDICATORS (Invasive). Additional invasive frailty indicators not
included in the factor analysis. Variables used to derive the CSHA FI
using the BWHHS study cohort. This is a list of 51 variables from the
BWHHS study used to derive the CSHA FI. Variables used to derive the
CSHA FI using the MRC assessment study cohort. This is a list of 44
variables from the MRC assessment study cohort used to derive the
CSHA FI. Supplementary figure F1: First order model. Figure
illustrating frailty as a first order model derived from factor analysis.
Supplementary figure F2: Second order model. Figure illust rating
frailty as a second order model derived from factor analysis.
Acknowledgements
The British Women’s Heart and Health Study (BWHHS) was funded by the
Department of Health Policy Research Programme and the British Heart
Foundation.
Shahrul Kamaruzzaman is a Senior Lecturer in Geriatric Medicine at the
Department of Medicine, Faculty of Medicine at the University of Malaya,
Kuala Lumpur, Malaysia and funded by the Ministry of Higher Education of
the Government of Malaysia.
The MRC trial of Assessment and management of older people in the
community was funded by Medical Research Council, Department of Health,
Scottish Office.
The British Women’s Heart and Health study is co-directed by Shah
Ebrahim and DA Lawlor. We thank Carol Bedford, Alison Emerton, Nicola
Frecknall, Karen Jones, Mark Taylor, and Katherine Wornell for collecting and
entering data, all the general practitioners and their staff who supported
data collection, and the women who participated in the study.
The MRC trial of Assessment and management of older people in the
community: Sponsor: Medical Research Council, Department of Health,
Scottish Office.
Trial Steering Committee: Professor Sir John Grimley Evans (Chair from Jan
2001), Professor Carol Brayne, Linda Davies (University of Manchester),
Professor Mike Drummond (University of York), Professor Andy Haines (Chair
1994-2000), Professor Karen Luker, Dr Madge Vickers.
Practices from the Medical Research Council General Practice Research
Framework (MRC GPRF): Director Dr Madge Vickers
Author details
1
Department of Epidemiology and Population Health, London School of
Hygiene and Tropical Medicine, Keppel Street, WC1E7HT, London, UK.
2
Department of Medicine, Faculty of Medicine, University of Malaya , 50603 ,
Kuala Lumpur, Malaysia.
Authors’ contributions
All authors developed the study’s aim, design and managed its data. SK
performed the statistical analysis and drafted the manuscript. GP advised
and participated in the statistical analysis. All authors have read and
approved the final manuscript.
Competing interests
The authors declare that they have no competing interests.
Received: 26 April 2010 Accepted: 28 October 2010
Published: 28 October 2010
References
1. Woods NF, LaCroix AZ, Gray SL, Aragaki A, Cochrane BB, Brunner RL,
Masaki K, Murray A, Newman AB: Frailty: emergence and consequences in
women aged 65 and older in the Women’s Health Initiative
Observational Study. [see comment]. Journal of the American Geriatrics
Society 2005, 53:1321-1330.
2. Fried LP, Tangen CM, Walston J, Newman AB, Hirsch C, Gottdiener J,
Seeman T, Tracy R, Kop WJ, Burke G, McBurnie MA: Frailty in older adults:
evidence for a phenotype. Journal of Gerontology: Medical Sciences 2001,
56:M146-156.
3. Ensrud KE, Ewing SK, Taylor BC, Fink HA, Stone KL, Cauley JA, Tracy JK,
Hochberg MC, Rodondi N, Cawthon PM: Frailty and risk of falls, fracture,
and mortality in older women: The study of Osteoporotic fractures.
Journal of Gerontology: Medical Sciences 2007, 62:744-751.
4. Nourhashemi F, Andrieu S, Gillette-Guyonnet S, Vellas B, Albarede JL,
Grandjean H: Instrumental activities of daily living as a potential marker
of frailty: a study of 7364 community-dwelling elderly women (the
EPIDOS study). Journal of Gerontology: Medical Sciences 2001, 56:M448-453.
5. Rockwood K, Howlett S, MacKnight C, Beattie B, Bergman H, Hebert R,
Hogan D, Wolfson C, McDowell I: Prevalence, attributes, and outcomes of
fitness and frailty in community-dwelling older adults: Report from the
Canadian Study of Health and Aging. Journal of Gerontology: Medical
Sciences 2004, 59:1310-1317.
6. Rockwood K, Song XW, MacKnight C, Bergman H, Hogan DB, McDowell I,
Mitnitski A: A global clinical measure of fitness and frailty in elderly
people. Canadian Medical Association Journal 2005, 173:489-495.
7. Cawthon PM, Marshall LM, Michael Y, Dam T-T, Ensrud KE, Barrett-Connor E,
Orwoll ES, Osteoporotic Fractures in Men Research G: Frailty in older men:
prevalence, progression, and relationship with mortality. Journal of the
American Geriatrics Society 2007, 55:1216-1223.
8. Saliba D, Elliott M, Rubenstein LZ, Solomon DH, Young RT, Kamberg CJ,
Roth C, MacLean CH, Shekelle PG, Sloss EM, Wenger NS: The vulnerable
elders survey: A tool for identifying vulnerable older people in the
community. Journal of the American Geriatrics Society 2001, 49:1691-1699.
9. Puts MTE, Lips P, Deeg DJH: Static and dynamic measures of frailty
predicted decline in performance-based and self-reported physical
functioning. Journal of Clinical Epidemiology 2005, 58:1188-1198.
10. Brown I, Renwick R, Raphael D: Frailty: constructing a common meaning,
definition, and conceptual framework. International Journal of
Rehabilitation Research 1995, 18:93-102.
11. Rockwood K, Hogan DB, Macknight C: Conceptualisation and
Measurement of Frailty in Elderly People. Drugs and Aging 2000,
17:295-302.
12. Strawbridge WJ, Shema SJ, Balfour JL, Higby HR, Kaplan GA: Antecedents
of frailty over three decades in an older cohort. J Gerontol B Psychol Sci
Soc Sci 1998, 53:S9-16.
13. Schuurmans H, Steverink N, Lindenberg S, Frieswijk N, Slaets JPJ: Old or
frail: what tells us more? Journal of Gerontology: Medical Sciences 2004, 59:
M562-565.
14. Studenski S, Hayes RP, Leibowitz RQ, Bode R, Lavery L, Walston J, Duncan P,
Perera S: Clinical Global Impression of Change in Physical Frailty:
development of a measure based on clinical judgment. Journal of the
American Geriatric Society 2004, 52:1560-1566.
15. Syddall H, Cooper C, Martin F, Briggs R, Aihie Sayer A: Is grip strength a
useful single marker of frailty? Age & Ageing 2003, 32:650-656.
16. Boxer RS, Wang Z, Walsh SJ, Hager D, Kenny AM: The utility of the 6-
minute walk test as a measure of frailty in older adults with heart
failure. American Journal of Geriatric Cardiology 2008, 17:7-12.
17. Weiner DK, Duncan PW, Chandler J, Studenski SA: Functional reach: a
marker of physical frailty. Journal of the American Geriatric Society 1992,
40:203-207.
18. Leng S, Chaves P, Koenig K, Walston J: Serum interleukin-6 and
hemoglobin as physiological correlates in the geriatric syndrome of
frailty: a pilot study. Journal of the American Geriatric Society 2002,
50:1268-1271.
19. Bartali B, Frongillo EA, Bandinelli S, Lauretani F, Semba RD, Fried LP,
Ferrucci L: Low Nutrient Intake Is an Essential Component of Frailty in
Older Persons. Journal of Gerontology: Medical Sciences 2006, 61:589-593.
Kamaruzzaman et al. Health and Quality of Life Outcomes 2010, 8:123
/>Page 13 of 14
20. Mitnitski AB, Song X, Rockwood K: The estimation of relative fitness and
frailty in community-dwelling older adults using self-report data. Journal
of Gerontology: Medical Sciences 2004, 59:M627-M632.
21. Rockwood K, Minitski A, Song X, Steen N, Skoog I: Long-term Risks of
Death and Institutionalization of Elderly People in Relation to Deficit
Accumulation at Age 70. J AM Geriatr Soc 2006, 54:975-979.
22. Klein BEK, Klein R, Knudtson MD, Lee KE: Frailty, morbidity and survival.
Archives of Gerontology and Geriatrics 2005, 41:141-149.
23. Goggins WB, Woo J, Sham A, Ho SC: Frailty index as a measure of
biological age in a Chinese population. Journal of Gerontology: Medical
Sciences 2005, 60:1046-1051.
24. Darlington RB: Factor Analysis.[ />factor.htm], accessed August 2008.
25. Tabachnick BG, Fidell LS: Using multivariate statistics., Fifth 2007.
26. Walston J, Hadley EC, Ferrucci L, Guralnik JM, Newman AB, Studenski SA,
Ershler WB, Harris T, Fried LP: Research agenda for frailty in older adults:
toward a better understanding of physiology and etiology: summary
from the American Geriatrics Society/National Institute on Aging
Research Conference on Frailty in Older Adults. Journal of the American
Geriatrics Society 2006, 54:991-1001.
27. Rockwood K, Minitski A: Frailty in Relation to the Accumulation of
Deficits. Journal of Gerontology: MEDICAL SCIENCES 2007, 62A:722-727.
28. Lawlor DA, Patel R, Ebrahim S: Association between falls in elderly
women and chronic diseases and drug use: a cross sectional study.
British Medical Journal 2003, 327:1-6.
29. Strawbridge WJ, Shema SJ, Balfour JL, Higby HR, Kaplan GA: Antecedents
of frailty over three decades in an older cohort. Journal of Gerontology:
Social Sciences 1998, 53:S9-S16.
30. Fried LP, Ferrucci L, Darer J, Williamson JD, Anderson G: Untangling the
Concepts of Disability, Frailty, and Comorbidity: Implications for
Improved Targeting and Care. Journal of Gerontology: Medical Sciences
2004, 59:255-263.
31. Fletcher AE, Jones DA, Bulpitt CJ, Tulloch AJ: The MRC trial of assessment
and management of older people in the community: objectives, design
and interventions. BMC Health Services Research 2002, 2.
32. Jarman B: Underprivileged areas: validation and distribution of scores.
British Medical Journal (Clinical Research Edition) 1984, 289:1587-1592.
33. Kline RB: Principles and practice of structural equation modeling. New
York: Guilford Press; 1998.
34. Field A: Discovering Statistics using SPSS for Windows. London-Thousand
Oaks-New Delhi: Sage publications; 2000.
35. Hu L, Bentler PM: Cutoff criteria for fit indexes for covariance structure
analysis:conventional criteria versus new alternatives.
Structural Equation
Modeling 1999, 6:1-55.
36. Gu D, Dupre ME, Sautter J, Zhu H, Liu Y, Yi Z: Frailty and mortality among
Chinese at advanced ages. Journal of Gerontology: Social Sciences 2009,
64:279-289.
37. Woo J, Goggins W, Sham A, Ho SC: Social determinants of frailty.
Gerontology 2005, 51:402-408.
38. Kulminski A, Ukraintseva SV, Akushevich I, Arbeev KG, Land K, Yashin AI:
Accelerated accumulation of health deficits as a characteristic of aging.
Experimental Gerontology 2007, 42:963-970.
39. Andrew MK, Minitski AB, Rockwood K: Social vulnerability, frailty and
mortality in elderly people. PL oS ONE 2008, 3:e2232.
40. Lubke GH, Muthen B: Investigating Population Heterogeneity with Factor
Mixture Models. Psychological Methods 2005, 10:21-39.
41. Speechley M, Tinetti M: Falls and Injuries in Frail and Vigorous
Community Elderly Persons. Journal of the American Geriatrics Society 1991,
39:46-52.
42. Sarkisian CA, Gruenewald TL, John Boscardin W, Seeman TE: Preliminary
evidence for subdimensions of geriatric frailty: the MacArthur study of
successful aging. Journal of the American Geriatric Society 2008,
56:2292-2297.
43. Rockwood K, Mitnitski A, Song XW, Steen B, Skoog I: Long-term risks of
death and institutionalization of elderly people in relation to deficit
accumulation at age 70. Journal of the American Geriatrics Society 2006,
54:975-979.
44. Hubbard RE, Lang IA, Llewellyn DJ, Rockwood K: Frailty, Body Mass Index,
and Abdominal Obesity in Older People. J Gerontol A Biol Sci Med Sci
2010, 65(4):377-81.
doi:10.1186/1477-7525-8-123
Cite this article as: Kamaruzzaman et al.: A reliable measure of frailty for
a community dwelling older population. Health and Quality of Life
Outcomes 2010 8:123.
Submit your next manuscript to BioMed Central
and take full advantage of:
• Convenient online submission
• Thorough peer review
• No space constraints or color figure charges
• Immediate publication on acceptance
• Inclusion in PubMed, CAS, Scopus and Google Scholar
• Research which is freely available for redistribution
Submit your manuscript at
www.biomedcentral.com/submit
Kamaruzzaman et al. Health and Quality of Life Outcomes 2010, 8:123
/>Page 14 of 14