Báo cáo hóa học: " Gold colloidal nanoparticle electrodeposition on a silicon surface in a uniform electric field" pdf
Bạn đang xem bản rút gọn của tài liệu. Xem và tải ngay bản đầy đủ của tài liệu tại đây (447.7 KB, 8 trang )
NANO EXPRESS Open Access
Gold colloidal nanoparticle electrodeposition on a
silicon surface in a uniform electric field
D Buttard
1,2*
, F Oelher
1
and T David
1
Abstract
The electrodeposition of gold colloidal nanoparticles on a silicon wafer in a uniform electric field is investigated
using scanning electron microscopy and homemade electrochemical cells. Dense and uniform distributions of
particles are obtained with no ag gregation. The evolution of surface particle density is analyzed in relation to
several parameters: applied voltage, electric field, exchanged charge. Electrical, chemical, and
electrohydrodynamical parameters are taken into account in describing the electromigration proce ss.
1. Introduction
The emerging fields of nanoscience and nanoengineering
are helping us to better understand and control the funda-
mental building blocks in the physics of materials [1,2].
The manipulation of nano-objects is also essential and
requires expertise in several domains (mechanics, electro-
chemistry, optics ) [3-5]. The traditional top-down
approach is by far the most widespread within the micro-
electronics industry, but it relies on a complex lithography
technique that results in very high production costs. Alter-
native approaches are theref ore bei ng investiga ted with a
view to achieving a spontaneous self-assembly of nano-
components. Among these approaches, the so- called bot-
tom-up method is attracting increasing attention. Based
on this method, the self-organization of gold nanoparticles
on a planar surface is providing new solutions for electrical
or catalytic systems [6,7]. However, the deposition of parti-
cles on a substrat e [8,9] must confor m to several criteria
such as irreversibility of the deposition process [10], stabi-
lity, and high density. Deposition of gold coll oidal nano-
particles can be achieved with different methods. For
instance, the electrophoretic deposition method (EPD)
[11,12] uses a uniform external electric field to drive the
suspended particles from the solution toward the substrate
surface. The advantage of the EPD method is that it
requires no special surface passivation on the colloidal
particles and it can be controlled conveniently by the
applied field [13 ,14]. The deposition proce ss, however, is
complex [15] and many questions remain unanswered,
despite the extensive use of EPD.
In this article, we describe the uniform electric field-
assisted deposition of gold colloidal nanoparticles from an
aqueous solution onto a planar silicon surface. The
adsorption of nanoparticles onto silicon is described and
the surface density obtained is investi gated in function of
the usual experimental param eters: applied voltage, elec-
tric field, and initial nanoparticle density existing in the
solution.
2. Material and methods
Gold colloidal nanoparticles from the British Bio Cell
Company were deposited on standard p-type silicon
wafers, <111>-oriented, with a low electrical resistivity
( r <0.01Ωcm) to ensure a good ohmic contact in the
electroch emical cell. Prior to particle deposition, the sili-
con wafers were deoxidized using vapor hydrofluoric acid
(HF) at room temperature above a liquid HF solution with
49 vol.%. Thanks to this process, the silicon surface of the
wafer is free of the native silicon oxide that usually covers
a silicon surface. The colloidal solution is an aqueous-sta-
bilized dispersion of gold nanoparticles (particle purity
99.9%) with a controlled diameter D in the [ 20-100 nm]
range. The nominal value o f the diamet er is give n by
the supplier with 10% mono-dispersed. This was con-
firmed by electron microscopy measurements. Gold colloi-
dal nanoparticles are stabilized by citrate ions (PH = 6.5)
and exhibit a negative total charge. Gold colloidal solu-
tions were stored at low temperature (T = 5°C) to prevent
any unwanted aggr egation. Experiments were conducted
at room temperature only from fresh un-aggregated
* Correspondence:
1
CEA-Grenoble/INAC/SiNaPS-MINATEC 17 avenue des martyrs 38054
Grenoble, France
Full list of author information is available at the end of the article
Buttard et al. Nanoscale Research Letters 2011, 6:580
/>© 2011 Buttard et al; lice nsee Springer. This is an Open Access article distributed under the terms of the Creative Commons Attribution
License ( which permits unrestri cted use, distribution, and reproduction in any medium,
provided the origin al work is properly ci ted.
solutions. The electromigration process was performed
using a homemade electrochemical set-up with a Parstat
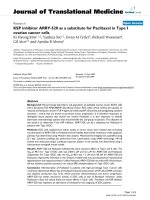
P-2273 potentiostat. Figure 1 illustrates the experimental
details [both the voltage (V) and electrode distance (d) are
free parameters]. Typical experiments consist in monitor-
ing the current (I)versustime(t)atafixedvoltage(V),
between the silicon surface (anode) and the platinum
counter-electrode (cathode) in the 0.1-40 V range. Colloi-
dal nanoparticle density on the substrate surface was eval-
uated afterward from scanning electron microscopy (SEM)
images obtained with a FEG-SEM Zeiss ultra 55 allowing
nanoscale resolution. Particle distribution statistics were
performed using the ImageJ software on contrast-
enhanced images. For one sample, the silicon substrate
was replaced by a platinum-coated silicon substrate. The
platinum material was deposited by sputtering (under a
pressure P =10
-7
mbar), resulting in a uniform 300 nm Pt
layer on the silicon substrate.
3. Results and discussion
Figure 2 presents SEM images of gold colloidal nanopar-
ticles (diameter D = 20 nm) el ectrodeposited on a silicon
surface under a constant voltage V =40Vforvarious
deposition times t. For short deposition times (Figure 2a,
b), the observed nanoparticle density is low. At longer
times (Figure 2c,d), the density increases and eventually
saturates. Images recorded for times longer than 10 min
are similar to those of Figure 2d. After deposition had
occurred, several techniques were tested to desorb the
nanoparticles, such as using a reversed electric field or
dipping the sample into a basic or acid bath. Following
such treatment, n o change in the surface density of the
deposited nanoparticles was observed. This chemical and
electrical stability indicates that the nanoparticles are
strongly fixed to the surface, with no observable lateral
mobility. As the silicon substrate corresponds to the
anode, the anodic oxidation of the silicon surface occurs
around the gold nanoparticles and probably leads to the
partial embedding of the particles in SiO
2
.Thismay
explain the strong adsorption of the particles at the sili-
con surface. Careful observation of Figure 2a-d reveals no
aggregation. Particles are uniformly distributed overall
the surface and are well separated from their nearest
neighbors.
This is corroborated by Figure 2e, showing a typical
two-dimensional self-correlation function g(r), calculated
from the SEM image a t t = 10 min. This radial distribu-
tion corresponds to the probability of finding a particle at
a center-to-center distance r from another particle [16].
This statistical result, based on an evaluation of all parti-
cles observed on the image, confirms the uniform distri-
bution of the nanoparticles. A profile from a g(r)cross
section (Figure 2f(1)) shows several o scillations, despite
the lack of periodic ordering. This cross section was nor-
malized by r
0
which corresponds to the average distance
between nearest neighbors. Here, we measure r
0
=46.9
nm (abscissa of first peak of g( r)) which indicates that th e
20 nm diameter nanoparticles are only separated by a
surface-to-surface distance of 26.9 nm on average. We
note that other peaks are clearly visible o n g(r). This is
evidence that, although there is no periodic distribution
in the observat ion plane, the nanoparticl es are uniformly
scattered over all the substrate with a measurable nearest
neighbor distance [17]. Self-correlation functions were
Voltage
V
Cat
h
o
d
e
Anode
+ + + + +
Si
Colloidal
sus
p
ension
Pt/Ir
Colloid
O-Rin
g
Sam
p
le
+
+
+
+
+
+
+
+
-
-
-
-
-
d
E
&
Figure 1 Schematic representation of the experimental setup with negatively charged nanoparticles in the liquid solution.
Buttard et al. Nanoscale Research Letters 2011, 6:580
/>Page 2 of 8
also computed for other SEM images (Figure 2a-c). An
example is shown in Figure 2f(2).
Figure 2g shows the corresponding r
0
for each deposi-
tion time. As expected, r
0
is long for short deposition
times (low density) and saturates around 40 nm at longer
deposition times. This value (at saturation) corresponds to
asurface-to-surfacedistancel · 20 nm between nearest
particles, which is close to the nominal particle diameter.
This distance corresponds to an electrical equilibrium
between charged particles. Gold colloidal nanoparticles are
embedded by citrate ions leading to a negative charge at
the surface of the colloids. This negative charge is
balanced by the adsorption of positive ions present in the
electrolyte. The electrical atmosphere around the particles
is therefore very complex [18,19] and there are a lot of
charge interactions between the particles. In the well-
known double layer model based on the Gouy-Chapmann
theory [20,21] and Stern’ s model [22], the particle is
embedded both by a compact layer, adsorbed at the sur-
face, and by a diffuse layer. Usually in an electrolyte, the
0
20
40
60
80
100
120
02468101
2
time
(
min
)
r
0
(nm)
1m 1m
1m 1m
t = 30 s t = 1 min 30s
t = 6 min t = 10 min
(a) (b)
(c) (d)
g(r) (a.u.)
(e)
(f)
(g)
0 1 2 3 4
r/r
0
(1)
(2)
Figure 2 In-plane distribution of the gold colloids. (a-d) SEM plane views of a <111>-oriented silicon substrate after electromigration of gold
nanoparticles with a diameter D = 20 nm for different deposition times t at a voltage V = 40V, (e) self-correlation function g(r) from (d) with r
0
=
46.9 nm, (f) cross section (1) from (e) and (2) from (c), (g) evolution of r
0
with deposition time.
Buttard et al. Nanoscale Research Letters 2011, 6:580
/>Page 3 of 8
Debye length l
D
is taken as the thickness of both the com-
pact and the diffuse layers. The Debye length is an impor-
tant factor in determining the stability o f gold colloid.
Under appropriate conditions, particles do not coale sce.
This stability is due to the repulse potential of the diffus e
Debye layer when two particles come close to each other.
This is greater than the attractive Van der Waals poten-
tial/force of the gold particle, which would lead to coales-
cence of the particles. In other words, the homogenous
lateral distribution of colloids is interpreted as the repul-
sion between two neighbors on account of the negative
shell from citrate ions.
To investigate the deposition process, similar experi-
ments were performed with the colloidal suspension of
particles with different diameters (D = 20, 50, 100 nm).
Figure 3a shows the corresponding density δ of nano-
particles, measured from SEM images, versus deposition
duration. The density evolves in a similar manner for
each nanoparticle diameter: a sharp rise at the early
stages of the deposition process and a saturation regime
at t = 10-15 min. The saturation density value (δ
lim
)
depends on nanoparticle diameter. In order to compare
the efficiency levels of each deposi tion process, the par-
ticle density δ was normalized by the number of nano-
particles initially present in the entire liquid volume in
the cell. As liquid volume and substrate area are always
the same (v =10mLandA =0.385cm
2
), the percen-
tage of deposited nanoparticles mainly depends on the
concentration of each colloidal suspension (C
20
=7×
10
11
,C
50
= 4.5 × 10
10
,C
100
= 5.6 × 10
9
mL
-1
). Figure 3b
1.E+07
1.E+08
1.E+09
1.E+10
1
.E+
11
0 5 10 15 20
Time (min)
Density (cm-²)
0.0
0.2
0.4
0.6
0.8
1.0
1.2
0 2040608010012
0
Diameter (nm)
Percentage of deposited
colloids (%)
(a)
(b)
Figure 3 Evolution of nanoparticle density δ on a <111>-oriented silicon surface under a constant voltage V =40V. (a) versus a
deposition time t for nanoparticle diameters D = 20 nm (full circles), D = 50 nm (full triangles), D = 100 nm (full squares), (b) percentage of
deposited nanoparticles relative to the initial colloidal nanoparticle concentration in the liquid, after 2 min (open circles), after 10-15 min (full
circles) of deposition, versus nanoparticle diameter.
Buttard et al. Nanoscale Research Letters 2011, 6:580
/>Page 4 of 8
shows the percentage of deposited nanoparticles in rela-
tion to the initial number of nanoparticles in t he liquid
solution for short (open circle) and long (full circles)
deposition times. In spite of the high nanoparticle den-
sity measured on the surface, we notice that only a few
tenths of 1% of the particles are actually deposited. This
value is not very surprising since Figu re 2d sho ws that
deposition saturates with a surface-to-surface distance
close to p article diameter. At saturation level, no more
particles are added to the surface, although the initial
nanoparticle number in the liquid solution is still very
high. (For example, a complete monolayer would corre-
spond to a tiny fraction of the available gold nanoparti-
cles in the liquid.) Therefore, the number of adsorbed
particles on the surface may just be limited by geometri-
cal distribution. Figure 3b also shows that the percentage
of deposited nanoparticles increases as the diameter
decreases. This phenomenon is more marked for longer
deposition times, up to and including the ‘saturation’
regime. As the differences in particle concentration in
the liquid have already been taken into account in the
percentage values, the variations in deposited nanoparti-
cle density are not solely explained by the different liquid
solutions used during the experiment. So the observed
dependence on diameter may be linked to the nature of
the nanoparticles. As particle diameter increases, some
deposition parameters such as particle mobility should
change. But with this hypothesis, mobility variations
would not affect the ‘ saturation’ regime, where both slow
and quick particles are able to reach the surface, which is
not observed in Figure 3b. Consequently, hypotheses
other than those involving mobility variations need to be
considered, such as Ph or conductivity changes betwe en
the colloidal solutions, or interaction between particles.
This last hypothesis is compatible with the geometrical
limitation observed in Figure 2, but an accurate descrip-
tion of the phenomenon would require further
experiments.
As long deposition time results did not affect the deposi-
tion process itself, we investigated nanoparticle deposition
with small voltages and short deposition times. Figure 4
shows measurements of particle density (diameter D =
100 nm) versus voltage for three different electrod e posi-
tions (d
1
=1,d
2
=7,d
3
= 33 mm) after 1-min deposition
time. For low voltages (V
i
< 1 V), density is very low (δ ≈
4.5 × 10
4
cm
-2
) and increases as the voltage increases. For
high voltages (V > 1 V), density is clearly higher with a
value of δ ≈ 10
7
cm
-2
. Each curve shows a sharp increase
in density (two order s of magnit ude) at a specific voltage
(V
1
, V
2,
V
3
). The dependence of this threshold voltage on
the electrode distance (d) is plotted in Figure 4b and exhi-
bits a linear evolution: V = 0.078d + 0.437. The offset V
0
=
0.437 V is linked to a residual voltage in the electrical cir-
cuit at d = 0. The slope of this curve corresponds to a
transition electric field (E
trans
= 77.8 V/m) which exists
between the two electrodes. Based on this observation,
Figure 5 plots nanoparticle density versus the electric field
E = V/d. As expected, the density is low (δ ≈ 4.5 × 10
4
cm
-
2
) for low electric field values (E < 10 V/m) and more than
two orders of magnitude higher (δ ≈ 1×10
7
cm
-2
)for
high E values (E > 100 V/m) . All the pr evio us data col -
lected from different experiments clearly indicate that the
sharp increase in density is controlled by a minimum elec-
tric field, E
trans
≈ 80 V/m. Additional experiments were
performed where the deoxidised Si<111> substrate was
replaced by an oxidised substrate. In this configuration, no
nanoparticle deposition was observed even at high electric
field values (E > 800 V/m). Similarly, a metallic conductive
Pt-coated Si substrate was used as the anode but it still did
not show any sign of nanoparticle deposition. These
experiments indicate that the electric field alone is not suf-
ficient for deposition of nanoparticles to take place on the
surface.
Based on this dependence on the electrode, the
change in current in relation to time was in vestigated
during the deposition time on deoxidised Si<111 >p-type
substrates.Figure6ashowsthecorrespondingI(t)
curves with a regular decrease for all electric fields. The
exchange of charges at the electrolyte/silicon interface
can be characterized by the integrated total charge Q
per surface unit exchanged during electro-deposition:
Q =
j(t ) d
t
(1)
where j is the current density and dt is the experimental
time increment between two experimental points (0.5 s).
Figure 6b shows the nanoparticle density versus the inte-
grated charge Q (normalized by the sample surface). We
observe a clear charge threshold above which den sity
increases by two orders of magnitude. For low Q values (Q
<1mC/cm
2
), the density is low (δ ≈ 4×10
4
cm
-2
),
whereas for high Q values (Q > 2 mC/cm
2
) the density is
high (δ ≈ 1×10
7
cm
-2
). Between these two regimes a clear
transition charge threshold is observed at Q ≈ 1.5 mC/
cm
2
. We explain this behavior by the anodic oxidation of
the silicon substrate, whereas the platinum is chemically
inert at these voltages.
In the light of our results, we therefore propose a basic
model to explain the electromigration of gold colloidal
nanoparticles. In the absence of an electric field, nanopar-
ticles are sub ject to colloidal forces, without any gravita-
tional force, and the small particles are suspended in the
solution. Particle transport is governed solely by Brow-
nian’s motion with random displacement. Under the influ-
ence of an electric field, particle motion occurs in a
direction determined by electrophoretic parameters: elec-
trostatic charge and solvent viscosity. The electrostatic
Buttard et al. Nanoscale Research Letters 2011, 6:580
/>Page 5 of 8
force F
E
= q
s
E [23], with q
s
the surface charge, can only
drive the negatively charged nanoparticles toward the
positive electrode if a sufficient electric field overcomes
the repulsive particle-particle interactions. Although our
measur ements (E
trans
≈ 0.8 V/cm) are in good agreement
with the literature (E
trans
≈ 1.3 V/cm) [11,24,25], F
E
is not
sufficient to explain nanopart icle transport under a uni-
form electric field since no deposition occurs on a Pt-
coated or oxidized silicon surface. Previous investigations
[14] showed that electroosmotic [26] and electrohydrody-
namic [27] t ransport processes can direct the motion of
small particles. In accordance with the literature [28], we
propose here that silicon anodic oxidation takes place on
the silicon anode for V > 1 V. The basic process of anodic
oxidation at the silicon/electrolyte interface in an aqueous
solution under a voltage V takes place as follows:
H
2
0 → 2H
+
+O
2
−
(2)
1.E+04
1.E+05
1.E+06
1.E+07
1.E+08
0.1 1 1
0
V (V)
Density (cm
-2
)
V
1
V
2
V
3
0
0.5
1
1.5
2
2.5
3
3.5
0 10203040
d
(
mm
)
V (V)
V
1
V
2
V
3
(a)
(b)
d
1
d
2
d
3
Figure 4 Evolution of gold nanoparticle density (diameter D = 100 nm) versus voltage V. (a) Evolution of gold nanoparticle density
(diameter D = 100 nm) versus voltage V after a deposition time t = 1 min for three values of distance d between sample and electrode: d
1
=1
mm (full squares), d
2
= 7 mm (Full circles), d
3
= 33 mm (full triangles); (b) Linear evolution of the threshold voltage, V = 0.078 d + 0.437,
corresponding to a transitional electric field E = 78 V/m.
1.E+04
1.E+05
1.E+06
1.E+07
1
.E+
08
1101001000100
0
E (V/m)
Density (cm
-
2
)
Figure 5 Gold nanoparticle density (diameter D = 100 nm) on
the silicon surface versus the uniform electric field E = V/d.A
sharp increase in density is observed for E
trans
≈ 80 V/m.
Buttard et al. Nanoscale Research Letters 2011, 6:580
/>Page 6 of 8
S
i →
S
i
4+
+4
e
−
(3)
which leads to the creation of silicon oxide:
S
i
4+
+2O
2−
→ SiO
2
(4)
At the same time, hydrogen is formed at the cathode:
2H
+
+2e
−
→ H
2
(5)
Under these conditions, a hydrodynamical flow of
charged ionic species is set up in the direction of the
positive elect rode and this help s drive the nanoparticles
toward the silicon surface. Consequently, both electrical
(E > 80 V/m) and electrochemical parameters (Q >1
mC/cm
2
) are essential to the electromigration of gold
colloidal nanoparticles onto the silicon surface.
4. Conclusions
In this study, we have investigated the electrodeposition
of gold colloidal nanoparticles on p-type-doped Si sur-
faces. Uniform distribution was obtained and adsorption
was irreversible. The density o f a gold nanoparticle
assembly was investigated and analyzed in relation to sev-
eral parameters such as voltage, the electric field, and the
charge exchanged. Deposition was found to be associated
with a minimum electric field (E
trans
≈ 80 V/m) combined
with an electrochemical process (Q >1mC/cm
2
)that
oxidises the surface of the Si anode.
1.E-06
1.E-05
1.E-04
1.E-03
1
.E-
02
0 102030405060
t (s)
I (A)
(1) E = 10000 V/m
(2) E = 714 V/m
(3) E = 91 V/m
(4) E = 14 V/m
1.E+04
1.E+05
1.E+06
1.E+07
1.E+08
0.0001 0.001 0.01 0.
1
Inte
g
rated char
g
e Q
(
C.cm
-2
)
Density (cm
-2
)
(1)(2)(3)
(4)
(a)
(b)
Figure 6 Electrodeposition of gold nanoparticles (D = 100 nm). (a) current monitoring versus deposition time for different electric fields, (b)
nanoparticle density versus the integrated charge Q exchanged between the electrolyte and the silicon surface. Points (1)-(4) match the
corresponding curves of panel (a). A sharp increase in density is observed for Q ≈ 1 mC/cm
2
.
Buttard et al. Nanoscale Research Letters 2011, 6:580
/>Page 7 of 8
Abbreviations
EPD: electrophoretic deposition; HF: hydrofluoric acid; SEM: scanning
electron microscopy.
Acknowledgements
We would like to thank E. André for help with platinum deposition and P.
Gentile for numerous fruitful discussions.
Author details
1
CEA-Grenoble/INAC/SiNaPS-MINATEC 17 avenue des martyrs 38054
Grenoble, France
2
Université Joseph Fourier/IUT-1 17 quai C. Bernard 38000
Grenoble, France
Authors’ contributions
DB designed the experiments, performed data analysis, drafted the
manuscript and supervised the whole study. FO and TD performed the
experiments and participate in the manuscript. All authors read and
approved the final manuscript.
Competing interests
The authors declare that they have no competing interests.
Received: 17 June 2011 Accepted: 4 November 2011
Published: 4 November 2011
References
1. Boal AK, Ilhan F, DeRouchey JE, Thurn-Albrecht T, Russell TP, Rotello VM:
Self-assembly of nanoparticles into structured spherical and network
aggregates. Nature 2000, 404:746-748.
2. Maoz R, Frydman E, Cohen SR, Sagiv J: Constructive nanolithography:
inert monolayers as patternable templates for in-situ nanofabrication of
metal-semiconductor-organic surface structures-a generic approach. Adv
Mater 2000, 12:725-731.
3. Kondo Y, Takayanagi K: Synthesis and characterization of helical multi-
shell gold nanowires. Science 2000, 289:606-608.
4. Zach MP, Ng KH, Penner RM: Molybdenum nanowires by
electrodeposition. Science 2000, 290:2120-2123.
5. Tang Z, Kotov NA, Giersig M: Spontaneous organization of single CdTe
nanoparticles into luminescent nanowires. Science 2002, 297:237-240.
6. Buttard D, David T, Gentile P, den Hertog M, Baron T, Ferret P, Rouvière JL:
A new architecture for self-organized silicon nanowire growth
integrated on a <100> silicon substrate. Phys Status Solid A 2008,
205:1606-1614.
7. Buttard D, David T, Gentile P, Dhalluin F, Baron T: High-density guided
growth of silicon nanowires in nanoporous alumina on Si(100) substrate:
estimation of activation energy. Phys Status Solidi RRL 2009, 3:19-21.
8. David T: Thesis University Joseph Fourier, Grenoble; 2008.
9. Dutta J, Hofmann H: In Encyclopedia of Nanoscience and Nanotechnology.
Volume X. California: American Scientific; 2003:1.
10. Turkevich J: Colloidal gold. Part II. Gold Bull 1985, 18:125-131.
11. Bailey RC, Stevenson KJ, Hupp JT: Assembly of micropatterned colloidal
gold thin films via microtransfer molding and electrophoretic
deposition. Adv Mater 2000, 12:1930-1934.
12. d’Orlyé F: Thesis University Pierre et Marie Curie, Paris; 2008.
13. Kooij ES, Brouwer EAM, Poelsema B: Electric field assisted nanocolloidal
gold deposition. J Electroanal Chem 2007, 611:208-216.
14. Choi WM, Park OO: The fabrication of micropatterns of a 2D colloidal
assembly by electrophoretic deposition. Nanotechnology 2006, 17:325-329.
15. Trau M, Saville DA, Aksay IA: Field-induced layering of colloidal crystals.
Science 1996, 272:706-709.
16. Kooij ES, Brouwer EAM, Wormeester H, Poelsema B: Ionic strength
mediated self-organization of gold nanocrystals: an AFM study. Langmuir
2002, 18
:7677-7682.
17. Hunter RJ: Foundations of Colloid Science. 2 edition. Oxford: Oxford
University Press; 2001.
18. Everett DH: Basic Principles of Colloids Science London: Royal Society of
Chemistry; 1988.
19. Lyklema J: In Fundamentals of Colloid and Interface Science. Volume II.
London: Academic Press; 1995.
20. Gouy MG: Sur la constitution de la charge électrique à la surface d’un
électrolyte. J Phys Raduim 1910, 9:457-468.
21. Chapman DL: A contribution to the theory of electrocapillarity. Philos
Mag 1913, 25:475-481.
22. Stern O: Zur theorie der elektrolytischen doppelschicht. Z Elektrochem
1924, 30:508-516.
23. Evans DF, Wennerstrom H: The Colloidal Domain. 2 edition. Weinheim:
Wiley-VCH; 1999.
24. Giersig M, Mulvaney P: Formation of ordered 2-dimensional gold colloid
lattices by electrophoretic deposition. J Phys Chem 1993, 97:6334-6336.
25. Giersig M, Mulvaney P: Preparation of ordered colloid monolayers by
electrophoretic deposition. Langmuir 1993, 9:3408-3413.
26. Trau M, Saville DA, Aksay IA: Assembly of colloidal crystals at electrode
interfaces. Langmuir 1997, 13:6375-6381.
27. Solomentsev Y, Böhmer M, Anderson JL: Particle clustering and pattern
formation during electrophoretic deposition: a hydrodynamic model.
Langmuir 1997, 13:6058-6068.
28. Bardwell JA, Draper N, Schmuki P: Growth and characterization of anodic
oxides on Si(100) formed in 0.1 M hydrochloric acid. J Appl Phys 1996,
79:8761-8769.
doi:10.1186/1556-276X-6-580
Cite this article as: Buttard et al.: Gold colloidal nanoparticle
electrodeposition on a silicon surface in a uniform electric field.
Nanoscale Research Letters 2011 6:580.
Submit your manuscript to a
journal and benefi t from:
7 Convenient online submission
7 Rigorous peer review
7 Immediate publication on acceptance
7 Open access: articles freely available online
7 High visibility within the fi eld
7 Retaining the copyright to your article
Submit your next manuscript at 7 springeropen.com
Buttard et al. Nanoscale Research Letters 2011, 6:580
/>Page 8 of 8