báo cáo hóa học:" Caveolin-1 enhances resveratrol-mediated cytotoxicity and transport in a hepatocellular carcinoma model" docx
Bạn đang xem bản rút gọn của tài liệu. Xem và tải ngay bản đầy đủ của tài liệu tại đây (4.08 MB, 13 trang )
BioMed Central
Page 1 of 13
(page number not for citation purposes)
Journal of Translational Medicine
Open Access
Research
Caveolin-1 enhances resveratrol-mediated cytotoxicity and
transport in a hepatocellular carcinoma model
Hui-ling Yang*
1,3
, Wei-qiong Chen
1,3
, Xuan Cao
3
, Andrea Worschech
2,5,6
, Li-
fen Du
3
, Wei-yi Fang
4
, Yang-yan Xu
3
, David F Stroncek
7
, Xin Li
4
, Ena Wang
2
and Francesco M Marincola*
2
Address:
1
Institute of Clinical Medicine, First Affiliated Hospital of University of South China, Hengyang, 421001, PR China,
2
Infectious Disease
and Immunogenetics Section (IDIS), Department of Transfusion Medicine and Center for Human Immunology (CHI), National Institute of
Health,10 Center Drive, Building 10, Bethesda, MD 20892, USA,
3
Institutes of Pharmacology and Pharmacy, University of South China,
Hengyang, 421001, PR China,
4
Cancer Research Institute of Southern Medical University, Guangzhou 510515, PR China,
5
Genelux Corporation,
San Diego Science Center, San Diego, California, USA,
6
Institute for Biochemistry, University of Würzburg, Am Hubland, Würzburg, Germany and
7
Cellular Processing Section, Department of Transfusion Medicine, National Institutes of Health, Bethesda, Maryland, USA
Email: Hui-ling Yang* - ; Wei-qiong Chen - ; Xuan Cao - ;
Andrea Worschech - ; Li-fen Du - ; Wei-yi Fang - ; Yang-
yan Xu - ; David F Stroncek - ; Xin Li - ;
Ena Wang - ; Francesco M Marincola* -
* Corresponding authors
Abstract
Background: Resveratrol (RES), an estrogen analog, is considered as a potential cancer chemo-
preventive agent. However, it remains unclear how RES is transported into cells. In this study, we
observed that Caveolin-1(CAV1) expression can increase the cytotoxic and pro-apoptotic activity
of RES in a dose- and time-dependent manner both in vitro and in vivo in a Hepatocellular Carcinoma
animal model.
Methods: High performance liquid chromatography (HPLC) demonstrated that RES intra-cellular
concentration is increased about 2-fold in cells stably expressing CAV1 or CAVM1 (a scaffolding
domain (81-101AA)-defective CAV1 mutant) compared to the untransduced human
Hepatoblastoma cell line (HepG2) or after transduction with the green fluorescent protein (GFP)
control vector. The increased intra-cellular transport of RES was abolished in cells stably
expressing CAVM2 (a cholesterol shuttle domain (143-156AA)-defective CAV1 mutant) or
CAVRNAi. In order to further characterize CAV1-dependent RES transport, we synthesized RES-
dansyl chloride derivatives as fluorescent probes to visualize the transport process, which
demonstrated a distribution consistent with that of CAV1 in HepG2 cells.
Results: In addition, RES endocytosis was not mediated by estrogen receptor (ER) α and β, as
suggested by lack of competitive inhibition by estrogen or Tamoxifen. Pathway analysis showed that
RES can up-regulate the expression of endogenous CAV1; this activates further the MAPK pathway
and caspase-3 expression.
Discussion: This study provides novel insights about the role played by CAV1 in modulating
cellular sensitivity to RES through enhancement of its internalization and trafficking.
Published: 25 March 2009
Journal of Translational Medicine 2009, 7:22 doi:10.1186/1479-5876-7-22
Received: 24 February 2009
Accepted: 25 March 2009
This article is available from: />© 2009 Yang et al; licensee BioMed Central Ltd.
This is an Open Access article distributed under the terms of the Creative Commons Attribution License ( />),
which permits unrestricted use, distribution, and reproduction in any medium, provided the original work is properly cited.
Journal of Translational Medicine 2009, 7:22 />Page 2 of 13
(page number not for citation purposes)
Background
Resveratrol (trans-3,4',5-trihydroxystilbene, RES), a phy-
toalexin found in grapes and other food products, is con-
sidered as a cardio-protective drug and a potential cancer
chemo-preventive agent [1-6]. Through inhibitory effects
on the oxidative modification of low density lipoproteins,
RES can block internalization of oxidized lipoproteins
responsible for its cardio-protective quality. In addition,
RES can inhibit the growth of a variety of tumor cells in
vitro and in animal models [7-9] through its anti-cancer
properties including prevention, delay, and reversal of
tumor initiation, promotion and progression. This is
partly attributable to RES antioxidant activity and inhibi-
tory effect on the hydroperoxidase activity of cyclooxyge-
nase (Cox 1 and 2); furthermore, RES can inhibit
transcription factors such as NF-kB, apoptotic protease
activating factors (Apaf-1), and AHR, growth of estrogen
responsive cells and induce accumulation of p53 [10-14].
Some studies indicated that RES has a molecular structure
similar to diethylstilbesterol displaying estrogen-like ago-
nistic and antagonistic activity. Therefore, RES could bind
to the estrogen receptor (ER) and thereby activate the tran-
scription of estrogen-responsive reporter genes [15-17].
However, most of the in vivo studies have failed to confirm
the estrogen-like potential of RES.
Caveolins are plasma membrane rafts present in most
cells, and were first characterized morphologically as
small flask-shaped plasma membrane invaginations [18].
The typical caveolin-1 (CAV1) protein is a principal com-
ponent of the caveolin family and its reduced or absent
expression was shown in most human cancer cells. Several
lines of evidence support CAV1 function as a "transforma-
tion suppressor" protein. Over expression of CAV1 blocks
anchorage-independent growth of transformed cells. A
varied array of functions has been proposed for caveolins,
including modulation of signal transduction, endocyto-
sis, potocytosis, and cholesterol trafficking. CAV1 can sup-
press epidermal growth factor tyrosine kinase (EGF),
extra-cellular signal-regulated kinase (ERK), endothelial
nitric-oxide synthase, threonine protein kinase, serine
protein kinase such as Src family TK, PKCα, H-Ras via the
CAV1 scaffolding domain that combines with these genes
[19-24]. In addition, some reports suggest that CAV1
mediates mitogen-activated protein kinase (MAPK)-
dependent CREB phosphorylation activating ERα and
ERβ through its scaffolding domain similarly to ERα and
ERβ activation by RES [15-17,25]. However, the CAV1-
dependent mechanism(s) by which RES may trigger cell
signaling remains to be determined.
This study analyzes whether and how CAV1 is involved in
the cytotoxic and pro-apoptotic actions of RES in a human
hepatocellular carcinoma (HCC) model. Lentiviral vec-
tors expressing short hairpin RNAs (shRNAs) against the
CAV1 gene [26] such as wild type (Wt CAV1), a scaffold-
ing domain (81-101AA)-defective CAV1 mutant
(CAVM1) and a cholesterol shuttle domain (143-156AA)-
defective CAV1 mutant (CAVM2) were constructed and
transfected into the human Hepatoblastoma cells HepG2;
these cells display constitutively low levels of endogenous
CAV1 [27,28]. The effects of WtCAV1, CAVM1 and
CAVM2 expression on cell growth, apoptosis, and Topoi-
somerase-α -Topo II/P38 transcription in response to var-
ious doses (0~300 μm) of RES were analyzed in vivo and
in vitro. Furthermore, the contribution of CAV1 to the
influx and efflux of cellular RES was investigated by high
performance liquid chromatography (HPLC) and its
intracellular distribution by RES derivatives (RES-dansyl
chloride) as fluorescent probes.
Materials and methods
Materials
Plasmid extraction kit (Promega, Madison, USA), and
BCA protein quantitative kit (Pierce, Rockford, USA) were
purchased. BlueRanger pre-dye protein molecule standard
and protein fluorescence detection kit were from HyClone
(South Logan, USA). Rabbit anti-human CAV-1(N-20),
extra-cellular signal-related kinase1/2 (ERK1/2, K-23) and
p38 kinase(H-147) polyclonal antibodies; mouse anti-
human caspase-3(E-8), mouse anti-Topoisomerase-alpa
(Ki-S1), mouse anti-human β-actin monoclonal antibody
and phosphorylated proteins of ERK1/2(p- ERK1/2(E-4));
Cy3-conjugated goat anti-mouse IgG, goat anti-rabbit
immunoglobulin G (IgG) and goat anti-mouse IgG anti-
bodies coupled to horseradish peroxidase were all from
Santa Cruz Biotechnology (Santa Cruz, USA). Alexa Fluor
488 -conjugated goat anti-rabbit IgG (H+L) antibody,
Lipofectamine 2000 reagent, geneticin (G418) and blasti-
cidin were purchased from Invitrogen (Carlsbad, USA);
Cell medium and antibiotics were from Gibco-BRL (Pais-
ley, Scotland, United Kingdom). Fetal bovine serum (FBS)
was from HyClone (Logan, UT). Dansyl Chloride was pur-
chased from Amresco. Resveratrol(trans-3,4',5-trihy-
droxystilbene, RES), special P38 mitogen-activated
protein kinases inhibitor (SB203580), trans-Ferulic
acid(trans-4-Hydroxy-3-methoxycinnamic acid, t-FA),
Diethylstilbestrol(DES), Tamoxifen citrate and all other
reagents used for immunofluorescence and Western blots
were from Sigma and of the highest grade available.
Plasmids
The mammalian GFP Fusion expression vector for human
wild-type CAV1 was constructed by inserting the human
CAV1 cDNA into pcDNA3.1/NT-GFP-TOPO [27]. Mutant
CAV1 with the deletion of the scaffolding domain
(CAVM1, CAV1-81-101aa) and mutant CAVM2 (lacking
the lipid domain 143-156aa, CAVM2, CAV1-143-156)
were generated by PCR mutagenesis using pcDNA3.1/NT-
GFP-TOPO-CAV1 as a template and the GFP reporter vec-
tor as previously described. We used lentiviral expressed
short hairpin RNAs (shRNAs) against CAV1.
Journal of Translational Medicine 2009, 7:22 />Page 3 of 13
(page number not for citation purposes)
Cell culture
The human Hepatoblastoma carcinoma-2 HepG2 cell line
was obtained from the Cell Bank, Chinese Academy of
Sciences Shanghai Institute of Cell Biology, and cultured
in Dulbecco's modified Eagle's medium supplemented
with 10% fetal bovine serum (HyClone), 100 μg/ml pen-
icillin and streptomycin, 4 mM/L glutamine, 1 mM MEM
sodium pyruvate in a humidified 37°C incubator with 5%
CO
2
. One day prior to the transfection, cells were plated
into a 10 cm tissue culture plate and grown to 90%–95%
confluence. The day after, 9 μg of plasmids (CAV1,
CAVM1, CAVM2 and GFP reporter vector respectively)
were transfected into the HepG2 cells using 10 μl of Lipo-
fectamine 2000 reagent, according to the manufacturer's
instructions. Forty-eight hours after transfection,
Geneticin (500 μg/ml) was used to select stable transfect-
ants. In addition, to obtain stable knockdown effect, the
lentiviral supernatant expressed short hairpin RNAs (shR-
NAs) against the CAV1 gene was added into HepG2 cells,
and 5 μg/ml blasticidin was used to select stable transfect-
ants 48 h post-transduction. The medium was changed
every 3 to 4 days until Geneticin or blasticidin-resistant
colonies appeared. Single colonies were picked and grown
in selection medium in 24-well-plates.
Cell viability assay
Cell viability was measured by MTT (3-(4,5-dimethylthia-
zol-2-yl)-2,5-diphenyl tetrazolium bromide) assay by solu-
bilization the formazan with DMSO (dimethyl sulfoxide).
Stable transfections of HepG2-CAV1, HepG2-CAV M1,
HepG2-CAV M2, HepG2-GFP, HepG2-shRNACAV1 and
vehicle control were seeded in 96-well plates at a density of
4000 cells/well. After overnight culture, the cell were
treated with different final concentrations of RES (0, 10, 20,
30, 50, 100, 150, 200, 300 μmol/l). Control cultures con-
taining absolute DMSO (0.1–0.3% dimethyl sulfoxide)
were also established. Different RES concentrations were
prepared freshly at each use by dissolving RES powder in
absolute DMSO followed by serial dilutions in medium.
Experiments were done in triplicates. Cell viability was
measured by MTT assay at 24, 48 and 72 h culture time. The
quantity of formazan product was measured by spectro-
photometric microtiter plate reader (Dynatech Laborato-
ries, Alexandria, VA) at 570 nm wavelength. Results were
expressed as a percentage of growth, with 100% represent-
ing control cells treated with DMSO alone.
Apoptosis and cell cycle distribution analysis
Cells were plated in 10-cm culture dishes and grown to
60–70% confluence within 24 hr. After overnight culture
and cell adherence to the bottom, the culture medium was
replaced by FBS-free DMEM. After 12 h, DMSO (0.1–
0.3%) or RES (0–300 μmol/l) was added. Both adherent
and floating cells were harvested 24 h, 48 h and 72 h after
treatment. Subsequently, cells were fixed with 70% etha-
nol in ice-cold PBS and stained with propidium iodide
(final concentration of 50 mg/L) in the dark for 30 min at
room temperature. Finally, cells were subjected to apopto-
sis and cell cycle analysis by flow cytometry using a FACS
Calibur. All experiments were performed in duplicate.
RES treatment of the HepG2 xenografts in nude mice
The mice in this study were supplied by the Vital River
Laboratory Animal Technology Co. Ltd. (SCXK (Beijing),
2007-0001), which is certified by the Charles River Labo-
ratories (CRL, USA). All mice were cared for and main-
tained in accordance with animal welfare regulations
under an approved protocol by the Beijing Bureau of Sci-
ence Animal. 40 Balb/c-nu female nude mice weighing
17–20 g were randomly assigned to 5 groups. Xenografts
were established by injecting 5 × 10
6
HepG2 cells with dif-
ferent stable transfectants (none, He-CAV1, He-CAVM1,
He-CAVM2, He-GFP and He-CAVRNAi) in 200 μl PBS
into the back of each mouse. Ten days after inoculation,
mice were divided into a control group and a RES treat-
ment group (each group including four mice; two CAVR-
NAi-transfected mice and one HepG2-transfected mouse
died before RES administration). RES (15 mg/kg body)
was administered intra-peritoneal once every other day
for 21 consecutive days. Untreated HepG2-implanted
mice were given sterilized water following the same sched-
ule. Tumor volume was determined every 2–3 days by
direct measurement with calipers and calculated using the
formula, [width
2
(mm
2
) × length (mm)]/2. After scarifica-
tion on day 30 tumor specimens and livers of each animal
were removed, weighed and the RES content in both tis-
sues was determined using HPLC analysis.
Resveratrol analysis by HPLC
Cells were harvested in ice-cold PBS (1 mL per 50 cm
2
flask) and pelleted at 1500 × g for 5 minutes after washing
them twice in ice-cold PBS. Cells were re-suspended in 50
μl NP-40 Cell Lysis Buffer (50 Mm Tris-HCl, 150 mM
NaCl, 1% Nonide P-40, pH7.8) and homogenized by son-
ication for 10 seconds on ice. The protein concentration
of cell lysates was determined by a bicinchoninic acid
(BCA) kit analysis. An equal volume of 5.6 μg/ml inner
standard solution was added (trans-Ferulic acid dissolved
in methanol). The mixture was vortexed for 5 min, fol-
lowed by centrifugation at 12,000 × g (4°C for 15 min).
Twenty μl samples were injected into the HPLC device
(Agilent 1100 series), separated on columns (Hypersil
C18), eluted by mobile phase consisting of metha-
nol:water: phosphate acid = 45:55:0.1 (v:v), at a flow rate
of 0.8 mL/min, room temperature, and detected by Diode
Array Detector at 320 nm. To test whether the molecular
structure of RES is similar to diethylstilbestrol (DES), 10
-
6
~10
-4
M/L DES plus RES were set to compete for ER acti-
vation. Furthermore, 10
-5
M/L Tamoxifen was added 4 h
before RES administration.
Journal of Translational Medicine 2009, 7:22 />Page 4 of 13
(page number not for citation purposes)
Synthesis of RES derivative fluorescent probes
RES derivatives were synthesized with the modification of
dimethylaminonaphthalene sulfonyl chloride (dansyl
chloride, DAN). After laser excitation of RES-DAN at
403.8 nm the emitted fluorescence of the RES derivates
could be was measured at 530 nm and was assessed to
compare the intra-cellular distribution of RES with that of
CAV1. A solution of 228 mg (1.0 mmol) of RES in 10 mL
of acetone was added into a mixture of 1 g of K
2
CO
3
and
10 ml acetone in N
2
atmosphere, 270 mg (1.0 mmol) of
DAN in 10 mL of acetone added in sequential drops while
cooling with an ice/water bath. The reaction mixture was
stirred for 20 min at room temperature and heated to
reflux for 2 h. The organic solution was filtered, dried by
evaporation and allowed to crystallize in acetone to result
in a yellow powder. Cells were then exposed to RES-DAN
(300 μmol/L) for 2 h, after washing them twice with ice-
cold PBS. The intra-cellular distribution of recombinant
CAV1 was detected by incubation with mouse anti-GFP
monoclonal antibody (1:200) and Cy3-conjugated goat
anti-mouse antibody (1:500) for 45 min. After three addi-
tional washings, the co-localization of RES and CAV1
were observed and photographed using a Zeiss 510 laser
confocal microscope [29].
Confocal immunofluorescence imaging and
immunohistochemistry
After incubation with or without 200 μmol/l RES for 24 h,
cells were fixed with methanol/glacial acetic acid solution
(3:1) for 15 min, permeabilized with 0.25% Triton+5%
DMSO at 37°C for 20 min, blocked with TBST containing
5% defatted milk powder at 37°C for 2 h, incubated with
rabbit anti-human CAV1 antibody and mouse anti-Topoi-
somerase-alpha (Ki-S1) (1:150) and blocked at 4°C over-
night. Cells were then washed three times with TBST
before and after incubation together with Alexa Fluor 488-
conjugated goat anti-rabbit IgG (H+L) antibody and Cy3-
conjugated goat anti-mouse antibody (1:500) for 45 min.
The results were observed and photographed using a Zeiss
510 laser confocal microscope. The paraffin-embedded
tumor samples were cut in-5 μm-thick sections with a
microtome. After de-paraffinization, rehydration and
antigen recovery, tissue sections were examined for
expression of CAV1 and Topoisomerase-alpha proteins by
CAV1 and Topoisomerase-alpha antibody. Primary anti-
body staining was followed by incubation with anti-
mouse or anti-rabbit secondary IgG polymer conjugated
with HRP or Alkaline phosphatase and signals were veri-
fied using Double Polymer Staining Detection System
(ZSGB-BIO, China).
Immunoblotting
Immunoblotting of phosphorylated ERK1/2, p38 kinase,
and caspase-3 was carried out using phospho-specific
MAP kinase antibodies against phosphorylated sites of
ERK1/2, p38 kinase, or active caspase-3, respectively. As
control, total ERK1/2, p38 kinase, and caspase-3 were
analyzed with the respective specific antibodies following
manufacturer's instructions (Santa Cruz Biotechnology).
In brief, HepG2 cells or HepG2 Cells with different trans-
fectants were starved for 24 h in 0.1% FBS DMEM at 37°C,
in a 5% CO2 atmosphere incubator. Cells were then
treated with RES (10–200 μmol/l) or DMSO (0.1%) for
24 h. In addition, another group of HepG2 cells treated
with 20 μm SB202190 for 1 h followed by treatment with
200 μM RES were cultured for an additional 24 h. Cells
were then washed once with ice-cold PBS and lysed in 200
μl lysis buffer (50 Mm Tris-HCl, 150 mM NaCl, 1% Non-
ide P-40, Ph 7.8) and protease inhibitor. After sonication
and centrifugation (10,000 g for 15 min,) equal lysates
(20 μg) were tested for levels of CAV1, phosphorylated
ERKs, p38 kinase and caspase-3 levels by Western immu-
noblotting using specific antibodies and chemi-lumines-
cence detection as previously described [30].
Statistical analysis
All experiments were repeated three times. Data are pre-
sented as the mean ± SD. Statistical significance was eval-
uated by an ANOVA and a Bonferroni adjustment applied
to the results of a t-test performed with SPSS software. Dif-
ferences between groups were analyzed by a Student's t-
test. P < 0.05 was considered statistically significant.
Results
Dose-and time-dependent cell death induced by RES in
human hepatoblastoma carcinoma HepG2 cells
To determine whether CAV1 is involved in the cytotoxic
and pro-apoptotic activity of RES, HepG2 cells were
treated with different doses of RES (0, 10, 30, 50, 100, 200
and 300 μmol/L). MTT and flow cytometry were used to
detect inhibitory effects of RES on the growth of serum-
stimulated HepG2 cells. As shown in Table 1 and 2 and
Figure 1A and Figure 1B, the MTT assay indicates that RES
inhibits significantly the growth of serum-stimulated
HepG2 cells in a concentration-dependent manner. Cell
cycle distribution indicated that high concentrations of
RES induced a marked increase in cell number in sub-G1
and G0/G1 phase, with a corresponding decrease in other
phases. Interestingly, concentrations of RES between 10
and 100 μM induced a modest but reproducible increase
in cells at S phase. Increased apoptosis ratios were
observed at increasing RES concentrations (Tables 3 and 4
and Figure 1). HepG2 cells were also treated with 200
μmol/L RES for 24, 48 and 72 h; cell growth inhibition
increased in time in the control HepG2 cell lines from
55.45 ± 1.4, 68.91 ± 1.8, 78.83 ± 3.9 compared to baseline
levels after 24, 48 and 72 h respectively. Significant
increase of growth inhibition ratio was observed in
HepG2 cells over-expressing CAV1 (68.32 ± 2.0, 80.12 ±
1.7, 90.02 ± 4.0, Table 2) and a significant reduction was
Journal of Translational Medicine 2009, 7:22 />Page 5 of 13
(page number not for citation purposes)
observed in HepG2 cells in which CAV1 activity was
inhibited (CAVRNAi). CAV1 and CAVM2 over-expressing
HepG2 cells induced spontaneous apoptosis and
increased the cytotoxic and pro-apoptotic effects of RES.
CAV1 or CAVM2 promote apoptotic cell death by induc-
ing plasma membrane crimple, small volume changes,
increased density and changes in nuclear morphology
(Figure 1C). A statistically significant difference (p < 0.05)
was observed in apoptotic index at 50, 100, 200 and 300
μmol/L RES concentrations (10.93 ± 1.5, 31.2 ± 2.1, 63.2
± 0.8, 80.6 ± 1.9) in CAV1 over-expressing cells (17.91 ±
2.5, 78.7 ± 1.7, 93.6 ± 2.0, 97.1 ± 1.7, Table 3). In contrast,
apoptotic cells were significantly reduced in HepG2 cells
expressing scaffolding domain deleted (CAV1
Δ
81–101)
mutant. Down-regulation of CAV1 expression by shRNA
correlated with decreased RES-induced growth inhibition
(Table 3). These results suggest that RES can induce a
dose- and time-dependent death of HepG2 cells, and
over-expression of CAV1 can increase the cytotoxic and
pro-apoptotic activity of RES even more.
Synergistic anti-tumor activity of RES and CAV1 in nude
mice
The above results indicate that CAV1 is a potentiator of
the effects of RES on HepG2 cells in vitro. We next evalu-
ated the activity of CAV1 mutants on the growth of
HepG2 cells in nude mice subjected or not to RES treat-
ment. HepG2 cells expressing the different CAV1 mutants
(5 × 10
6
cells/animal) were implanted subcutaneously in
the animals back. Within 30 days of implantation, GFP
control vector HepG2 cells had an average tumor size of
400 ± 15 mm
3
. In contrast, xenografts from cells stably
expressing CAV1 or CAVM2 were significantly smaller
with an average tumor size of 325 ± 10 mm
3
and 340 ±
13.4 mm
3
(Figure 2 and Table 5). On the other hand the
over-expression of mutant CAVM1 protein with deletion
of the scaffolding domain 80-101aa promoted prolifera-
tion and malignant transformation compared to the
parental cell lines and GFP vector-only transfectants (586
± 21 mm
3
). RES (15 mg/kg body) administered intra-peri-
toneal every other day for 21 consecutive days starting at
day 10 after tumor cell inoculation induced significant
inhibition of tumor growth in all HepG2 cells whether
wild type or expressing one of the various mutant con-
structs (Table 5). However, regression was more domi-
nant in xenografts of HepG2 cells stably expressing CAV1.
Furthermore, RES could reverse CAVM1 or CAVRNAi pro-
liferative effects.
HPLC analysis of RES-treated cells
After incubation with RES (50, 100, 150, 200, 250, 300
μM) for 2 h, 10 h, 24 h and 48 h, HepG2 cell plasma
extracts were analyzed by HPLC. Intra-cellular RES con-
centration was increased in a dose- and time-dependent
manner, but lower than the RES concentration in the
supernatant (Data not shown). We therefore addressed
whether CAV1 can induce endocytosis specifically and
indeed intra-cellular RES concentration was increased
about 2-fold in HepG2 cells stably expressing CAV1 or
CAVM1 compared to HepG2 wild-type or GFP-trans-
duced. Conversely, increased intra-cellular transport dis-
appeared in cells stably expressing CAVM2 and CAVRNAi
(Figure 3). To test whether the potential similar molecular
structure of RES compared with DES may also display
estrogen-like agonistic and antagonistic activity, we mixed
Table 1: Cell growth inhibition of HepG2 cells by 24 h treatment with 0.1–0.3% DMSO, RES or 5-FU
Cell growth inhibition ratio (%)
Cell groups Res (μM) 5-FU (μM)
DMSO 10 20 30 50 100 200 300 100
HepG2 0.046 11.88 17.49 22.03 30.50 45.95 51.45 65.93 50.86
CAV1 0.035 19.72 24.08* 37.13* 45.54* 57.54* 68.32* 87.89* 64.66*
CAVM1 15.97 22.63 25.03 33.82 45.98 55.78 72.34 48.48 0.047
CAVM2 13.91 19.39 26.44 34.77 47.55 57.27 76.56 42.46 0.029
RNAi 0.023 8.15 12.94 16.07* 24.34* 33.52* 41.23* 55.37* 32.83*
GFP 0.034 10.32 18.07 22.34 30.84 45.37 54.04 67.12 53.23
CAV1 0.035 19.72 24.08* 37.13* 45.54* 57.54* 68.32* 87.89* 64.66*
*P < 0.05 vs control, [ ± SD, SD = 0.8~2.5), n = 3]
RNAi = CAVRNAi
x
Table 2: Cell growth inhibition of HepG2 cells by 24, 48 and 72 h
treatment with 200 μM RES
Cell growth inhibition ratios (%)
Cell groups time
24 h 48 h 72 h
HepG2 55.45 ± 1.4 68.91 ± 1.8 78.83 ± 3.9
DMSO 1.00 ± 0.9 1.53 ± 1.6 1.72 ± 0.7
CAV1 68.32 ± 2.0* 80.12 ± 1.7* 90.02 ± 4.0*
CAVM1 55.78 ± 1.0 74.83 ± 2.8 82.46 ± 1.6
CAVM2 57.27 ± 1.2 76.79 ± 1.6 84.35 ± 2.6
CAVRNAi 41.23 ± 1.5* 55.39 ± 1.2* 68.27 ± 1.9*
GFP 54.04 ± 1.6 70.06 ± 1.1 76.27 ± 1.7
*P < 0.05 vs control, ( ± SD, n = 3)
x
Journal of Translational Medicine 2009, 7:22 />Page 6 of 13
(page number not for citation purposes)
10
-6
~10
-4
M/L DES plus RES in a competitive assay. Intra-
cellular RES concentration was not significantly different
between the two conditions. Thus, RES concentration was
increased two-fold in CAV1, CAVM1 HepG2 cells com-
pared to HepG2 wild-type or GFP-transfectants independ-
ent of DES treatment (Figure 3D, E and Figure 3F).
Furthermore, the estrogen receptor (ER) was blocked by
10
-5
M/L Tamoxifen citrate without altering the results
(data not shown) suggesting that CAV1 induces endocyto-
sis specifically and independent of ER activation. Further-
more, this data suggest that the 143–156 amino acids of
the lipid-binding domain of CAV1 play a key role. On the
contrary, the 81–101 amino acids scaffold-domain of
CAV1 is irrelevant to CAV1-mediated internalization and
trafficking of RES.
Co-localization of RES and CAV1
To gather additional supporting evidence that RES may be
transported into cells by CAV1 via its cholesterol shuttle
domain, the co-localization of RES and CAV1 was investi-
gated in HepG2 cells. Dansyl chloride-derived RES stained
with green fluorescence (Figure 4A section A) and recom-
binant CAV1 staining with red fluorescence (Figure 4A
section B) co-localized in the CAV1-expressing HepG2
(Figure 4A section C). We then analyzed the distribution
of RES and CAVM2 (a cholesterol binding domain-defec-
tive CAV1 mutant) in pooled HepG2 cells and the over-
expressing CAVM2 cells which displayed similar distribu-
tion of RES (Figure 4A section D). However, the over-
expressing CAVM2 cells could be distinguished from non
transfected HepG2 cells because of the red fluorescence
(Figure 4A section E). In these cells, the labeling occurred
mainly close to the membrane of the HepG2 cell and to a
lesser extent in the cytoplasm where only a weak co-local-
ization with RES could be observed (Figure 4A section F).
These data strongly suggest that RES is transported into
cells by CAV1.
Confocal immunofluorescence and immunohistochemistry
CAV1 and topoisomerase-alpha protein expression in tis-
sue and cells was studied by Immunofluorescence and
Immunohistochemistry. As shown in Figure 4B and Fig-
ure 4C CAV1 and topoisomerase-alpha proteins were
minimally expressed by HepG2 cells and respective
xenografts not treated with RES. CAV1 was predominantly
located around the cell membrane while topoisomerase-
alpha was found in the nuclei. RES pre-treatment (100
μM) promoted the expression of CAV1 or topoisomerase-
alpha while topoisomerase-alpha expression was inhib-
ited completely in CAVRNAi cells. However, 100 μM RES
pre-treatment recovered topoisomerase-alpha expression
in CAVRNAi cells.
Table 3: Apoptosis induction in HepG2 cell variants by 48 h treatment with DMSO or 20–300 μM RES
Percent Apoptosis (%)
Cell groups Res (μM)
DMSO 20 50 100 200 300
HepG2 1.53 ± 1.6 6.83 ± 1.9 10.93 ± 1.5 31.2 ± 2.1 63.2 ± 0.8 80.6 ± 1.9
CAV1 3.62 ± 1.8 13.2 ± 1.0 17.91 ± 2.5* 78.7 ± 1.7* 93.6 ± 2.0* 97.1 ± 1.7*
CAVM1 2.19 ± 1.8 9.62 ± 1.1 13.5 ± 1.8 23.1 ± 0.9 74.1 ± 1.8* 90.3 ± 0.6*
CAVM2 3.08 ± 1.3 11.5 ± 1.4 15.3 ± 1.6 50.1 ± 1.7* 83.4 ± 1.5* 93.5 ± 2.4*
CAVRNAi 1.37 ± 1.7 5.05 ± 1.4 9.78 ± 1.1 24.8 ± 2.5 57.7 ± 2.4 75.4 ± 3.1
GFP 1.44 ± 1.1 6.05 ± 1.8 11.2 ± 2.0 32.7 ± 1.6 65.4 ± 2.1 82.3 ± 3.0
*P < 0.05 vs control, ( ± SD, n = 3)
x
Table 4: Cell cycle distribution of HepG2 cells after treatment with or without RES for 48 h
Cell cycle distribution
Res (μM)
Cell groups DMSO 20 50 100 200
G1 G2 S G1 G2 S G1 G2 S G1 G2 S G1 G2 S
HepG2 76.3 9.6 14.1 73.0 13.5 13.5 25.3 4.8 69.9* 34.9 7.4 57.7* 72.7* 8.8 18.5
CAV1 57.9 10.0 32.1 15.4 7.5 77.1* 27.5 21.4 51.1* 65.8* 1.6 32.6 73.5* 24.2 2.3
CAVM1 58.9 16.0 25.0 69.5 8.9 21.6 33.9 10.5 55.7* 39.9 20.0 40.1* 79* 8.6 12.4
CAVM2 68.2 11.1 20.7 72.5 3.8 23.7 30.5 8.4 61.1* 75.8* 3.1 21.1 74.1* 8.5 17.4
CAVRNAi 57.8 10.2 38.1 45.3 16.4 32.3 37.5 21.1 55.0* 64.9* 19.5 15.7 69.2* 13.1 17.7
GFP 77.4 5.9 16.7 73.2 14.0 12.5 22.3 6.0 71.7* 30.4 7.8 61.8* 70.0* 10.5 20.5
*P < 0.05 vs control, [ ± SD, SD = (0.8~3.7), n = 3]
x
Journal of Translational Medicine 2009, 7:22 />Page 7 of 13
(page number not for citation purposes)
RES increases CAV1 expression and MAPKs activity in
HepG2 cells
Previous studies showed that RES induces apoptosis
through a caspase-dependent pathway. Therefore, the
activity of caspase 3, a major component of the caspase
pathways, was analyzed. In addition, the role ERKs and
p38 kinase in regulation of caspase-3 -mediated apoptosis
was studied by exposing cells to either DMSO (0.1–0.3%)
or RES (0–200 μmol/l) for 24 h. CAV1, MAPKs, and cas-
pase-3 protein levels were then determined by western
blot. The data suggested that RES induces CAV1 expres-
sion in a dose-dependent manner from 30–50 μM and
reached a peak value with higher concentration. Twenty-
four hours after RES treatment, pro-caspase activity was
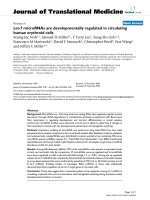
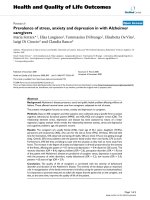
(A) The six cell groups were pre-treated with 200 μM RES for 48 h, and apoptotic cell ratios were then measured by flow cytometryFigure 1
(A) The six cell groups were pre-treated with 200 μM RES for 48 h, and apoptotic cell ratios were then meas-
ured by flow cytometry. (B) Percentage of dead cells calculated for HepG2 cells variants treated with 200 μM RES for 48 h.
Percentage of cell death was calculated over control. Data are presented as mean ± SD. Values represent the average of three
different experiments. (C) Fluorescence imaging of CAV1 and CAVM2 overexpressing cells. *, statistical differences from the
HepG2 cell control, p < 0.05.
Journal of Translational Medicine 2009, 7:22 />Page 8 of 13
(page number not for citation purposes)
reduced, and cleaved active caspase-3 was increased (Fig-
ure 5A). Phosphorylation of MAP kinases is essential for
full kinase activation. Using phospho-specific antibodies
against p38, ERKs and active caspase-3, we found that RES
induced a rapid and prolonged activation of ERKs (10–50
μM) (4.1- fold induction compared to control), as well as
activation of CAV1 or ERKs. Furthermore, RES increased,
p-p38 and active caspase-3 expression (2.1-fold induction
compared with control), whereas total ERKs and p38
kinase expression did not change. Similar results were
detected in CAV1 expressing mutant cell lines (Figure 5B).
Inhibition of p38MAP kinase leads to decreased apoptosis
As shown in Figure 1 and Table 1, RES treatment for 24 h
induced apoptotic death in HepG2 cells. Activation of
p38MAPK is involved in caspase-3-dependent cell death,
but the role of p38 MAPK in RES-induced CAV1 expres-
sion and consequent apoptosis of HepG2 cells was not
known. Therefore, HepG2 cells were pre-treated with the
specific p38MAPK inhibitor SB203580 in presence or
absence of RES and CAV1 and active caspase-3 expression
were measured by Western blot. Indeed 20 μM SB203580
significantly reduced levels of RES-induced phospho-
p38MAPK Resveratrol which was associated with signifi-
cant differences in CAV1 protein expression and conse-
quent apoptosis (Figure 5C).
Discussion
Hepatocellular carcinoma (HCC) is the fifth most com-
mon cancer and accounts for more than 1 million deaths
annually. The incidence of HCC in the Southeast Asia con-
tinues to rise steadily. Several systemic chemotherapies
have been tested unsuccessfully against HCC, which
remains incurable. Estrogen receptors (ERs) are localized
to many sites within the cell, exposure to estrogens is a
major known risk factor for breast cancer and other estro-
gen-mediated cancers. Experimental models suggest that
estrogens stimulate hepatocyte proliferation in vitro and
promote HCC growth in vivo. RES is a bioflavonoid that
exists as cis- and trans-isomers, and the trans-isomer has
greater anticancer and cardio-protective properties than
the cis-isomer. As an estrogen analog activating ERα and
ERβ, RES was suggested as a candidate chemo-preventive
agent and a treatment option for HCC. CAV1, a member
of Caveolin family may represent a tumor suppressor
abolishing anchorage-independent growth of trans-
formed cells and it is poorly expressed in HCC [31]. The
close coupling between RES and CAV1 is suggested by
ERα and ERβ co-localization within caveolin/lipid rafts
and direct associations with caveolin-1 via its special scaf-
folding domain (amino acids 80 to 101). Therefore, we
questioned whether RES interacting with CAV1 could sup-
press the proliferation of HCC. Preliminary experiments
excluded the possibility that the CAV1-mediated activity
of RES was due to direct CAV1-dependent activation of
ERα and ERβ and proposed a novel mechanism responsi-
ble for RES-CAV1 mediated anti-cancer activity in HCC.
In this report, the data in HepG2 cells indicate that RES
could inhibit the proliferation of HepG2 cells and
increase their apoptosis in a time and dose-dependent
fashion. In addition, our results are consistent with the
notion that CAV or CAVM2 promote apoptotic cell death
by inducing plasma membrane crimple, small volume
changes, increased density, DNA fragmentation and
changes in nuclear morphology. However, increased pro-
liferation was not accompanied by a reduction in cell
death in CAVM1 cells. An intriguing mechanism, in this
regard, is the presence of scaffolding domain in caveolin-
1 that binds to and inhibits the activity of several signaling
proteins in vitro and in situ, including the EGF and Neu
receptors, Src-family kinases (Src/Fyn), PKCs, eNOS and
the heterotrimeric G-proteins [32]. Thus, it remains to be
explained why over-expression of CAV1 by stable transfec-
tion enhances the anti-proliferative and pro-apoptotic
effects of RES whereas knocking down CAV1 expression
Table 5: Effect of RES on HepG2 variant xenograft weight
Group RES
(mg/kg)
nTumor
weight/mg
Inhibitory rate % Intra-group inhibitory rate%
HepG2 0 4 222.50 ± 22.5
HepG2 15 4 173.33 ± 33.3
a
22.11 22.11
CAV1 0 4 165.50 ± 10.2
a
25.84
CAV1 15 4 92.50 ± 15.1
b
58.43 44.12
CAVM1 0 4 337.50 ± 20.6
a
-51.68
CAVM1 15 4 117.50 ± 12.5
b
47.19 65.19
CAVM2 0 4 170.00 ± 18.9
a
23.61
CAVM2 15 4 142.50 ± 15.1
b
35.96 16.17
CAVRNAi 0 2 247.50 ± 7.07
a
-11.21
CAVRNAi 15 4 230.00 ± 6.80
b
-3.37 7.07
Values are means ± SEM, n = 4.
a. P < 0.05 vs control group.
b. P < 0.05 vs corresponding untreated group (RES at doses of 0 mg/kg)
Journal of Translational Medicine 2009, 7:22 />Page 9 of 13
(page number not for citation purposes)
by RNAi technology induces the inverse result. Whether
this observation reflects merely the superimposition of
two tumor suppressor mechanisms, or CAV1 can interact
synergistically with RES remains to be clarified.
Most chemo-therapeutic agents can traffic effectively to
tumors and deliver their cytotoxic functions; however
drug resistance is rapidly acquired predominantly
through altered entrance of the drug inside cancer cells.
This failure is due to rapid elimination by membrane pro-
teins of intracellular anticancer agents pumped out of cells
and cell organelles, decreasing intracellular concentra-
tions and efficacy [33]. The HPLC data suggest that the
distribution of RES is imbalanced between intra-cellular
and extra-cellular compartments. Despite increased intra-
cellular concentrations in a dose- and time-dependent
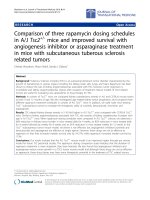
Effects of RES treatment on final tumor weight (A) and volume (B, C) in HepG2 cell variant xenograftsFigure 2
Effects of RES treatment on final tumor weight (A) and volume (B, C) in HepG2 cell variant xenografts. CAV1,
CAVM1, CAVM2, CAVRNAi and HepG2 cells (5 × 10
6
cells/0.2 ml) were implanted subcutaneously into the back of Balb/c-nu
female mice on day 0. RES treatment (15 mg/kg body) was started ten days after implantation. The tumor volume was calcu-
lated every 2 to 3 day. Values represent means × SEM, n = 4. a. P < 0.05 vs. control group. b. P < 0.05 vs. corresponding
untreated group.
Journal of Translational Medicine 2009, 7:22 />Page 10 of 13
(page number not for citation purposes)
manner, RES levels were always lower than in the super-
natant (Data not shown). Interestingly, we found that
intra-cellular RES concentration was increased 2-fold in
HepG2 cells stably expressing CAV1 compared to HepG2
wild-type or GFP-transduced cells. To further explore the
potential mechanism a scaffolding domain-defective
CAV1 mutant (CAVM1) and a cholesterol shuttle domain-
defective CAV1 mutant (CAVM2) were used to investigate
the mechanisms of RES transport. CAVM1 transfected into
HepG2 cells significantly elevated intracellular concentra-
tions of RES up to 2 fold according to HPLC estimates; this
was also consistent with CAV1 transfection experiments.
However, CAVM2, with a non-functioning cholesterol
shuttle domain did not enhance RES concentration in
cells. More detailed characterization of CAV1-dependet
RES transport required the synthesis of RES-dansyl chlo-
ride derivatives which could be utilized as fluorescent
probes: RES was found to co-localize with CAV1 in
HepG2 cells. In addition, RES endocytosis was not medi-
ated through ERα and ERβ, as confirmed by lack of com-
petitive inhibition by estrogens and tamoxifen.
Previous reports indicate that increasing levels of drug
resistance are most likely due to decreased topoisomerase
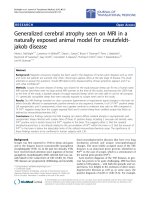
(A) HepG2 variants were pre-treated for 24 h with 200 μM RES and RES concentrations were detected in the cytoplasm by HPLCFigure 3
(A) HepG2 variants were pre-treated for 24 h with 200 μM RES and RES concentrations were detected in the
cytoplasm by HPLC. (B) – Values for individual variants. (C) – Res concentration in the cytoplasm of individual HepG2 cells
after 24 h pre-treatment with 200 μM RES. Each bar represents the mean ± S.E.M. of three independent experiments. (D)
Cytoplasmic RES concentration in HepG2 variants after 10
-6
~10
-4
M/L Diethylstilbestrol (DES) plus RES measured by HPLC.
(E) Individual variant values. (F) Mean ± S.E.M. values of three individual experiments. *, statistically significant differences
between experimental variant and HepG2 cell control, p < 0.05.
Journal of Translational Medicine 2009, 7:22 />Page 11 of 13
(page number not for citation purposes)
II protein levels [34]. In this study, we found that RES pre-
treatment (100 μM) promotes the expression of CAV1 or
topoisomerase-alpha while topoisomerase-alpha expres-
sion is inhibited completely in CAVRNAi cells. However,
100 μM RES pre-treatment recovered partially topoi-
somerase-alpha expression in CAVRNAi cells. These
results displayed that reduced CAV1 protein levels might
confer resistance and CAV1 may represent a new tool to
avoid multi-drug resistance by cancer cells. Finally, we
analyzed the relationship between RES and CAV1 expres-
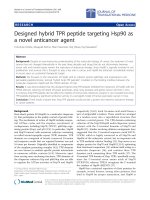
(A) – Co-localization of RES and CAV1 in HepG2 cells – Transport of dansyl chloride-derived RES with green fluorescence (A) and recombinant CAV1 distribution with red fluorescence (B) and the two combination of both (C)Figure 4
(A) – Co-localization of RES and CAV1 in HepG2 cells – Transport of dansyl chloride-derived RES with green
fluorescence (A) and recombinant CAV1 distribution with red fluorescence (B) and the two combination of
both (C). Pooled HepG2 cells and CAVM2 cells bearing green (D) or red fluorescence (E). Over-expression of CAV1 by
CAVM2 cell groups separates transfected from nontransfected HepG2 cells (E); the images are over-imposed in (F). Experi-
ments were repeated 3 times, with similar results. (B) – Immunohistochemistry of tissue microarrays. (Magnification 400×).
Immunoreactivity of CAV1 (red) and topoisomerase-alpha (Buffy) in HepG2 variant xenografts with (RES+) or without RES
treatment (RES-). (C) Immunofluorescence of CAV1 and topoisomerase-alpha – Comparison of untreated (left) or RES-treated
for 24 h (100 μM) (right). Localization of CAV1 and topoisomerase-alpha was visualized by indirect immunofluorescence.
Microphotographs of a single field stained with anti-CAV1 (green) and topoisomerase-alpha (red) antibodies. (Magnification
400×) Experiments were repeated 3 times, with similar results.
Journal of Translational Medicine 2009, 7:22 />Page 12 of 13
(page number not for citation purposes)
sion and their role in inhibiting proliferation or inducing
apoptosis of HepG2 cells. Immunoblotting analysis sug-
gests that RES could up-regulate endogenous CAV1
expression, which further mediates the activation of the
inhibitory p38MAPK cascade pathway and promotes the
activation of the pre-apoptotic protein caspase-3.
Overall, this study confirms for the first time that over-
expression of CAV1 enhances the transport of RES into
HepG2 through its cholesterol shuttle domain rather than
the scaffolding domain. This leads, in turn, in inhibition
of proliferation and induction of HepG2 cell apoptosis
mediated through the p38MAPK pathway and caspase-3
protein expression.
Competing interests
The authors declare that they have no competing interests.
Authors' contributions
HLY set up the protocols, HLY, WQC, XC, DLF, XL and
YYX contributed to the experimental procedures and in
the interpretation of the data, WYF, EW and FMM gave
(A) HepG2 cells were treated for 24 h with 0–200 μM RES; CAV1, MAPKs, and caspase-3 protein levels were further deter-mined by Western blotFigure 5
(A) HepG2 cells were treated for 24 h with 0–200 μM RES; CAV1, MAPKs, and caspase-3 protein levels were
further determined by Western blot. (B) – HepG2 variants were treated with 200 μM RES for 24 h; CAV-1, caspase-3
and MAPKs protein levels were determined by Western blot. (C) – HepG2 variants were pre-treated for 30 minutes with or
without 20 μM of the P38 inhibitor SB203580 prior to the 24 h treatment with 200 μM RES; CAV1, caspase-3 and MAPKs pro-
tein levels were determined by Western blot. Experiments were repeated 3 times, with similar results.
Journal of Translational Medicine 2009, 7:22 />Page 13 of 13
(page number not for citation purposes)
advises on the work and helped with the interpretation of
the data, WYF, AW, EW and DFS supervised all the work
and wrote the paper together with HLY and MFM. All
authors read and approved the final manuscript.
Acknowledgements
This work was supported by grants from the National Natural Science
Foundation of China (No. 30400265 and 30671047), Ministry of Education
Science and Technology Key Project (No. 207078), the Youth Foundation
of Hunan Province Education Department (No. 06B079) and Hunan Pro-
vincial Natural Science Foundation of China (08JJ3016).
References
1. Jang M, Cai L, Udeani GO, Slowing KV, Thomas CF, Beecher CW, et
al.: Cancer chemopreventive activity of resveratrol, a natural
product derived from grapes. Science 1997, 275:218-220.
2. Burkitt MJ, Duncan J: Effects of trans-resveratrol on copper-
dependent hydroxyl-radical formation and DNA damage:
evidence for hydroxyl-radical scavenging and a novel, glu-
tathione-sparing mechanism of action. Arch Biochem Biophys
2000, 381:253-263.
3. de la Lastra CA, Villegas I: Resveratrol as an anti-inflammatory
and anti-aging agent: mechanisms and clinical implications.
Mol Nutr Food Res 2005, 49:405-430.
4. Palamara AT, Nencioni L, Aquilano K, De CG, Hernandez L, Coz-
zolino F, et al.: Inhibition of influenza A virus replication by res-
veratrol. J Infect Dis 2005, 191:1719-1729.
5. Das DK, Maulik N: Resveratrol in cardioprotection: a thera-
peutic promise of alternative medicine. Mol Interv 2006,
6:36-47.
6. Das S, Das DK: Resveratrol: a therapeutic promise for cardio-
vascular diseases. Recent Patents Cardiovasc Drug Discov 2007,
2:133-138.
7. Ito T, Akao Y, Yi H, Ohguchi K, Matsumoto K, Tanaka T, et al.: Anti-
tumor effect of resveratrol oligomers against human cancer
cell lines and the molecular mechanism of apoptosis induced
by vaticanol C. Carcinogenesis 2003, 24:1489-1497.
8. Fulda S, Debatin KM: Sensitization for tumor necrosis factor-
related apoptosis-inducing ligand-induced apoptosis by the
chemopreventive agent resveratrol. Cancer Res 2004,
64:337-346.
9. Zhang Q, Tang X, Lu QY, Zhang ZF, Brown J, Le AD: Resveratrol
inhibits hypoxia-induced accumulation of hypoxia-inducible
factor-1alpha and VEGF expression in human tongue squa-
mous cell carcinoma and hepatoma cells. Mol Cancer Ther
2005, 4:1465-1474.
10. Chan WK, Delucchi AB: Resveratrol, a red wine constituent, is
a mechanism-based inactivator of cytochrome P450 3A4.
Life Sci
2000, 67:3103-3112.
11. Tseng SH, Lin SM, Chen JC, Su YH, Huang HY, Chen CK, et al.: Res-
veratrol suppresses the angiogenesis and tumor growth of
gliomas in rats. Clin Cancer Res 2004, 10:2190-2202.
12. Pozo-Guisado E, Merino JM, Mulero-Navarro S, Lorenzo-Benayas MJ,
Centeno F, varez-Barrientos A, et al.: Resveratrol-induced apop-
tosis in MCF-7 human breast cancer cells involves a caspase-
independent mechanism with downregulation of Bcl-2 and
NF-kappaB. Int J Cancer 2005, 115:74-84.
13. Szewczuk LM, Lee SH, Blair IA, Penning TM: Viniferin formation by
COX-1: evidence for radical intermediates during co-oxida-
tion of resveratrol. J Nat Prod 2005, 68:36-42.
14. Tyagi A, Singh RP, Agarwal C, Siriwardana S, Sclafani RA, Agarwal R:
Resveratrol causes Cdc2-tyr15 phosphorylation via ATM/
ATR-Chk1/2-Cdc25C pathway as a central mechanism for S
phase arrest in human ovarian carcinoma Ovcar-3 cells. Car-
cinogenesis 2005, 26:1978-1987.
15. Bhat KP, Lantvit D, Christov K, Mehta RG, Moon RC, Pezzuto JM:
Estrogenic and antiestrogenic properties of resveratrol in
mammary tumor models. Cancer Res 2001, 61:7456-7463.
16. Klinge CM, Blankenship KA, Risinger KE, Bhatnagar S, Noisin EL,
Sumanasekera WK, et al.: Resveratrol and estradiol rapidly acti-
vate MAPK signaling through estrogen receptors alpha and
beta in endothelial cells. J Biol Chem 2005, 280:7460-7468.
17. Galluzzo P, Caiazza F, Moreno S, Marino M: Role of ERbeta palmi-
toylation in the inhibition of human colon cancer cell prolif-
eration. Endocr Relat Cancer 2007, 14:153-167.
18. Rejman J, Conese M, Hoekstra D: Gene transfer by means of
lipo- and polyplexes: role of clathrin and caveolae-mediated
endocytosis. J Liposome Res 2006, 16:237-247.
19. Razani B, Schlegel A, Liu J, Lisanti MP: Caveolin-1, a putative
tumour suppressor gene. Biochem Soc Trans 2001, 29:494-499.
20. Ho CC, Huang PH, Huang HY, Chen YH, Yang PC, Hsu SM: Up-reg-
ulated caveolin-1 accentuates the metastasis capability of
lung adenocarcinoma by inducing filopodia formation. Am J
Pathol 2002, 161:1647-1656.
21. Liu P, Rudick M, Anderson RG: Multiple functions of caveolin-1.
J Biol Chem 2002, 277:41295-41298.
22. Peterson TE, Guicciardi ME, Gulati R, Kleppe LS, Mueske CS, Mook-
adam M, et al.: Caveolin-1 can regulate vascular smooth mus-
cle cell fate by switching platelet-derived growth factor
signaling from a proliferative to an apoptotic pathway. Arte-
rioscler Thromb Vasc Biol 2003, 23:1521-1527.
23. Duxbury MS, Ito H, Ashley SW, Whang EE: CEACAM6 cross-link-
ing induces caveolin-1-dependent, Src-mediated focal adhe-
sion kinase phosphorylation in BxPC3 pancreatic
adenocarcinoma cells. J Biol Chem 2004, 279:23176-23182.
24. Graziani A, Bricko V, Carmignani M, Graier WF, Groschner K: Cho-
lesterol- and caveolin-rich membrane domains are essential
for phospholipase A2-dependent EDHF formation. Cardiovasc
Res 2004, 64:234-242.
25. Bowers JL, Tyulmenkov VV, Jernigan SC, Klinge CM: Resveratrol
acts as a mixed agonist/antagonist for estrogen receptors
alpha and beta. Endocrinology 2000, 141:3657-3667.
26. Yang H, He S, Quan Z, Peng W, Yan B, Liu J, et al.: Small interfering
RNA-mediated caveolin-1 knockout on plasminogen activa-
tor inhibitor-1 expression in insulin-stimulated human vascu-
lar endothelial cells. Acta Biochim Biophys Sin (Shanghai) 2007,
39:224-233.
27. Xu YY, Yang HL, Tu J: The construction, Identification and pri-
mary functional analysis of pcDNA3.1/NT-GFP-Caveolin-1
and mutants plasmids. Chin J Atheroscler 2006, 13:297-300.
28. Yang HL, Jiang HJ, Fang WY, Xu YY, Liao DF, He FC: High fidelity
PCR with an off/on switch mediated by proofreading
polymerases combining with phosphorothioate-modified
primer. Biochem Biophys Res Commun
2005, 328:265-272.
29. Yang HL, Xu YY, DU LF, Liu CH, Zhao Q, Wei WJ, et al.: Chemok-
ine SR-PSOX/CXCL16 expression in peripheral blood of
patients with acute coronary syndrome. Chin Med J (Engl) 2008,
121:112-117.
30. Quan Z, Yang H, Yang Y, Yan B, Cao R, Wen G, et al.: Construction
and functional analysis of a lentiviral expression vector con-
taining a scavenger receptor (SR-PSOX) that binds uniquely
phosphatidylserine and oxidized lipoprotein. Acta Biochim Bio-
phys Sin (Shanghai) 2007, 39:208-216.
31. Yerian LM, Anders RA, Tretiakova M, Hart J: Caveolin and throm-
bospondin expression during hepatocellular carcinogenesis.
Am J Surg Pathol 2004, 28:357-364.
32. Torres VA, Tapia JC, Rodriguez DA, Parraga M, Lisboa P, Montoya M,
et al.: Caveolin-1 controls cell proliferation and cell death by
suppressing expression of the inhibitor of apoptosis protein
survivin. J Cell Sci 2006, 119:1812-1823.
33. Pakunlu RI, Wang Y, Tsao W, Pozharov V, Cook TJ, Minko T:
Enhancement of the efficacy of chemotherapy for lung can-
cer by simultaneous suppression of multidrug resistance and
antiapoptotic cellular defense: novel multicomponent deliv-
ery system. Cancer Res 2004, 64:6214-6224.
34. Hazlehurst LA, Argilagos RF, Emmons M, Boulware D, Beam CA, Sul-
livan DM, et al.: Cell adhesion to fibronectin (CAM-DR) influ-
ences acquired mitoxantrone resistance in U937 cells. Cancer
Res 2006, 66:2338-2345.