Báo cáo hóa học: " Sleep quality in mechanically ventilated patients: comparison between NAVA and PSV modes" doc
Bạn đang xem bản rút gọn của tài liệu. Xem và tải ngay bản đầy đủ của tài liệu tại đây (603.97 KB, 8 trang )
RESEARCH Open Access
Sleep quality in mechanically ventilated patients:
comparison between NAVA and PSV modes
Stéphane Delisle
1,2,3*
, Paul Ouellet
3,4,5
, Patrick Bellemare
1
, Jean-Pierre Tétrault
3
and Pierre Arsenault
3
Abstract
Background: Mechanical ventilation seems to occupy a major source in alteration in the quality and quantity of
sleep among patients in intensive care. Quality of sleep is negatively affected with frequent patient-ventilator
asynchronies and more specifically with modes of ventilation. The quality of sleep among ventilated patients
seems to be related in part to the alteration between the capacities of the ventilator to meet patient demand. The
objective of this study was to compare the impact of two modes of ventilation and patient-ventilator interaction
on sleep architecture.
Methods: Prospective, comparative crossover study in 14 conscious, nonsedated, mechanically ventilated adults,
during weaning in a university hospital medical intensive care unit. Patients were successively ventilated in a
random ordered cross-over sequence with neurally adjusted ventilatory assist (NAVA) and pressure support
ventilation (PSV). Sleep polysomnography was performed during four 4-hour periods, two with each mode in
random order.
Results: The tracings of the flow, airway pressure, and electrical activity of the diaphragm were used to diagnose
central apneas and ineffective efforts. The main abnormalities were a low percentage of rapid eye movement
(REM) sleep, for a median (25th-75th percentiles) of 11.5 % (range, 8-20%) of total sleep, and a highly fragmented
sleep with 25 arousals and awakenings per hour of sleep. Proportions of REM sleep duration were different in the
two ventilatory modes (4.5% (range, 3-11%) in PSV and 16.5% (range, 13-29%) during NAVA (p=0.001)), as well as
the fragmentation index, with 40 ± 20 arousals and awakenings per hour in PSV and 16 ± 9 during NAVA ( p =
0.001). There were large differences in ineffective efforts (24 ± 23 per hour of sleep in PSV, and 0 during NAVA)
and episodes of central apnea (10.5 ± 11 in PSV vs. 0 during NAVA). Minute ventilation was similar in both modes.
Conclusions: NAVA improves the quality of sleep over PSV in terms of REM sleep, fragmentation index, and
ineffective efforts in a nonsedated adult popul ation.
Background
Sleep is severely disturbed in mechanically ventilated
ICU patients [1-3]. Sleep alterations are known to have
deleterious consequences in healthy subjects, but the
paucity of data in the literature [4-7] makes it difficult
to determine the impact of sl eep abnormalities in ICU
patients. Intensive care unit (ICU) patients present dis-
rupted sleep with reduced sleep efficiency and a
decrease in slow wave sleep and rapid eye movement
(REM) sleep [8-10]. Furthermore, polysomnographic
studies performed on mechanically ventilated ICU
patients have demonstrated an increase in sleep
fragmentation, a reduction in slow-wave and REM sleep,
and an abnormal distribution of sleep, because almost
half of the total sleep time occurred during the daytime
[11-13]. In the Freedman et al. study [14], noise was
considered a nuisance for the patients questioned; the
most annoying noises were alarms and caregivers’ con-
versations. When the same authors simultaneously
recorded noise and microarousal, they identified an
association between arousal and noise in only 11-17% of
the cases [11]. This percentage is confirmed by Gabor et
al. [3] where 21% of the arousal interruptions were
explained by loud noises and 7% to patients’ care.
Seventy-eight percent of the microarousals were not
* Correspondence:
1
Service des soins intensifs, Hôpital du Sacré-Cœur de Montréal, Montréal,
Québec, Canada
Full list of author information is available at the end of the article
Delisle et al. Annals of Intensive Care 2011, 1:42
/>© 2011 Delisle et al; licensee Springer. This is an Open Access article d istributed under the terms of the Creative Commons Attribution
License (http://creativecommons. org/licenses/by/2.0), which permits unrestricted use, distribution, and reproduction in any medium,
provided the original work is properly cited.
associated with environment noises, suggesting other
causes, such as patient/ventilator asynchrony [3,14].
The effects of assist control ventilation (ACV) and
pressure support ventilation (PSV) o n sleep fragmenta-
tion have been examined in critically ill patients receiv-
ing mechanical ventilation [15], where PSV m ode was
associated with increases in the number of central
apneas and subsequent sleep fragmentation compared
with AVC. Furthermore, the study suggested that PSV
by itself or an excess of ventilator assistance with PSV
could have caused such sleep alterations. Indeed, venti-
latory settings adjusted during wakefulness may become
excessive during sleep, as the patients’ ventilatory
demand is reduced while asleep [16]. Whether these
results can be explained by the ventilatory mode itself
or how it was adjusted is an important issue, because
hyperventilation and patient ventilator asynchrony may
result from PSV as well a s ACV in mechanically venti-
lated ICU patients [17]. Fanfulla et al. [18] compared
two ventilatory settings in nine patients under long-term
PSV for neuromuscular disease. The initial setting was
set according to clinical parameters, and the second set-
ting was adjusted with measurement of esophageal pres-
sure (physiological setting) to optimize patient effort.
The physiological setting improved the duration and
quality of sleep, decreased episodes of apnea, and the
amount of inefficient efforts for ventilator triggering
[18]. The level of pressure support and PEEP tended to
decrease, with a lowering of intrinsic PEEP and patient-
ventilator asynchronies. A recent study by Cabello et al.
[19] compared the impact of three modes of ventilation
(AVC, PSV, and SmartCare™) on the quality of sleep in
alert and nonsedated patients, and no difference for the
architecture, fragmentation, and duration of sleep was
found among the three modes.
Our hypothesis is that NAVA ventilation is superior
to PSV by allowing optimal patient-ventilator synchrony
and thereby decreasing sleep fragmentation.
Methods
This study was approved by the Ethics Committee of
the Hôpital du Sacré-Coeur de Montréal, and patients
or their surrogates gave written informed consent.
Patients
This physiologic study was conducted in a 22-bed medi-
cal ICU during a 12-month period. The weaning phase
of mechanical ventilation was chosen because patient-
ventilator asynchrony is common when patients are
spontaneously triggering breaths. The inclusion criteria
required that the patient was conscious, free from seda-
tion and opiate analgesia for ≥ 24 hours, and ventilated
in PSV mode with an FIO2 < 60%, P EEP = 5 cmH
2
O,
and SpO2 ≥ 90%. Exclusion criteria consisted of the
presence of a central nervous system disorder, Glasgow
Coma Scale score < 11, hemodynamic instability, renal
and/or hepatic insufficiency, and ongoing sepsis.
Methods
All patients were ventilated through an endotracheal
tube or a tracheostomy; once they met the inclusion
criteria, they were connected to a Servo i ventilator
(Maquet critical Care, Sölna, Sweden), equipped with a
neurally adjusted ventilator assist system (NAVA). The
electrical activity of the diaphragm (EAdi) is captured
with the EAdi catheter (Maquet Critical Care, Sölna,
Sweden) consisting of a 16-Frgastrictubeequipped
with electrodes. End-tidal CO
2
was monitored with the
Servo-i Volumetric CO2 module. The two different
ventilatory modes were delivered in a randomized
order using a closed-envelope technique during four
periods of 4 hours: a daytime period from 7 to 11 a.m.
and 12 to 4 p.m., and a nocturnal period from 10 p.m.
to 2 a.m. and 3 to 7 a.m. To prevent possible data con-
tamination from the previous mode of ventilation, a 1-
hour washout period after a ventilator change was
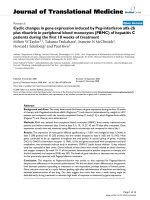
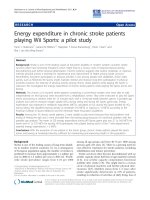
introduced before data acquisition (Figure 1; Study
Protocol).
During periods of wakefulness, P SV and NAVA were
clinically adjusted by the attending physician to obtain
a tidal volume of 8 mL/kg of predicted body weight
and a respiratory rate ≤ 35 breaths/min. For both
modes of ventilation, inspiratory triggering sensitivity
was set at thresholds that would not allow auto-trig-
gering for both modes of ventilation: 0.5 mV in NAVA
and 5 in PSV.
EEG was recorded from standard locations: left fron-
tal/right mastoïd reference (F3/M2 o r F3/A2), right
frontal/left mastoid reference (F4/M1or F4/A1), left cen-
tral/right mastoïd reference (C3/M2 or C3/A2), right
central/left mastoïd reference (C4/M1 or C4/A1), left
occipital/right mastoïd reference (O1/M2 or O1/A2),
and right occipital/left mastoïd reference (O2/M1or O2/
A1), according to the International 10-20 System for
electrode placement [20]. The standard reference used
was the left mastoid lead [20]. Two electro-oculogram
and three chin electromyogram leads were used to score
REM and non-REM sleep. The electroencephalogram,
the right and left electro-oculogram, and the submental
electromyogram signals were amplified and recorded in
the data acquisition system (Alice 5 polysomnograp hy
system using Alice
®
Sleepware™ 2.5 sof tware, Respiro-
nics, Nantes, France).
Sleep recordings were manually read and scored by
an independent pulmonologist blinded to the study,
using the criteria of Rechtschaffen and Kales [21,22]
and the criteria of the American Sleep Disorder Asso-
ciation for arousals and awakenings [23,24]. Diagnosis
Delisle et al. Annals of Intensive Care 2011, 1:42
/>Page 2 of 8
of central apnea was based on international recom-
mendations [24]. The diagnosis of central apnea is
characterized by absent breathing and respiratory effort
for a period of at least 10 seconds. Arousals and awa-
kenings were considered secondary to apnea when
occurring within three cycles and/or 15 sec after a
respiratory event [25,26]. Ineffective efforts were
defined as an inspiratory effort observed by a peak
electrical activity of the diaphragm (EAdi peak) with-
out a simultaneously triggered ventilator cycle. Airflow,
Paw, and EAdi were acquired from the ventilator
through a RS232 interface at a s ampling rate of 100
Hz, recorded by a dedicated software (Nava Tracker V.
2.0, Maquet Critical Care, Sölna, Sweden), and an ana-
lyzer using software Analysis V 1.0 (Maquet Critical
Care) and a customized software based for Microsoft
Excel. An arousal or awakening event was considered
secondary to ineffective triggering when it occurred
within 15 seconds after the asynchrony [19].
Noise was measured with a portable noise meter at
the level of patient’s head (Quest Technologies, Ocono-
mowoc, WI). Arousals and awakenings were associated
with the noise when they occurred 3 seconds after or
within noise increase ≥10 dB [3,11]. Inspiratory trigg er
delay was calculated as the time difference between the
onset of EAdi peak and Paw inspiratory swings. Cycling-
off delay was calculated as the time difference between
the end of the inspiratory EAdi peak deflection and the
onset of expiratory flow.
Statistics analysis
Statistical analysis was performed using SPSS statistic al
software (SPSS 17.0). Continuous variables were
expressed as median (25
th
-75
th
percentile) or mean ±
SD. Data were compared using the general linear model
for repeated measures (GLM). The small sample of
patients led us to use Wilcoxon’s t test for paired sam-
ples, and the p values for multiple comparisons were
corrected for t he Bonferroni inequality. A two-tailed p
value < 0.05, corrected as needed, w as retained to indi-
cate statistical significance.
Results
Patients
Fourteen patients were selected and none were excluded
during the study. Their main characteristics are shown
in Table 1 . Acute respiratory failure was the most fre-
quent reason to initiate mechanical ventilation in ten
patients, postoperative complications in three patients,
and septic shock in one patient.
Sleep recordings
All patients completed the study, and recordings were well
tolerated. Individual sleep data are shown in Table 2. The
median total sleep time was 564 (range, 391-722) minutes.
The median sleep efficiency (i.e., the percentage of sleep dur-
ing the study) was 59 % (range, 41-75%). The main abnormal-
ities observed on each patient were a diminished percentage
of REM sleep, counting for only 11.5% (range, 8-20%) of
total sleep time, and a high fragmentation index with 25
arousals and awakenings per hour (range, 18-51). Although
interindividual variability was large, the median quantity of
slow-wave sleep (stages 3 and 4 or NREM3 stage) was nor-
mal, with a median of 18.5 (range, 11.5-22; Table 2).
Ventilatory modes and sleep distribution
Slee p efficiency and architect ure appeared very different
for both modes of ventilation (NAVA and PSV). Stage 1
Figure 1 Patients were studied for a period of 4 hours for each recording sequences and for more than 19 consecutive hours.
Table 1 Characteristics of patients
Characteristics of patients
Sex (M/F) (8/6)
Age (yr ± SD) 64 ± 11
SAPS II ± SD 46 ± 12
Duration of MV (days ± SD) 17 ± 9
Tracheotomy (%) 2 (14)
Cause for initial MV (%)
Acute respiratory failure 10 (71.5%)
Postoperative complication 3 (21.5%)
Septic shock 1 (7%)
M = male; F = female; SAPS = Simplified Acute Physiology score; MV =
mechanical ventilation.
Delisle et al. Annals of Intensive Care 2011, 1:42
/>Page 3 of 8
(NREM1 stage) lasted longer during PSV compared with
NAVA 7.5% (range, 4-15%) vs. 4% (range, 3-5%; p =
0.006). Stage 2 (NREM2 stage) also lasted longer in PSV
than NAVA 68% (range, 66-75%) vs. 55% (range, 52-
58%; p = 0.001). Stage 3-4 (NREM3 stage) was shorter
in PSV as opposed to NAVA 16.5% (range, 17-20%) vs.
20.5% (range, 16-25%; p = 0.001). REM stage (R stage)
was much shorter in PSV than in NAVA 4.5% (range, 3-
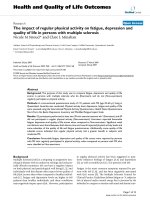
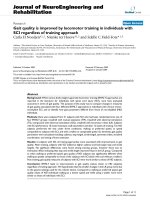
11%) vs. 16.5% (range, 13-29%; p = 0.001). The fragmen-
tation index was different between the two ventilation
modes, with 40 ± 20 arousals and awakenings per ho ur
in PSV and 16 ± 9 during NAVA (p = 0.001; Figure 2
Sleep stage (percent of total sleep) during two ventila-
tory modes; Table 3).
Minute ventilati on did not significantly differ between
PSV and NAVA with median values of 9.8 L/min
(range, 8.0-10.9), and 9.6 L/min (range, 7.5-11.0) respec-
tively (p = 0.51). The median respiratory rates were 17
breaths/min (range, 14-21), and 20 breaths/min (range,
15-23) during PSV and NAVA (p = 0.14). Median tidal
volume was 420 mL (8.1 mL/Kg of predicted body
weight; range, 375-479 mL), and 378 mL (7.3 mL/Kg of
predicted body weight; range, 370-448 mL) during PSV
and NAVA, respectively (p = 0.36). The mean PSV level
was15±5cmH
2
O, and the mean NAVA level was 1.6
±1.4cmH
2
O/μV. Positive end-expiratory pressure was
kept at 5 cmH
2
O for all patients.
Apneas and ineffective efforts
Ten of the 14 patients presented sleep apnea, and 11
exhibited ineffective efforts. The mean index of sleep
apneas (number of apneas per hour of sleep) was 10.5 ±
11 apneas during PSV and 0 durin g NAVA (p =0.005)
and ineffective efforts (number of ineffective efforts per
hour of sleep) was 24 ± 23 ineffective efforts during
PSV and 0 during NAVA (p = 0.001). Over-assistance
during sleep is sensed on the previous three cycles pre-
ceding central apnea. Tidal volume and minute ventila-
tion increased, whereas ETCO2 and EAdi dec reased
over the three cycles preceding central apnea Table 4.
Trigger delay and cycling-off delay
During N-REM sleep in PSV, the trigger delay increased
on average by 80 ± 26 (mse c) during stage 1 versus 158
± 42 (msec) during stage 3 and 4. The expiratory trigger
(cycling-off) increased in PSV by 158 ± 103 (msec) and
258 ± 87 (msec) durin g stage 1 and stages 3 and 4,
Table 2 Sleep architecture and fragmentation during the study (16 hours)
Patient Stage 1 (%) Stage 2 (%) Stages 3 and 4 (%) Rapid eye movement (%) Fragmentation index
1 5 72.5 19.5 2.5 23.5
2 2.5 67 22.5 7 35.5
3 4 61 24.5 9 30.5
4105711 20 68
5 9 61 24 5.5 16.5
6 6 57 24 12.5 15
7 5 63 22 7.5 13.5
8 11 66.5 9 10.5 64.5
9 5.5 58 17.5 19 15.5
10 11 60.5 9.5 17 56.5
11 3 66 21 9 26
12 3.5 61.5 13 22 23
13 5.5 60 13 21.5 22
14 10 59 10.5 20.5 67.5
Median [25-75
th
percentiles] 5.5 [4-10] 61 [59-65] 18.5 [11.5-22] 11.5 [8-20] 25 [18-51]
Figure 2 Sleep stages (percent of total sleep) during the two
ventilator modes: pressure support ventilation (PSV), and
neurally adjusted ventilatory assist (NAVA). REM = rapid eye
movement.
Delisle et al. Annals of Intensive Care 2011, 1:42
/>Page 4 of 8
respectively. In NAVA, the trigger delay remained stable
during sleep, 68 ± 24 (msec) during stage 1 and 72 ± 32
(msec) during stages 3 and 4. The expiratory trigger also
remained st able in NAVA: 39 ± 28 (msec) during
stage 1 and 41 ± 34 (msec) during stages 3 and 4.
Noise
In ICU, we recorded the average baseline ambient noise
level and evaluated arousals from this baseline to a peak
noise level ≥ 10 dB above ambient noise level. The
mean noise level was recorded at 64 ± 8 dB, with the
peak level recorded at 111 dB and the minimal level at
52 dB. No differen ces were observed between the two
different ventilatory modes concerning the index of frag-
mentation associated with noise: 7.5 ± 3 during PSV and
6±3.5duringNAVA(p = 0.19). These data indicate
that 18% during PSV and 21% during NAVA of the
fragmentation was associated with sudden increases in
noise.
Sleep distribution among study periods
The cross-over pattern was balanced with an equal
number of patients from each sequence initiating the
rotation. Independent of the ventilatory mode, sleep effi-
ciency and sleep architecture had a significantly different
distribution based on the study period considered
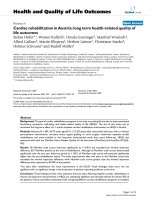
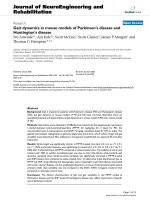
(Figure 3–sleep stage (percent of total sleep) during the
four daily time periods). Sleep efficien cy was the sa me
in the two daytime periods (2 periods during the day):
52% (range, 26-67%) during the first day period (7 h-11
h a.m.) and 51.5% (range, 27-67%) during the second
day period (12 h-4 h p.m.; p=0.18). Sleep efficiency
also did not differ between the two night periods: 65.5%
(range, 37-82%) during the first night period (10 h p.m
2 h a.m.) and 65% (range, 45-82.5%) during the second
nighttime period (3 h-7 h a.m.; p = 0.11).
There was no statistical difference between stage 1
and 2 recording periods. A greater duration of slow-
wave sleep (stage 3-4) was found during the first noctur-
nal period wit h a median percentage 22.5% (range, 20-
33.5%) vs. 15.5% (range, 7-19.5%) during first day period
(p = 0.03), vs. 15% (range, 7-18%) during second day
period (p = 0.01) and vs. 18% (range, 13-21%) during
second nighttime period (p = 0.001).
The proportion o f REM sleep was longer during the
second nocturnal p eriod, with a median percentage of
16.5% (range, 15-25%) vs. 11.5% (range, 5-15%) during
first day period (p = 0.001) vs. 9% (range, 5-15%) during
second day period (p = 0.001) and vs. 10.5% (range, 7-
21%) during first nightt ime period (p = 0.02). The frag-
mentation index did not differ with 26 (range, 20-65)
arousals and awakenings/hour during first daytime vs.
24 (range, 1 9-55), 23 (range, 18-57), and 19 (range, 15-
53)duringtheseconddayperiodandfirstandsecond
night period, respectively (p = 0.08). Ineffective effort
indexes per hour also were similar across the four
periods.
Discussion
In a study where spontaneously breathing patients were
conscious and under mechanical ventilation, proportions
of sleep fragmentation sleep architecture and sleep qual-
ity were positively influenced by NAVA. In the PSV
mode, a low percentage of REM sleep and a high degree
of fragmentation were present. NAVA showed a normal
percentage of REM sleep with an important decrease in
fragmentation.
Less than 15% of the s leep fragmentations in the
PSV mode were attributed to apneas and ineffective
efforts, whereas in NAVA, no asynchrony (no apnea
and no ineffective patient efforts) were recorded.
Environmental noise is responsible for 18% of the
arousals and awakenings in PSV compared with 21% in
NAVA, respectively.
We observed results similar to the Cabello et al. [19]
study concerning the rate of fragmentation, the number
of central apneas, and the number of ineffective patient
efforts during PSV. Another similar finding concerned
the increased percentage of REM sleep during the sec-
ond nighttime period recordings. However, one major
difference between our study and the Cabello study is
Table 3 Comparison of sleep quality between the
ventilatory modes
PSV NAVA p
Stage 1, % 7.5 [4-15] 4 [3-5] 0.006*
Stage 2, % 68 [66-75] 55 [52-58] 0.001*
Stage 3 and 4, % 16.5 [17-20] 20.5 [16-25] 0.001*
REM, % 4.5 [3-11] 16.5 [13-29] 0.001*
Fragmentation index, (n/h) 33.5 [25-54] 17.5 [8-21.5] 0.001*
Sleep efficacy, % 44 [29-73.5] 73.5 [52.5-77] 0.001*
PSV = pressure support ventilation; NAVA = neurally adjusted ventilatory
assist; REM = rapid eye movement; Fragmentation Index = number of arousals
and awakenings per hour of sleep; Sleep efficiency = duration of sleep/total
duration of recording.
Values are expressed as median [interquartile range].
*p < 0.05.
Table 4 Oscillatory behaviour of various ventilator
parameters for stages 3-4 with PSV mode of ventilation
Respiratory variables Baseline Pre-apneas PSV
V
T
(mL) 425 ± 67 585 ± 70
RR (breath/min) 13 ± 2 12 ± 1
VE (L/min) 5.2 ± 0.5 6.8 ± 0.8
ETCO
2
(mmHg) 46 ± 1.4 42 ± 1.0
EAdi (mVolt) 15 ± 4 10 ± 2
V
T
= tidal volume; RR = respiratory rate; VE = minute ventilation; ETCO
2
=
end-tidal carbon dioxyde; PSV = pressure support ventilation.
Delisle et al. Annals of Intensive Care 2011, 1:42
/>Page 5 of 8
that they did not allocate an even distribution for each
of the study periods and ventilatory strategies. Also,
they did not allow washout periods between the ventila-
tory modes, which could possibly contaminat e the
recordings at the beginning of the next study period.
Detecting asynchronies also was different; they used the
airway pressure-flow signal and the thoracoabdominal
plethysmography, whereas we observed the EAdi signal.
Parthasarathy and Tobin [15] found a lower rate of
sleep fragmentation during ACV compared with PSV.
This was explained by the central apneas induced by
over-assistance during PSV. In fact, tidal volume was
much greater during PSV compared with ACV. This
was validated by the addition of a dead space to the 11
patients showing central apneas, which significantly
decreased the number of apneas.
IntheToublancetal.study[27],nodifferencewas
found in terms of quantity, quality of sleep, and in
terms of arousal index between the AC and a low level
of PSV assistance for the whole night. Toublanc et al.
found that ACV was superior in terms of percentage of
slow-wave sleep but not during REM sleep [27]. It is
very difficult to compare the results for PSV because of
a lack of information on expiratory triggering with Evita
4, number of asynchronies (tidal volume, respiratory
rate, and minute ventilation). In the Toublanc study, the
majority of patients were affected with COPD and pres-
sure support was adjusted to 6 cmH
2
O. According to
Brochard et al., it is suggested that for COPD patients,
thepressuresupportneeded to overcome resistance
imposed by the endotracheal tube is higher than non-
COPD patients: 12 ± 1.9 vs 5.7 ± 1.5 cmH
2
O respec-
tively [28]. In the Leleu et al. study, pressure support
must be superior to 6 cmH
2
O, particularly in COPD if
the intention is to comp ensate work of breathing
imposed by the endotracheal tube, ventilator circuit, and
patient effort to trigger the demand valve during pres-
sure support [29]. A low-pressure support only allows
for partial relieve of imposed work of breathing without
modifying the work necessary to trigger the demand
valve. In t he Toublanc study, pressure support set too
low in COPD patients resulted in an increase in
imposed work of breathing, which can be accounted for
in the decrease in SWS and REM.
TheToublancstudyoffersno information on expira-
tory triggering, which is somewhat important in COPD
patients. Tassaux et al. recently have evaluated the posi-
tive impact of shortening inspiratory time in PSV on
patient-ventilator asynchronies and the work of breath-
ing in COPD patients. This study also demonstrated
that the increase in expiratory trigger up to 70% of peak
flow improved synchrony and decreased ineffective
efforts without modifying work of breathing or minute
ventilation [30].
Bosma et al. evaluated the impact on sleep with other
modes of ventilation, such as the proportional assist
ventilation (PAV). The objective of PAV, such as
NAVA, is to improve patient ventilator synchrony by
delivering ventilator assist proportional to patient effort.
The study by Bosma et al. shows an improvement in the
quality of sleep using PAV compared with PSV during
one night sleep [31]. There are s imilarities between the
Bosm a study and ours. More specifica lly, PAV appeared
superior to PSV in ter ms of decrease in arousals,
improvement in sleep quality, decrease in amounts of
arousals, awakenings per hour, and improved SW S and
REM. With NA VA, we observed a de crease in tidal
volume by up to 15% during REM sleep, which
increased end-tidal CO
2
by approximately 4 mmHg.
Bosmaetal.observedatidalvolumeslightlymoreele-
vated in PSV compared with PAV (despite similar off-
loading of the work of breathing), resulting in a higher
morning PaCO
2
with PAV attributed to lower tidal
volume and minute ventilation [31], thus offering per-
haps a protection against central apneas. Finally, fewer
patient-ventilator asynchronies were observed with PAV
with fewer awakenings per hour [31].
Contrary to NAVA, PAV cannot eliminate wasted or
ineffective efforts. There was a nonstatistically significant
difference in ineffective triggering during inspiration;
19.6 n/hr for PSV vs. 11.6 n/hr for PAV [31]. According
to Thille et al. ineffective efforts and double triggering
are among the most frequent asynchronies: 85 and 13%
respectively [32], which is somewhat contradictory to
Bosma et al. who identify auto triggering as the most
frequent asynchrony in PSV.
We observed that the absence of central apnea and
ineffective efforts in NAVA do not totally explain the
Figure 3 First daytime period (7 h-11 h a.m.), second daytime
period (12 h-4 h p.m.), first nighttime period (10 h p.m. to 2 h
a.m.) and second nighttime period (3 h-7 h a.m.).
Delisle et al. Annals of Intensive Care 2011, 1:42
/>Page 6 of 8
great improvement in the SWS and REM sleep. This
improvement may be explained in part by a microanaly-
sis of the sleep architecture. The microanalysis suggests
an over-assistance with PSV during the N-REM stages,
because 100% of the fragmentations in PSV occurred
during this stage. The tidal volume decrease in NAVA
follows the respiratory physiologic changes during sleep,
whereas in PSV we find a tidal volume oscillatory beha-
vior due to constant inspiratory efforts, independent of
the sleep stage and produces sequential over-assistance
during N-REM sleep leading to a decrease in end-tidal
CO
2
. It is our assumption that improvement of the
slow-wave sleep and REM is most probably explained by
better patient comfort through better neuromechanical
coupling.
During sleep, the respiratory accessory muscles (inter-
costals, scalene, and abdominals) decrease their muscle
tone and the mechanical response of the diaphragm is,
in part, spent in the production of a mechanical distor-
tion of the chest wall, secondary to a lack of synchroni-
zation between diaphragmatic contraction and the
accessory muscles. NAVA improves this mechanical dis-
tortion, whereas PSV worsens this dist ortion by a tidal
volume oscillation (overshoot) during sleep, with a con-
stant patient effort. Patient comfort is not only directly
related to inefficient efforts and central apneas; the
microanalysis showed that during N-REM sleep in PSV,
the trigger delay increased during stage 1 versus during
stage 3 an d 4. The expiratory trigger increased in PSV
during stage 1 and stages 3 and 4, respectively. In
NAVA, the trig ger delay remained stable during stage 1
and during stages 3 and 4. The expiratory trigger also
remained stable in NAVA, during stage 1 and during
stages 3 and 4. NAVA allows optimizing the neurome-
chanical coupling and therefore patient-ventilator syn-
chrony [33] and allows for optimized adequacy between
ventilatory load and patient breathing ability, thereby
providing beneficial effects on sleep in ICU patients. It
appeared to us that the EAdi tracing is much more effi-
cient than flow and pressure tracings to detect
asynchronies.
Our study has some limitations; one is the open space
between patients. This studyincludedonly14patients,
which could favor the possibility of a type II error.
Patients’ heterogeneity implies that patients required
bedside care, such as suctioning or other care, which
could perhaps influence sleep fragmentation. The study
by Cabello found that suctioning was associated with <
1% arousals and awakenings [19]. The choice for a 15-
second interval betwee n asynchrony and the occurrence
of arousal was chosen based on one previous study on
thesametopic[19].Literatureonthisspecifictime
interval to choose is very scarce. In one study, it was
shown that the breathing response to a complete airway
occlusion was 20.4 ± 2.3 sec during NREM and 6.2 ±
1.2 sec during REM [34]. The choice of a 15-second
interval seems very reasonable but may need further
investigation.
In a sleep laboratory, it is a lot easier to control the
baseline ambient noise level. In a clinical environment,
such as an ICU, we recorded the average baseline ambi-
ent noise level and evaluated arousals from this baseline
to a peak noise level ≥10 dB above ambient noise level.
There is therefore a potential for statistical inaccuracies.
The fact that we stopped sedation 24 hours before
beginning the study does not imply an absence of
cumulative sedation. However, every patient had a Ram-
sayScoreof2orlessandaGlasgowScoreof11(the
maximum score for an intubated patient).
Conclusions
The ventilatory mode NAVA improves the quality of
sleep by increasing the slow-wave sleep and REM and
by decreasing fragmentation. NAVA improves pat ient
comfort through better neuromechanical coupling dur-
ing N-REM sle ep, by a shorter trigger delay, and more
efficient expiratory triggering. To minimize sleep frag-
mentation, optimal setting of pressure support level and
expiratory trigger are paramount in PSV. However, pro-
portional assistance modes of ventilation according to
patient inspiratory effort, such as NAVA, appear to be a
better choice to minimize sleep fragmentation.
Author details
1
Service des soins intensifs, Hôpital du Sacré-Cœur de Montréal, Montréal,
Québec, Canada
2
Département de médecine familiale et d’urgence,
Université de Montréal, Montréal, Québec, Canada
3
Département des
sciences cliniques, Université de Sherbrooke, Sherbrooke, Québec, Canada
4
Département de chirurgie, Centre hospitalier universitaire de Sherbrooke,
Sherbrooke, Québec, Canada
5
Service des soins intensifs, Hôpital régional
d’Edmundston, réseau de santé Vitalité, Edmundston, Nouveau-Brunswick,
Canada
Authors’ contributions
SD and PO drafted the manuscript, and PB, JPT, and PA revised the
manuscript.
Competing interests
The authors declare that they have no competing interests.
Received: 17 May 2011 Accepted: 28 September 2011
Published: 28 September 2011
References
1. Drouot X, Cabello B, d’Ortho MP, et al: Sleep in the intensive care unit.
Sleep Med Rev 2008, 12:391-403.
2. Frie se RS: Sleep and recovery from illness and injury: a review of
theory, curren t practice, and future directions. Crit Care Med 2008,
36:697-705.
3. Gabor JY, Cooper AB, Crombach SA, et al: Contribution of the Intensive
Care Unit Environment to sleep disruption in mechanically ventilated
patients and healthy subjects. Am J Respir Crit Care Med 2003,
167:708-715.
4. Bryant PA, Trinde J, Curtis N: Sick and tired: Does sleep have a vital role
in the immune system? Nat Rev Immunol 2004, 4:457-467.
Delisle et al. Annals of Intensive Care 2011, 1:42
/>Page 7 of 8
5. Valente M, Placidi F, Oliveira AJ, et al: Sleep organization pattern as a
prognostic marker at the subacute stage of posttraumatic coma. Clin
Neurophysiol 2002, 113:1798-1805.
6. Helton MC, Gordon SH, Nunnery SL: The correlation between sleep
deprivation and the intensive care unit syndrome. Heart Lung 1980,
9:464-468.
7. Chen HI, Tang YR: Sleep loss impairs inspiratory muscle endurance. Am
Rev Respir Dis 1989, 140:907-909.
8. Andrews P, Azoulay E, Antonelli M, et al: Year in review in intensive care
medicine 2004. Part I. Respiratory failure, infection and sepsis. Intensive
Care Med 2005, 31:28-40.
9. Andrews P, Azoulay E, Antonelli M, et al: Year in review in intensive care
medicine 2005. Part II. Acute respiratory failure and acute lung injury,
ventilation, hemodynamics, education renal failure. Intensive Care Med
2006, 32:207-216.
10. Aaron JN, Carlisle CC, Carskadon MA, et al: Environmental noise as a cause
of sleep disruption in an intermediate respiratory care unit. Sleep 1996,
19:707-710.
11. Freedman NS, Gazendam J, Levan L, et al: Abnormal sleep/wake cycles
and the effect of environmental noise on sleep disruption in the
intensive care unit. Am J Respir Med 2001, 163:451-457.
12. Hilton BA: Quantity and quality of patients’ sleep and sleep-disturbing
factors in a respiratory intensive care unit. J Adv Nurs 1976, 1:453-468.
13. Cooper AB, Thornley KS, Young GB, et al: Sleep in critically ill patients
requiring mechanical ventilation. Chest 2000, 117:809-818.
14. Freedman NS, Kotzer N, Schwab RJ: Patient perception of sleep quality
and etiology of sleep disruption in the intensive care unit. Am J Respir
Crit Care Med 1990, 159:1155-1162.
15. Parthasarathy S, Tobin MJ: Effect of ventilator mode on sleep quality in
critically ill patients. Am J Respir Crit Care Med 2002, 166:1423-1429.
16. Nakayama H, Smith CA, Rodman JR, et al: Effect of ventilatory drive on
carbon dioxide sensitivity below eupnea during sleep. Am J Respir Crit
Care Med
2002, 165:1251-1260.
17. Thille AW, Rodriguez P, Cabello B, et al: Patient-ventilator asynchrony
during assisted mechanical ventilation. Intensive Care Med 2006,
32:1515-1522.
18. Fanfulla F, Delmastro M, Berardinelli A, et al: Effects of different ventilator
settings on sleep and inspiratory effort in patients with neuromuscular
disease. Am J Respir Crit Care Med 2005, 172:619-624.
19. Cabello B, Thille AW, Drouot X, et al: Sleep quality in mechanically
ventilated patients: comparison of three ventilatory modes. Crit Care Med
2008, 36:1749-1755.
20. Jasper HH: The ten twenty electrode system of the International
Federation. Electroencephal Clin Neurophysiol 1958, 10:371-375.
21. Rechtschaffen A, Kales A: A manual of standardized terminology,
techniques and scoring system for sleep stages of human subjects. Los
Angeles, UCLA BIS/BRI; 1968.
22. Iber C, Ancoli-Israel S, Chesson A, et al: The AASM manual for the scoring
of sleep and associated events: rules, terminology and technical
specifications, 1st ed. Westchester, Illinois. American Academy of Sleep
Medicine; 2007.
23. EEG arousals, Scoring rules and examples: A preliminary report from the
Sleep Disorders Atlas Task Force of the American Sleep Disorders
Association. Sleep 1992, 15:173-184.
24. Force TRoaAAoSMT: Sleep-related breathing disorders in adults:
Recommendation for syndrome definition and measurement techniques
in clinical research. Sleep 1999, 22:667-689.
25. Xie A, Wong B, Phillipson EA, et al: Interaction of hyperventilation and
arousal in the pathogenesis of idiopathic central sleep apnea. Am J
respire Crit Care Med 1994, 150:489-495.
26. Trinder J, Merson R, Rosenberg JI, et al: Pathophysiological interactions of
ventilation, arousals, and blood pressure oscillations during Cheyne-
Stokes respiration in patients with heart failure. Am J Respir Crit Care Med
2000, 162:808-813.
27. Toublanc B, Rose D, Glerant JC, et al: Assist-control ventilation vs. low
levels of pressure support ventilation on sleep quality in intubated ICU
patients. Intensive Care Med 2007, 33:1148-1154.
28. Brochard L, Pluskwa F, Lemaire F: Improved efficacy of spontaneous
breathing with inspiratory pressure support. Am Respir Dis 1987,
136:411-415.
29. Leleu O, Mayeux I, Journieaux V:
Effets de l’adjonction d’une aide
inspiratoire de 6 cmH2O sur la consummation en oxygène des muscles
respiratoires au cours du sevrage de la ventilation mécanique. Rev Mal
Respir 2001, 18:283-288.
30. Tassaux D, Gainnier M, Battisti A, et al: Impact of expiratory trigger setting
on delayed cycling and inspiratory muscle workload. Am J Respir Crit Care
Med 2005, 172:1283-1289.
31. Bosma K, Ferreyra G, Ambrogio C, et al: Patient-ventilator interaction and
sleep in mechanically ventilated patients: pressure support versus
proportional assist ventilation. Crit Care Med 2007, 35:1048-1054.
32. Thille AW, Rodriguez P, Cabello B, et al: Patient-ventilator asynchrony
during assisted mechanical ventilation. Intensive Care Med 2006,
32:1515-1522.
33. Schmidt M, Demoule A, Crasso C, et al: Neurally adjusted ventilatory assist
increases respiratory variability and complexity in acute respiratory
failure. Anesthesiology 2010, 112:670-681.
34. Issa FG, Sullivan CE: Arousal and breathing responses to airway occlusion
in healthy sleeping adults. J Appl Physiol 1983, 55:1113-1119.
doi:10.1186/2110-5820-1-42
Cite this article as: Delisle et al.: Sleep quality in mechanically ventilated
patients: comparison between NAVA and PSV modes. Annals of Intensive
Care 2011 1:42.
Submit your manuscript to a
journal and benefi t from:
7 Convenient online submission
7 Rigorous peer review
7 Immediate publication on acceptance
7 Open access: articles freely available online
7 High visibility within the fi eld
7 Retaining the copyright to your article
Submit your next manuscript at 7 springeropen.com
Delisle et al. Annals of Intensive Care 2011, 1:42
/>Page 8 of 8