Báo cáo hóa học: " Band alignment and enhanced breakdown field of simultaneously oxidized and nitrided Zr film on Si" doc
Bạn đang xem bản rút gọn của tài liệu. Xem và tải ngay bản đầy đủ của tài liệu tại đây (358.14 KB, 5 trang )
NANO EXPRESS Open Access
Band alignment and enhanced breakdown field
of simultaneously oxidized and nitrided Zr film
on Si
Yew Hoong Wong and Kuan Yew Cheong
*
Abstract
The band alignment of ZrO
2
/interfacial layer/Si structure fabricated by simultaneous oxidation and nitridation of
sputtered Zr on Si in N
2
O at 700°C for different durations has been established by using X-ray photoelectron
spectroscopy. Valence band offset of ZrO
2
/Si was found to be 4.75 eV, while the highest corresponding conduction
offset of ZrO
2
/interfacial layer was found to be 3.40 eV; owing to the combination of relatively larger bandgaps, it
enhanced electrical breakdown field to 13.6 MV/cm at 10
-6
A/cm
2
.
Keywords: oxidation, sputtered-Zr, nitrous oxide, band alignment, electrical breakdown field
Background
Application of high dielectric constant () materials as
futur e gate dielectrics on Si-based metal oxide semicon-
ductor (MOS) devices has driven a tremendous research
to realize an ultra-large-scale integrated circuitry with
high performance and low power consumption [1-3]. Of
various investigated high materials, ZrO
2
is being con-
sidered as a potential gate dielectric for the near future
generation technology nodes. It has been reported that
excellent electrical properties of MOS capacitors that
incorporated ZrO
2
thin film as gate dielectric [4,5]. Put-
konen et al. [5] and Niinisto et al. [4] have obtained the
breakdown fields of ZrO
2
at 6.0 and 9.5 MV/cm, respec-
tively, at leakage current density of 10
-2
A/cm
2
. In order
to attain excellent electrical properties of a device, inter-
face properties of dielectri c/Si play an indispensable role
[6,7]. The leakage characteristic and electrical break-
down field of gate dielectric are basically dependent on
the bandgap of the dielectric and on the band alignment
with Si [8,9]. Hence, to use ZrO
2
as gate dielectric in
MOS capacitors, it should have sufficiently high band
offsets with Si (> 1.00 eV) for both holes (vale nce band
offset) and electrons (conduction band offset), so that
an ultralow leakage current can be acquired [2,3].
Therefore, it is crucial to quantify these energy band off-
sets. Additionally, it is necessary to consider an interfa-
cial layer (IL) that is inevitably formed in between ZrO
2
and Si in the evaluation of band alignment. Works
along this direction were reported by a number of
researchers (Table 1). It is summarized that band align-
ment of the ZrO
2
/IL/Si system can be categorized into
two types, depending on the oxide deposition techniques
rather than the types (n or p) of semiconductor: type (i),
alignment of ZrO
2
bandgap in between the IL bandgap
[10-13] and type (ii), alignment of ZrO
2
conduction
band outside the IL bandgap [14]. In this work, using
simultaneous oxidation and nitridation of sputtered Zr
on n-type Si in N
2
O, alignment of Z rO
2
valence band
outside the IL bandgap has been revealed [type (iii) in
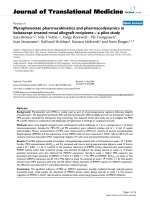
Table 1] (Figure 1). Owing to this type of alignment,
dielectric electric breakdown field at low leakage current
density has been enhanced.
Results and discussion
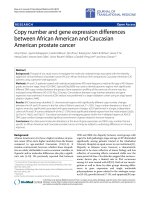
Figure 2a shows typical X-ray photoelectron spectro-
scopy (XPS) valence band spectra of ZrO
2
and IL for all
investigated samples. The valence band edges (E
v
)of
ZrO
2
and IL were estimated by an intercept of linear
extrapolation of a maximum negative slope near the
edge to the minimum horizontal baseline [10]. As a
result, valence band offsets (ΔE
v
)ofZrO
2
and IL with
* Correspondence:
Energy Efficient and Sustainable Semiconductor Research Group, School of
Materials and Mineral Resources Engineering, Universiti Sains Malaysia,
Engineering Campus, 14300 Nibong Tebal, Seberang Perai Selatan, Penang,
Malaysia
Wong and Cheong Nanoscale Research Letters 2011, 6:489
/>© 2011 Wong and Cheong; licensee Springer. This is an Open Access article distributed under the terms of the Creative Commons
Attribution License (http://c reativecommons.org/licenses/by/2.0), which permits unrestricted use, distribution, and rep roduction in
any medium, provided the original work is properly cited.
respect to Si substrate were 4.75 ± 0.05 eV a nd 3.75 ±
0.05 eV, respectively, for a ll investigated samples. To
determine conduction band offset (ΔE
c
)ofZrO
2
/IL/Si
system, the bandgaps (E
g
)ofZrO
2
and IL were first
deduced from O 1s plasmon loss spectra [15,16] of
ZrO
2
and IL, respectively. Figure 2b representa tively
demonstrates the XPS O 1s plasmon loss spectra of
ZrO
2
and IL for a 15-min sample. Whilst for other sam-
ples, the E
g
values of ZrO
2
and IL extracted from their
respective O 1s plasmon l oss spectra are shown in
Figure 3. As explained earlier, values of E
g
were also
approximated by an intercept of linear extrapolation.
The extracted E
g
values of ZrO
2
and IL were 6.20 to
Table 1 Comparison of the obtained values of E
g(ZrO2)
, E
g(IL)
, ΔE
v
, and ΔE
c
Type Deposition method E
g(ZrO2)
E
g(IL)
ΔE
v
ΔE
c
Reference
(i) Evaporation 5.50 8.60 1.00 1.90 [10]
Sputtering 5.40 7.60 1.00 1.20 [11]
Atomic layer chemical vapor deposition 5.80 7.60 1.15 1.05 [12]
Electron beam deposition of Zr + oxidation in O
2
5.80 9.00 1.80 1.40 [13]
(ii) PLD 5.70 4.70 3.30 to 3.50 1.50 [14]
(iii) Sputtering of Zr + oxidation and nitridation in N
2
O 6.20 to 6.50 8.20 to 8.80 4.75 3.40 This work
Type (i) defines alignment of ZrO
2
bandgap in between the IL bandgap and type (ii) defines alignment of ZrO
2
conduction band outside the IL bandgap. Type
(iii) defines ZrO
2
valence band outside the IL bandgap which is obtained from this work.
Figure 1 Band alignment of ZrO
2
/IL/Si system. E
g(ZrO2)
=
bandgap of ZrO
2
, E
g(IL)
= bandgap of IL, E
g(Si)
= bandgap of Si, ΔE
v
(ZrO2/Si)
= valence band offsets of ZrO
2
to Si, ΔE
v(IL/Si)
= valence band
offsets of IL to Si, ΔE
c(ZrO2/Si)
= conduction band offset of ZrO
2
to Si,
ΔE
c(IL/Si)
= conduction band offset of IL to Si, ΔE
c(ZrO2/IL)
=
conduction band offset of ZrO
2
to IL.
Figure 2 XPS valence band spectra of ZrO
2
and IL for all
investigated samples. (a) XPS valence band spectra of ZrO
2
and IL
for all investigated samples. (b) XPS O 1s plasmon loss spectra of
ZrO
2
and IL for 15-min sample.
Wong and Cheong Nanoscale Research Letters 2011, 6:489
/>Page 2 of 5
6.50 eV and 8.20 to 8.80 eV, respectively, with tolerance
of 0.05 eV, dependent on the oxidation time (Figure 3).
Ultimately, conduction band offset of ZrO
2
to IL, ΔE
c
(ZrO2/IL)
for the ZrO
2
/IL/Si system can be eventually
derived [17]:
E
c
(
ZrO2/IL
)
= E
g
(
IL
)
− E
v
(
IL/Si
)
+ E
v
(
ZrO2/Si
)
− E
g(ZrO2)
,
(1)
where, E
g(ZrO2)
and E
g(IL)
are the bandgaps of ZrO
2
and IL, respectively. ΔE
v(ZrO2/Si)
and ΔE
v(IL/Si)
are the
valence band offsets of ZrO
2
and IL, respectively, with
respect to Si substrate. The calculated values of E
g(ZrO2)
,
E
g(IL)
, ΔE
c(ZrO2/Si)
, ΔE
c(IL/Si)
,andΔE
c(ZrO2/IL)
are pre-
sented in Figure 3. The highest value of ΔE
c(ZrO2/IL)
, i.e.,
3.40 eV, was attained by sample oxidized/nitrided for
15 min (Figure 3) when compared to other samples. A
schematic of t he band alignment of the ZrO
2
/IL/Si sys-
tem is illustrated in Figure 1. The E
g
value of Si sub-
strate is obtained from literature [3,18]. It is found that
values of E
g(ZrO2)
, E
g(IL)
, ΔE
c
,andΔE
v
obtained in this
study are higher than the values reported in literatures
(Table 1).
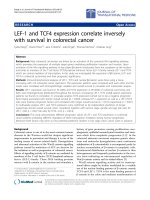
Figure 4 shows typical leakage current density electric
field (J-E) characteristics of the investigated samples.
The J-E plot was transformed from current-voltage (I-V)
measurement. The E value was estimated by first deter-
mining the flatband voltage (V
FB
) shift from the applied
gate voltage (V
g
) and then dividi ng the total thicknesses
of ZrO
2
and IL (t
ox
) measured by energy filtered trans-
missionelectronmicroscopy(EFTEM)(imagesarenot
shown here). The acquired J value in this study is ~10
-
8
A/cm
2
at E = 2.0 MV/cm, which is lower than the
other studies [4,5,14].
A two-step oxide breakdown (BK-1 and BK-2) is being
recorded in the J-E plot for all investigated samples
(inset of Figure 4). The existence of interfacial and ZrO
2
layers in the sample is the main cause of this two-step
breakdown [19]. The breakdowns can be explained as
follows. One of the layers may experience an electrical
breakdown at a lower f ield, which is labeled as BK-1.
Subsequently, another layer would block the carriers.
Due to the increment of the electric field, the c oncen-
tration of the carrier inc reases until the layer is electri-
cally broken down at a higher electric field at BK-2. The
instantaneous increment of leakage current density at
BK-1 is relatively small when compared with others, and
it is defined as soft breakdown. The magnitude of BK-1
increases gradually as the o xidation time is increased
(inset of Figure 4). In contrast, the instantaneous incre-
ment of current density at BK-2 is large, and this is con-
sidered as hard breakdown. The highest dielectric
breakdown field, which is referred to as hard break-
down, is attained by sample oxidized/nitride for 15 min
(13.6 MV/cm at 10
-6
A/cm
2
). The lowest one is
recorded by sample oxidized/nitride for 10 min (4.8
MV/cm at 10
-6
A/cm
2
). In comparison, dielectric b reak-
down field recorded in this work is higher than t he pre-
vious reported works [4,5,14].
Conclusions
In summary, the band alignment of ZrO
2
/IL/Si structure
produced by simultaneous oxidation and nitridation of
sputtered Zr thin film on Si in N
2
O has been estab-
lished . Via this method, higher ΔE
c
and ΔE
v
values have
been attained. Hence, a higher electrical breakdown field
at low leakage current density has been achieved.
Methods
The n-type Si(100) substrate with a resistivity of 1 to
10 Ω cmwasusedinthisstudy.Afterundergoinga
Figure 3 E
g
values of ZrO
2
and IL extracted from their
respective O 1s plasmon loss spectra. The calculated values of E
g
(ZrO2)
, E
g(IL)
, ΔE
c(ZrO2/Si)
, ΔE
c(IL/Si)
, and ΔE
c(ZrO2/IL)
in the band alignment
of ZrO
2
/IL/Si system.
Figure 4 J-E characteristics of the investigated Al/ZrO
2
/IL/Si
MOS capacitors. Inset shows the average breakdown fields (BK-1
and BK-2) for the investigated samples.
Wong and Cheong Nanoscale Research Letters 2011, 6:489
/>Page 3 of 5
standard wafers cleaning process, a 5-nm thick Zr film
was sputtered on t he cleaned Si substrates by an RF
sputtering system. Follow ing that, samples were loaded
intoahorizontaltubefurnaceandwereheatedup
from room temperature to 700°C in an Ar flow ambi-
ent, and the heating rate was fixed at 10°C/min. Once
the set temperature was achieved, N
2
Ogaswasintro-
duced with a flow rate of 150 mL/min for a set of
durations (5, 10, 15, and 20 min). After the furnace
was cooled down to room temperature in an Ar ambi-
ent, the samples were withdrawn from the furnace. To
experimentally determine band alignment of the
dielectric/semiconductor structure, XPS measurements
were conducted using Kratos Axis Ultra DLD (Kratos
Analytical, Chestnut Ridge, NY, USA). with a mono-
chromatic Al-K
a
X-raysource(hν = 1,486.69 eV)
performed at the Research Center for Surface and
Materials Science, The Auckland University, New
Zealand. The spectra of survey or wide scan (binding
energy of -5 to 25 eV) were collected at a take off
angle of 0° with respect to surface normal, with low
pass energy of 20 eV and small step size of 0.1 eV.
Duetotheonsetofsingleparticleexcitationand
band-to-band transition, the energy loss spectrum of O
1s photoelectron provides further insight on the band-
gaps of ZrO
2
and IL [20]. Subsequently, a detail scan
of O 1 s was carried out using the same pass energy
and step size of 1.0 eV. Ar ion gun (5 keV) was
employed to etch the sample in o rder to perform che-
mical depth profiling (results are not shown here), in
order for the boundary of ZrO
2
and IL to be identified.
A Shirley background function, which is proportional
to the i ntegrated photoelectron peak area, was sub-
tracted from all of the XPS spectra to correct for the
inelastic photoelectron scattering effect [21]. Band
alignment extraction was based on Kraut method
[15,16]. As to characterize the leakage characteristic
and electrical bre akdown field of the film, MOS capaci-
tor test structure was formed by thermally evaporated a
100-nm thick aluminum (Al) film, acting as a gate elec-
trode, on top of the films. The area of a capacitor was
photolithographically defined at 9 × 10
-4
cm
2
.Inorder
to obtain an Ohmic back contact, a 100-nm thick Al
film was thermally evaporated on the backside of the Si
substrate after removal of native oxide. I-V measure-
ments were performed by a computer-contro lled Agi-
lent HP4155-6C semiconductor parameter analyzer
(Agilent Technologies, Santa Clara, CA, USA).
Acknowledgements
The authors would like to acknowledge the support provided by USM
fellowship, USM-RU-PRGS (8032051), and The Academy of Sciences for the
Developing World (TWAS) through the TWAS-COMSTECH researc h grant (09-
105 RG/ENG/AS_C) during the study.
Authors’ contributions
YHW has been involved in the experimental design, data acquisition, data
interpretation and analysis, and drafting and revision of the manuscript. KYC
has been involved in revising the manuscript critically for important
intellectual content and has given final approval to the version to be
submitted for publication.
Competing interests
The authors declare that they have no competing interests.
Received: 11 April 2011 Accepted: 10 August 2011
Published: 10 August 2011
References
1. Robertson J: High dielectric constant oxides. Eur Phys J Appl Phys 2004,
28:265-291.
2. Wilk GD, Wallace RM, Anthony JM: High-k gate dielectrics: current status
and materials properties considerations. J Appl Phys 2001, 89:5243-5275.
3. Wong YH, Cheong KY: ZrO
2
thin films on Si substrate. J Mater Sci: Mater
Electron 2010, 21:980-993.
4. Niinisto J, Putkonen M, Niinisto L, Kukli K, Ritala M, Leskela M: Structural
and dielectric properties of thin ZrO
2
films on silicon grown by atomic
layer deposition from cyclopentadienyl precursor. J Appl Phys 2004,
95:84-91.
5. Putkonen M, Niinistö J, Kukli K, Sajavaara T, Karppinen M, Yamauchi H,
Niinistö L: ZrO
2
thin films grown on silicon substrates by atomic layer
deposition with Cp
2
Zr(CH
3
)
2
and water as precursors. Chem Vap Dep
2003, 9:207-212.
6. Aygun G, Yildiz I: Interfacial and structural properties of sputtered HfO
2
layers. J Appl Phys 2009, 106:014312-014317.
7. Weinreich W, Ignatova VA, Wilde L, Teichert S, Lemberger M, Bauer AJ,
Reiche R, Erben E, Heitmann J, Oberbeck L, Schroder U: Influence of N
2
and NH
3
annealing on the nitrogen incorporation and k-value of thin
ZrO
2
layers. J Appl Phys 2009, 106:034107-034107.
8. Chen Q, Feng YP, Chai JW, Zhang Z, Pan JS, Wang SJ: Band alignment and
thermal stability of HfO
2
gate dielectric on SiC. Appl Phys Lett 2008,
93:052104-052103.
9. Yim CJ, Ko DH, Jang MH, Chung KB, Cho MH, Jeon HT: Change in band
alignment of HfO
2
films with annealing treatments. Appl Phys Lett 2008,
92:012922-012923.
10. Miyazaki S: Characterization of high-k gate dielectric/silicon interfaces.
Appl Surf Sci 2002, 190:66-74.
11. Houssa M, Tuominen M, Naili M, Afanas’ev V, Stesmans A, Haukka S,
Heyns MM: Trap-assisted tunneling in high permittivity gate dielectric
stacks. J Appl Phys 2000, 87:8615-8620.
12. Afanas’ev VV, Houssa M, Stesmans A, Heyns MM: Band alignments in
metal-oxide-silicon structures with atomic-layer deposited Al
2
O
3
and
ZrO
2
. J Appl Phys 2002, 91:3079-3084.
13. Fulton CC, Cook JTE, Lucovsky G, Nemanich RJ: Interface instabilities and
electronic properties of ZrO
2
on silicon (100). J Appl Phys 2004,
96:2665-2673.
14. Yamaguchi T, Satake H, Fukushima N: Band diagram and carrier
conduction mechanisms in ZrO
2
MIS structures. IEEE Trans on Electron
Devices 2004, 51:774-779.
15. Kraut EA, Grant RW, Waldrop JR, Kowalczyk SP: Precise determination of
the valence band edge in x-ray photoemission spectra: application to
measurement of semiconductor interface potentials. Phys Rev Lett 1980,
44:1620.
16. Kraut EA, Grant RW, Waldrop JR, Kowalczyk SP: Semiconductor core-level
to valence band maximum binding-energy differences: precise
determination by x-ray photoelectron spectroscopy. Phys Rev B 1983,
28:1965.
17. Zhu LQ, Zhang LD, Li GH, He G, Liu M, Fang Q: Thermal stability and
energy-band alignment of nitrogen-incorporated ZrO
2
films on Si(100).
Appl Phys Lett 2006, 88:232901-232903.
18. Muller RS, Kamins TI: Device Electronics for Integrated Circuits , 2 1986, 54.
19. Xiaolong Y, Qianghua X, Tao M: Electrical breakdown in a two-layer
dielectric in the MOS structure. Mat Res Soc Symp Proc 2004, 811:D2.8.1.
20. Miyazaki S, Nishimura H, Fukuda M, Ley L, Ristein J: Structure and
electronic states of ultrathin SiO
2
thermally grown on Si(100) and Si
(111) surfaces. Appl Surf Sci 1997, 113-114:585-589.
Wong and Cheong Nanoscale Research Letters 2011, 6:489
/>Page 4 of 5
21. Shirley DA: High-resolution x-ray photoemission spectrum of the valence
bands of gold. Phys Rev B 1972, 5:4709.
doi:10.1186/1556-276X-6-489
Cite this article as: Wong and Cheong: Band alignment and enhanced
breakdown field of simultaneously oxidized and nitrided Zr film on Si.
Nanoscale Research Letters 2011 6:489.
Submit your manuscript to a
journal and benefi t from:
7 Convenient online submission
7 Rigorous peer review
7 Immediate publication on acceptance
7 Open access: articles freely available online
7 High visibility within the fi eld
7 Retaining the copyright to your article
Submit your next manuscript at 7 springeropen.com
Wong and Cheong Nanoscale Research Letters 2011, 6:489
/>Page 5 of 5