Electric Machines and Drives part 11 docx
Bạn đang xem bản rút gọn của tài liệu. Xem và tải ngay bản đầy đủ của tài liệu tại đây (2.09 MB, 20 trang )
Swarm Intelligence Based Controller for
Electric Machines and Hybrid Electric Vehicles Applications
189
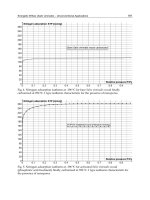
(c) The mass of the FC/SC components
(d) The mass of the FC/SC components
Fig. 19. The Comparative of the optimal design between different methods for FC/SC HEV
4.3 Optimal Power Control (OPC)
The second goal of the PSO is to minimize the vehicle fuel, hydrogen, consumption while
maintaining the supercapacitor state of charge. As a hybrid powertrain is under
consideration, a power management strategy is required to define what both the FC and SC
powers are. The global optimization algorithms, such as GA and dynamic programming
(DP), achieve an optimal power control for FC/SC hybrid electric vehicle, which leads to the
lowest hydrogen consumption and maintains the supercapacitor SOC [Sinoquet et. al 2009;
Sundstrom & Stefanopoulou 2006].
In this study, the optimal power control can be achieved by using PSO and GA for a given
driving cycle. Suppose that the degree of hybridization of the fuel cell is K
fc
at time t and
K
soc
, Proportional controller gain, which used to adapt the SOC during charging from the
FC. A balance equation can naturally be established, since the sum of power from both
sources has to be equal to the required power at all times:
Electric Machines and Drives
190
)()()( tPsctPfct
req
P
+
=
(70)
)(
)(
)(
t
req
P
tPfc
tKfc =
(71)
The net energy consumed from the FC at time t can be computed as follows:
∫
=
t
dt
tPfc
tPfc
tEfc
0
))((
)(
)(
η
(72)
The cost function can be expressed as follows:
∑
=
Δ=
N
K
T
k
Opti
Pfc
k
Opti
Pfc
Elow
xF
0
))((
)(
1
)(
2
η
(73)
The Optimal fuel cell power output, P
fcOpti
, is calculated based on the SOC of the
supercapacitor and power demand, P
req
, as follows:
⎥
⎥
⎦
⎤
⎢
⎢
⎣
⎡
−
−
−+=
2/)
minmax
(
)(
)
minmax
()()()()(
SOCSOC
kSOC
ref
SOC
PfcPfckKsock
req
PkKfckPfc
Opti
(74)
Fig. 20. The block diagram of the Optimal power Control
Where: N= T/ΔT is number of samples during the driving cycle, and ΔT=1s is the sampling
time.
The block diagram of the optimal power control based on optimization algorithm is shown
in Fig.20.
Based on minimizing the objective function F
2
(x) in (73), the results of the optimal power
sharing based PSO and the comparative study for the FC/SC powertrain are summarized in
Fig.21 [Hegazy et. al 2010].
Swarm Intelligence Based Controller for
Electric Machines and Hybrid Electric Vehicles Applications
191
(a) The power sharing between FC and SC on NEDC driving cycle
(b) The power sharing between FC and SC on FTP75 driving cycle
Electric Machines and Drives
192
(c) The Comparative of the hydrogen consumption between control strategies
(d) The Hydrogen improvements with respect to pure fuel cell without SC
Fig. 21. The results of the optimal power Control for FC/SC
Swarm Intelligence Based Controller for
Electric Machines and Hybrid Electric Vehicles Applications
193
5. Conclusion
This chapter deals with the applicability of swarm intelligence (SI) in the form of particles
swarm optimization (PSO) used to achieve the best performance for the electric machines
and electric drives. In addition, by analyzing and comparing the results, it is shown that
control strategy based on PSO is more efficient than others control strategies to achieve the
optimal performance for fuel cell/supercapacitor hybrid electric vehicles (FCHEV).
It is very important to note that, these applications were achieved without any additional
hardware cost, because the PSO is a software scheme. Consequently, PSO has positive
promises for a wide range of variable speed drive and hybrid electric vehicles applications.
6. Index I
List of principal symbols
ω
e
: synchronous speed
ω
r
: rotor speed
p : differential operator
r
m
, r
a
: main, auxiliary stator windings resistance
r
r
: rotor winding resistance
R
feq,d
: equivalent iron-loss resistance(d and q axis)
L
lm
,L
la
: main, auxiliary stator leakage inductance
L
md
,L
m q
: magnetizing inductance (d& q axis)
L
lr
: rotor leakage inductance
K : turns ratio auxiliary/main windings
T
e
: electromagnetic torque
J : inertia of motor
λ
ds,qs
: stator flux(d and q axis)
λ
dr,qr
: rotor flux(d and q axis)
V
ds,qs
: stator voltage (d and q axis)
i
ds,qs
: stator current (d and q axis)
M : mutual inductance
7. References
Amin. A. M. A., Korfally. M. I., Sayed. A. A. and Hegazy. O.T. M., (2009), Efficiency
Optimization of Two Asymmetrical Windings Induction Motor Based on Swarm
Intelligence, IEEE Transactions on Energy Conversion, Vol. 24, No. 1, March
2009
Amin. A. M. A., Korfally. M. I., Sayed. A. A. and Hegazy. O.T. M., (2006), Losses
Minimization of Two Asymmetrical Windings Induction Motor Based on Swarm
Intelligence, Proceedings of IEEE- IECON 06 , pp 1150 – 1155, Paris , France , Nov.
2006 .
Amin. A. M. A., Korfally. M. I., Sayed. A. A. and Hegazy. O.T. M., (2007), Swarm
Intelligence-Based Controller of Two-Asymmetrical Windings Induction Motor,
accepted for IEEE. EMDC07, pp 953 –958, Turkey, May 2007.
Eberhart. R, Kennedy. J, (1995), A New Optimizer Using Particles Swarm Theory, Proc.
Electric Machines and Drives
194
Sixth International Symposium on Micro Machine and Human Science (Nagoya,
Japan), IEEE Service Center, Piscataway, NJ, pp. 39-43,
A. Hamid Radwan H., Amin Amr. M. A., Ahmed Refaat S., and El-Gammal Adel A. A.
,(2006), New Technique For Maximum Efficiency And Minimum Operating Cost
Of Induction Motors Based On Particle Swarm Optimization (PSO)”, Proceedings
of IEEE- IECON 06 , pp 1029 – 1034, Paris , France , Nov. 2006.
Hegazy Omar, (2006), Losses Minimization of Two Asymmetrical Windings Induction
Motor Based on Swarm Intelligence, M.Sc., Helwan University, 2006.
Hegazy Omar, and Van Mierlo Joeri, (2010), Particle Swarm Optimization for Optimal
Powertrain Component Sizing and Design of Fuel cell Hybrid Electric Vehicle, 12th
International Conference on Optimization of Electrical and Electronic Equipment,
IEEE OPTIM 2010
Hegazy Omar, Van Mierlo Joeri, Verbrugge Bavo and Ellabban Omar, (2010), Optimal
Power Sharing and Design Optimization for Fuel Cell/Battery Hybrid Electric
Vehicles Based on Swarm Intelligence, The 25th World Battery, Hybrid and Fuel
Cell Electric Vehicle Symposium & Exhibition © EVS-25 Shenzhen, China, Nov. 5-9,
2010.
Kennedy. J and Eberhart .R, (2001), Swarm Intelligence, Morgan Kaufmann Publishers, Inc.,
San Francisco, CA
Kioskeridis, I; Margaris, N., (1996), Losses minimization in scalar-controlled induction
motor drives with search controllers" Power Electronics, IEEE Transactions,
Volume: 11, Issue: 2, March 1996 Pages: 213 – 220
Popescu. M, Navrapescu. V, (2000) ,A method of Iron Loss and Magnetizing Flux
Saturation Modeling in Stationary Frame Reference of Single and Two –Phase
Induction Machines”, IEE 2000, Conf. power Elec. & Variable Speed Drives, 140-
146
Sundstrom Olle and Stefanopoulou Anna, (2006), Optimal Power Split in Fuel Cell Hybrid
Electric Vehicle with different Battery Sizes, Drive Cycles, and Objectives,
Proceedings of the 2006 IEEE International Conference on Control Applications
Munich, Germany, October 4-6, 2006.
Van Mierlo Joeri, Cheng Yonghua, Timmermans Jean-Marc and Van den Bossche Peter,
(2006), Comparison of Fuel Cell Hybrid Propulsion Topologies with Super-
Capacitor, IEEE, EPE-PEMC 2006, Portorož, Slovenia
Wu Ying, Gao Hongwei, (2006) ,Optimization of Fuel Cell and Supercapacitor for Fuel-Cell
Electric Vehicles, IEEE Transactions On Vehicular Technology, Vol. 55, No. 6,
November 2006.
10
Operation of Active Front-End Rectifier in
Electric Drive under Unbalanced Voltage Supply
Miroslav Chomat
Institute of Thermomechanics AS CR, v.v.i.
Czech Republic
1. Introduction
Non-standard conditions in the power network such as voltage unbalance can negatively
affect operation of electric drives. The unbalance can be caused by a failure in the network
or by an unbalanced load in the electric vicinity of the affected drive. Unsymmetrical
voltages at the input of a voltage source inverter cause pulsations in the DC link voltage
when not properly taken care of. This may result in significantly reduced power capabilities
and, therefore, limited controllability of the drive. This text deals with the effects of
unbalanced voltage supply on the DC-link voltage pulsations, methods to address this
problem and the additionally imposed constraints in operating regions of the rectifier.
2. Control method
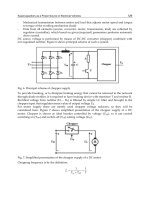
A simplified scheme of the drive under investigation is shown in Fig. 1. The front-end
controlled rectifier is connected to the mains through input filter inductors. The output
current of the rectifier supplies the DC current to the output inverter and maintains the
voltage across the DC-link capacitors constant at the same time. The value of this current
can be controlled by suitable switching of solid-state elements in the front-end stage.
i
B
V
A
V
B
V
A
L
L
L
C
DC
M
front end DC bus inverter electric
machine
input
impedance
power
network
C
DC
i
DC
i
A
i
C
V
DC
V
DC
R
R
R
0
V
0
N
V
N
Fig. 1. Scheme of system under investigation.
Suitable control of the front-end AC/DC converter can be employed in order to draw
constant input power from the power network even at unbalanced voltage supply
Electric Machines and Drives
196
(Stankovic & Lipo, 2001; Lee et al., 2006; Cross et al., 1999; Song & Nam, 1999). The
switching functions for the front-end AC/DC converter are generated so that a constant
voltage across the DC bus is maintained. Series combinations of inductance and resistance
are considered at the input terminals of the inverter.
The system can be electrically described by the following set of ordinary differential
equations (Chomat & Schreier, 2005):
0
0
A
AASAN
di
vL Riv vv
dt
−
−−+−=
, (1)
0
0
B
BBSBN
di
vL Riv v v
dt
−
−−+−=
, (2)
0
0
C
CCSCN
di
vL Riv v v
dt
−
−−+−=
, (3)
where
SA A DC
vsV
=
⋅ , (4)
SB B DC
vsV=⋅ , (5)
SC C DC
vsV
=
⋅ (6)
are the voltages at the input of the inverter. The functions s
A
, s
B
, and s
C
are the
corresponding unit switching functions of the particular phases of the front-end stage,
which represent the fundamental harmonic components of the pulse width modulated
output. Sinusoidal switching functions with the nominal frequency are considered
throughout this paper, whereas the higher harmonics that would arise in a real power
converter are neglected in the calculation for simplification. V
DC
represents one half of the
overall DC-link voltage here. The voltage v
N
is the electric potential of the neutral of the
mains and v
0
is the electric potential of the centre point of the capacitor bank in the DC bus.
The DC-link current can be calculated from the phase currents and the switching functions
according to
()
1
2
DC A A B B C C
isisisi=++
. (7)
The coefficient ½ takes into account the fact that currents in both positive and negative
directions that flow through different current paths in the DC bus are produced by the
rectifier.
An unbalanced system of phase quantities can advantageously be represented by phasors of
positive and negative rotating sequences. It is not necessary to take zero-sequence quantities
into account here as no neutral wire is considered in the system and, therefore, no zero-
sequence current can develop. The resulting rotating vector of such a quantity may then be
written as
j
t
j
t
ee
ω
ω
−
=+
PN
xX X . (8)
Operation of Active Front-End Rectifier in Electric Drive under Unbalanced Voltage Supply
197
The subscripts P and N denote the positive and negative rotating sequences, respectively.
Based on these assumptions, (1) - (3) and (4) – (6) may be rewritten in phasor form as
(
)
0
DC
RjL V
ω
−
+−=
PPP
VIS, (9)
(
)
0
DC
RjL V
ω
−
−−=
NNN
VIS. (10)
The solution of (9) and (10) for positive and negative sequence currents is
DC
V
R
j
L
ω
−
=
+
PP
P
VS
I
, (11)
DC
V
R
j
L
ω
−
=
−
NN
N
VS
I
(12)
and the corresponding rotating vector of the input currents is therefore
j
t
j
t
ee
ω
ω
−
=+
PN
iI I
. (13)
Similarly, we can formally introduce a rotating vector of the switching functions
j
t
j
t
ee
ω
ω
−
=+
PN
sS S . (14)
Then the resulting instantaneous value of the current supplied into the DC link by the front-
end converter from (7) can be written in the vector form as
{}
13
Re
22
DC
i
=
⋅is
, (15)
where the bar over the symbol denotes the complex conjugate value. The term 3/2 appears
in (15) due to the transformation from rotating vector form to instantaneous quantities.
The resulting relation obtained after substituting (13) and (14) into (15) can be written as the
sum of two separate current components and given as
()
()
2
DC
DC t
DC avg
ii i
ω
=
+ , (16)
where
()
3
Re
4
DC DC
DC avg
VV
i
RjL RjL
ωω
⎧
⎫
−−
⎪
⎪
=+
⎨
⎬
+−
⎪
⎪
⎩⎭
PP NN
PN
VS V S
SS
, (17)
()
22
2
3
Re
4
j
t
j
t
DC DC
N
DC t
VV
iee
RjL RjL
ωω
ω
ωω
−
⎧
⎫
−−
⎪
⎪
=+
⎨
⎬
+−
⎪
⎪
⎩⎭
PP NN
P
VS V S
SS
. (18)
The first component, (17), represents a DC component and the second, (18), represents a
pulsating component with the frequency twice as high as that of the mains. The pulsating
component is only produced when the negative sequence of either the input voltages or the
switching functions is present.
Electric Machines and Drives
198
From (18), a condition for the elimination of the pulsating component in the DC link can be
derived
22
Re Re
j
t
j
t
DC DC
N
VV
ee
RjL RjL
ωω
ωω
−
⎧
⎫⎧ ⎫
−−
⎪
⎪⎪ ⎪
=−
⎨
⎬⎨ ⎬
+−
⎪
⎪⎪ ⎪
⎩⎭⎩ ⎭
PP NN
P
VS V S
SS
. (19)
As the real part of a complex number equals the real part of its conjugate value, (18) can also
be written as
22
Re Re
j
t
j
t
DC DC
N
VV
ee
RjL RjL
ωω
ωω
⎧
⎫⎧ ⎫
−−
⎪
⎪⎪ ⎪
=−
⎨
⎬⎨ ⎬
++
⎪
⎪⎪ ⎪
⎩⎭⎩ ⎭
PP NN
P
VS V S
SS
. (20)
For the above equation to be satisfied at any time, the following must hold providing that
there is non-zero input impedance
(
)
(
)
DC DC
VV−=−−
PP N NN P
VS S V S S. (21)
If the input voltages are known and the control is free to choose the positive sequence
component of the switching functions, the negative sequence of the switching functions
obtained from (21) is
2
DC
V
=
−
PN
N
PP
SV
S
SV
. (22)
It should be noted that the relation does not contain values of input resistance and
inductance and is, therefore, the same for pure inductance as well as for pure resistance
connected to the front end of the inverter.
As the amplitudes of the individual switching functions need to be less than or equal
to one, the range of practical combinations of S
P
and S
N
is constrained. A simple, and
rather conservative, condition to keep the switching functions in allowable limits can be
written as
1
+
≤
PN
SS . (23)
For more precise evaluation of the constraints, we need to evaluate magnitudes of switching
vectors in individual phases
A
=+
N
P
SSS, (24)
2
B
aa=+
N
P
SSS
, (25)
2
C
aa=+
N
P
SS S (26)
and limit the magnitude of each of them
(
)
(
)
(
)
111
ABC
≤
∧≤∧≤SSS. (27)
Operation of Active Front-End Rectifier in Electric Drive under Unbalanced Voltage Supply
199
For its operation, the above discussed control method requires to monitor the instantaneous
values of the input phase voltages and of the DC-link voltage. Based on this information, a
convenient combination of values of
S
P
and S
N
can be chosen to produce the required value
of the DC-link current and to satisfy the conditions in (22) and (23) at the same time. From
S
P
and S
N
, the switching functions for the individual legs of the rectifier are computed and
switching pulses are generated for individual switching devices based on a particular pulse
width modulation algorithm. The switching devices are considered to be transistors or
thyristors with forced commutation.
3. Operation of drive under unbalanced voltage supply
3.1 Numerical simulation of drive under unbalanced voltage supply
Operation of the described system has been numerically simulated under various types of
unbalanced voltage supply in order to investigate the effect of the unbalance on the system
behavior and the influence of certain circuit parameters. The reference parameters of the
input impedance were chosen to be R = 0.1
Ω and L = 10 mH. The input phase voltages had
nominal voltage amplitudes of 230 V, nominal frequency of 50 Hz, and mutual phase shifts
of 120° to form a three-phase voltage system in the case of the symmetrical system. The
DC-link voltage was set to 560 V and the capacitor of 1000 µF was used in the DC bus
(Chomat et al., 2007).
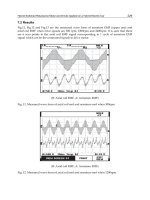
First, operation of the investigated system under symmetrical voltage supply was simulated
to obtain the reference case to compare with unbalanced operation. Figure 2 shows input
phase voltages and currents and Figure 3 shows the DC-link current and voltage. It can be
seen that both electrical quantities in the DC bus are smooth with no visible pulsations.
Fig. 2. Phase voltages and currents under symmetrical voltage supply.
Second, the unbalance caused by setting the magnitude of the voltage in phase A to
200 V
RMS
was investigated. Figures 4 and 5 show the corresponding quantities at the input of
the rectifier and in the DC bus when no measures are taken to eliminate the pulsations by
suitable modification of switching in the active front-end rectifier. The DC-link current and
voltage contain significant pulsations that would make control of the drive more
complicated. When the switching functions are modified in order to eliminate the effect of
the supply voltage unbalance, the pulsations are nearly entirely eliminated, Figures 6 and 7.
This has also an effect on the input phase currents compared to the previous case.
Electric Machines and Drives
200
0
10
20
30
40
i
DC
[A]
0 0.005 0.01 0.015 0.02
540
550
560
570
580
v
DC
[V]
time [s]
Fig 3. DC-link voltage and current under symmetrical voltage supply.
Fig 4. Phase voltages and currents under unbalanced voltage supply without compensation.
0
10
20
30
40
i
DC
[A]
0 0.005 0.01 0.015 0.02
540
550
560
570
580
v
DC
[V]
time [s]
Fig. 5. DC-link voltage and current under unbalanced voltage supply without
compensation.
Operation of Active Front-End Rectifier in Electric Drive under Unbalanced Voltage Supply
201
Fig. 6. Phase voltages and currents under unbalanced voltage supply with compensation.
0
10
20
30
40
i
DC
[A]
0 0.005 0.01 0.015 0.02
540
550
560
570
580
v
DC
[V]
time [s]
Fig. 7. DC-link voltage and current under unbalanced voltage supply with compensation.
When DC-link capacitor is reduced to have the capacity of only 500 µF instead of 1000 µF,
Figures 8 and 9, the DC-link voltage pulsations are increased twice as could be expected in
case with no measures to eliminate the effect of the unbalance in the front-end rectifier. No
change appears in the case when switching functions are modified to eliminate the effect of
the unbalance, Figures 10 and 11.
Fig. 8. Phase voltages and currents under unbalanced voltage supply with reduced DC-link
capacitance without compensation.
Electric Machines and Drives
202
0
10
20
30
40
i
DC
[A]
0 0.005 0.01 0.015 0.02
540
550
560
570
580
v
DC
[V]
time [s]
Fig. 9. DC-link voltage and current under unbalanced voltage supply with reduced DC-link
capacitance without compensation.
Fig. 10. Phase voltages and currents under unbalanced voltage supply with reduced DC-link
capacitance with compensation.
0
10
20
30
40
i
DC
[A]
0 0.005 0.01 0.015 0.02
540
550
560
570
580
v
DC
[V]
time [s]
Fig. 11. DC-link voltage and current under unbalanced voltage supply with reduced DC-
link capacitance with compensation.
The change of the input inductance from 10 mH to 5 mH leads to an adequate increase in
the input phase currents as well as in the DC-link current, Figures 12 to 15. The relative
amount of pulsations remain at about the same levels.
Operation of Active Front-End Rectifier in Electric Drive under Unbalanced Voltage Supply
203
Fig. 12. Phase voltages and currents under unbalanced voltage supply with reduced input
inductance without compensation.
0
10
20
30
40
i
DC
[A]
0 0.005 0.01 0.015 0.02
540
550
560
570
580
v
DC
[V]
time [s]
Fig. 13. DC-link voltage and current under unbalanced voltage supply with reduced input
inductance without compensation.
Fig. 14. Phase voltages and currents under unbalanced voltage supply with reduced input
inductance with compensation.
Electric Machines and Drives
204
0
10
20
30
40
i
DC
[A]
0 0.005 0.01 0.015 0.02
540
550
560
570
580
v
DC
[V]
time [s]
Fig. 15. DC-link voltage and current under unbalanced voltage supply with reduced input
inductance with compensation.
Finally, the unbalance caused by shifting the voltage phasor of phase A by 10° was
investigated. Corresponding results due to the changes in circuit parameters are illustrated
in Figures 16 to 27. It can be noted that the effects are similar to the previous case of
unbalance.
Fig. 16. Phase voltages and currents under unbalanced voltage supply without
compensation.
0
10
20
30
40
i
DC
[A]
0 0.005 0.01 0.015 0.02
540
550
560
570
580
v
DC
[V]
time [s]
Fig. 17. DC-link voltage and current under unbalanced voltage supply without
compensation.
Operation of Active Front-End Rectifier in Electric Drive under Unbalanced Voltage Supply
205
Fig. 18. Phase voltages and currents under unbalanced voltage supply with compensation.
0
10
20
30
40
i
DC
[A]
0 0.005 0.01 0.015 0.02
540
550
560
570
580
v
DC
[V]
time [s]
Fig. 19. DC-link voltage and current under unbalanced voltage supply with compensation.
The effect of reduction of the DC-link capacitor from 1000 µF to 500 µF is shown in Figures
20 through 23.
Fig. 20. Phase voltages and currents under unbalanced voltage supply with reduced DC-link
capacitance without compensation.
Electric Machines and Drives
206
0
10
20
30
40
i
DC
[A]
0 0.005 0.01 0.015 0.02
540
550
560
570
580
v
DC
[V]
time [s]
Fig. 21. DC-link voltage and current under unbalanced voltage supply with reduced DC-
link capacitance without compensation.
Fig. 22. Phase voltages and currents under unbalanced voltage supply with reduced DC-link
capacitance with compensation.
0
10
20
30
40
i
DC
[A]
0 0.005 0.01 0.015 0.02
540
550
560
570
580
v
DC
[V]
time [s]
Fig. 23. DC-link voltage and current under unbalanced voltage supply with reduced DC-
link capacitance with compensation.
The corresponding situation for reduced input inductance from 10 mH to 5 mH is illustrated
in Figures 24 to 27.
Operation of Active Front-End Rectifier in Electric Drive under Unbalanced Voltage Supply
207
Fig. 24. Phase voltages and currents under unbalanced voltage supply with reduced input
inductance without compensation.
0
10
20
30
40
i
DC
[A]
0 0.005 0.01 0.015 0.02
540
550
560
570
580
v
DC
[V]
time [s]
Fig. 25. DC-link voltage and current under unbalanced voltage supply with reduced input
inductance without compensation.
Fig. 26. Phase voltages and currents under unbalanced voltage supply with reduced input
inductance with compensation.
Electric Machines and Drives
208
0
10
20
30
40
i
DC
[A]
0 0.005 0.01 0.015 0.02
540
550
560
570
580
v
DC
[V]
time [s]
Fig. 27. DC-link voltage and current under unbalanced voltage supply with reduced input
inductance with compensation.
3.2 Limitation of control range due to unbalanced voltage supply
The necessity to generate the negative sequence component of the switching functions in
order to eliminate the effect of the supply-voltage unbalance on the DC-link voltage
pulsations reduces the control range for the positive sequence component of the switching
functions (Chomat et al., 2009). This is due to the fact that in individual phases the
maximum of the switching function can only reach one at most at any given time. Another
constraint results from the current rating of the converter. The resulting constraints depend
on the value and type of the unbalance.
Analysis of the limitation corresponding to various types of unbalanced supply voltages has
been carried out. The reference parameters of the input impedance were chosen to be
R = 0.1
Ω and L = 10 mH. The input phase voltages had nominal voltage amplitudes of
230 V, nominal frequency of 50 Hz, and mutual phase shifts of 120° to form a three-phase
voltage system in the case of the symmetrical system. The DC-link voltage was set to 400 V.
The choice of the positive sequence component of the switching functions from the available
control range affects both the magnitude of the DC-link current and the currents in
individual input phases. Figure 28 shows what magnitudes of the DC-link current
correspond to the coordinates from the available control range. The unbalance was formed
Fig. 28. DC-link current under unbalanced voltage supply (L = 10 mH, R = 0.1 Ω,
V
dc
= 400 V).