báo cáo hóa học: " Application driven, AMC-based cross-layer optimization for video service over LTE" doc
Bạn đang xem bản rút gọn của tài liệu. Xem và tải ngay bản đầy đủ của tài liệu tại đây (564.1 KB, 9 trang )
RESEA R C H Open Access
Application driven, AMC-based cross-layer
optimization for video service over LTE
Yongil Kwon
*
, Doug Young Suh, Sung Chun Kim and Een Kee Hong
Abstract
In this paper, we propose a cross-layer optimization scheme in which the application layer controls the medium
access network (MAC) and physical (PHY) layers in long-term evolution (LTE, from 3rd generation partnership
project [3GPP] release 8) to maximize the quality of video streaming services. We demonstrate how to optimize
quality using the equi-signal-to-noise ratio (equi-SNR) from the lower layer and the equi-peak signal-to-noise ratio
(equi-PSNR) from the upper layer in the two-dimensional domain, consisting of a bit rate (R) and packet loss ratio
(PLR). The proposed approach outperforms the conventional approach, which operates regardless of the
application-specific requirements for quality of service (QoS) and quality of experience (QoE) in PHY.
Keywords: SVC, AMC, CLO, QoS, LTE
1. Introduction
User demand for mobile multimedia services has
exploded. However, current mobile multimedia services
have weaknesses such as fading, congestion, insufficient
resources, and time-varying conditions. These problems
need to be addressed. Studies on improving (QoS) can
be classified into three categories: [1]. real-time video
service optimization based on wireless channel states;
[2]. wireless resource allocation based on video charac-
teristics; and [3] a hybrid of categories [1] and [2].
The authors of references [1-3] proposed scheduling
and allocation methods using the available mechanisms
and parameters in the medium access network (MAC)/
physical (PHY) layers of wireless networks. In addition,
Fang [4] and Ha [5] improved the service quality by
considering packet loss using cross-layer optimization
(CLO) between whole layers.
Video is made up of packets with different priorities.
Average video quality could be adaptively improved by
protecting the more important packets from error and
filtering out less important packets at a low bit rate (R).
The cross-layer methods mentioned above adapt the
video layer to already-determined MAC/PHY conditions.
Even under the same mobile conditions, however, var-
ious combinations of (R, packet loss ratio [PLR]) are
possible based on the choice of modulatio n and
channel-coding scheme. If the target block error rate
(BLER) is set too low, the available bit rate will also be
low. Since most mobile channels have fixed transmission
parameters suitable for non-real-time data services, it is
important that MAC/PHY parameters are chosen differ-
ently, based on the service requirements of real-time
video services.
Haghani [6] suggested a method of improving video
qualitybyclassifyingthesignificanceofframesina
video stream and transmitting them as packets of differ-
ent priorities that correspond to those in IEEE 802.16
QoS classes. In referenced paper [7], a method that allo-
cates bit rate by predicting the quality of the video after
recovery from packet losses along the wireless channel
was suggested. This method searches for the optimal
point yielding the best video quality using various rate
control methods, such as fine granular scalability (FGS)
or H.264/MPEG-4 scalable video coding (SVC). FGS
guarantees apropos degradation, but its rate-distortion
(R-D) performance is so poor that it has become
obsolete.
We focused on a third method for improving QoS. At
a signal-to-noise ratio (SNR) measured in the lower
layers, all possible combinations o f (R, PLR) for all pos-
sible modulation and coding scheme (MCS) levels yield
the equi-SNR graph. The upper layer (including the
video layer and transport layer) provides equi-PSNR
graphs, which are also sets of (R, PLR) combinations,
* Correspondence:
Kyung-Hee University, Suwon, Korea
Kwon et al. EURASIP Journal on Wireless Communications and Networking 2011, 2011:31
/>© 2011 Kwon et al; licensee Springer. This is an Open Access article distributed under the terms of the Creative Commons Attribution
License ( which permits unrestricted use, distribution, and reproduction in any medium,
provided the original work is properly cited.
and result in the same PSNR. An optimal point can be
found at the highest PSNR that lies on the equi-SNR
graph of the current SNR. The optimal operation point
is determined to be its nearest MCS point along the
selected equi-SNR graph. This enables the highest PSNR
achievable for a given set of mobile channel conditions.
Since both equi-SNR and equi-PSNR graphs are inde-
pendently prepared, the computational burden can be
dramatically reduced.
Section 2 describes related background technologies in
LTE and SVC. Section 3 introduces the proposed appli-
cation-driven adaptive modulation and coding (AMC)
scheme. The performance of the proposed method is
demonstrated using experiments in Section 4. Sectio n 5
concludes this paper.
2. Background
Following CLO, in this paper, the lower layers are based
on 3GPP LTE [8], which includes AMC and hybrid- auto
repeat request (H-ARQ), while the upper layers use for-
ward error correction (FEC) and H.264/MPEG-4 SVC
video streams.
2.1 MAC and PHY layers in 3GPP LTE
Available bit rate (R)andBLERp
b
are determined
according to the SNR between the node base transceiver
station (Node B) and the user equipment (UE). Bit rate
in the PHY layer is determined by an MCS including H-
ARQ.
The symbol rates of quadrature phase shift keying
(QPSK), 16 quadrature amplitude modulation (QAM),
and 64QAM are 2:4:6, and their symbol block sizes are
480, 960, and 1440 bits, respectively. Coding rates range
from 0.3 to 0.8. A combinat ion of a modulatio n mode
and a coding rate is called a MCS. The MCS level is
selected adaptively according to a predefined target
BLER and time-varying channel quality information
(CQI), particularly SNR [8]. As we can see i n Table 1
there are five CQI levels. Block size m
c
is determined by
CQI level c.
A block is the minimum transmission unit of orthogo-
nal frequency division multiplexing (OFDM), while a
packet is the minimum transmission unit in the trans-
port layer. If the size of a packet is large r than that of a
block, the p acket may be segmented into blocks in the
transmitter and assembled in the receiver. If the size of
a packet is M, it is divided into n =[(M + m
c
-1)/m
c
]
blocks. As suggested in [1], a damaged block and its
corresponding packet are assumed to be discarded, so
that the PLR of the PHY layer is
P
PHY,c
(
S, N
)
=1−
(
1 − P
b
(
S, c
))
n
,
where P
b
(S, c)isBLERandn is the number of blocks
in a packet. For a given SNR (S) and video packet size, a
set of (R, P
PHY
) is determined by AMC (Figure 1).
2.2 SVC and FEC
Rate control and unequal error protection techniques
are used for adaptation to (R, P
PHY
)providedbythe
MAC/PHY layers. SVC [9] is useful because it can be
used for simultaneously encoding video streams and
includes more kinds of scalability, such as spatial scal-
ability and quality scalability.
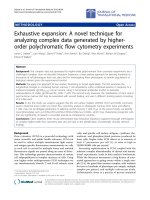
Figure 2 shows a case in which there are six layers
with a combination of two spatial scalability layers and
three temporal scalability layers. (Quality [Q] scalability
is not used.) The spatial and temporal resolutions of the
base layer (the lowest layer) are quarter common-inter-
mediate-format (QCIF, 176 × 144) and 15 Hz, while
those of the highest layer are CIF (352 × 288) and 30
Hz. The priority of the lower layer is higher than that of
the upper layer, since the upper layer will not be
decoded correctly, if the lower layer is lost.
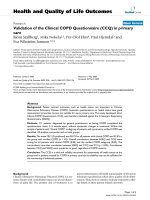
Figure 2 shows rate-distortion curves for video
sequences encoded in the SVC architecture. The
dynamic range in bit rate ranges from 134 kbps to more
than 600 kbps. The PSNR of a missi ng picture is calcu-
lated by comparing the original picture with the tempo-
rally nearest decoded picture. Since PSNR is calculated
in CIF size, the base layer image has to be up-sampled
before PSNR calculation.
RS(N, K, P
PHY
) is the residual PLR in the application
layer. P
app
is calculated depending on the coding ratio
K/N and number of video packets K. Through the RS(N,
K,
PHY
), P
PHY
becomes P
app
as follows:
RS
(
N, K, P
PHY
)
= P
app
=
N
j−N−K+1
N
j
P
j
PHY
(
1 − P
PHY
)
N−j
N
,
where N is the total number of transported packets,
including both video and parity packets. K and N are
selected to maximize K by satisfying the constraints P
app
<
P
target
and
R ×
T
S
> MN(
bytes)
,whereT is a group
Table 1 CQI table and BLER correspond to SNR
CQI index (c) 5 10 15 20 25
Modulation QPSK 16QAM 16QAM 64QAM 64QAM
Coding rate 0.36 0.33 0.6 0.55 0.8
Block size
(bits/block)
152 296 552 840 1192
SNR (S) BLER (after H-ARQ within eighth re-transmission)
5 0.013 0.062 0.231 0.358 0.591
10 0.002 0.013 0.031 0.089 0.177
15 0.0002 0.0028 0.006 0.018 0.037
20 0.0002 0.001 0.001 0.005 0.009
Kwon et al. EURASIP Journal on Wireless Communications and Networking 2011, 2011:31
/>Page 2 of 9
of pictures (GOP) of the period in seconds and M is the
packet size in bytes. In this paper, P
targe =
10
-5
. (If T =1
sandP
targe =
10
-5
, and the mean time between failures
is 10
5
s, an outage is expected once every day on
average.)
3. Application-driven AMC
We propose a cross-layer optimization method where
AMC is driven by the application layer, i.e., the video
service. In the same two-dimensional space of (R,PLR),
equi-SNR curves are generated by the PHY layer, while
equi-PSNR curves are generated by the application
layer. Using two sets of curves, the MCS which enables
the highest PSNR can be selected for a given SNR.
3.1. Generation of the equi-SNR curve
Figure 3 shows that P
PHY
is determined by SNR from the
MAC/PHY layer and packet size M, where M denotes the
packet size of video data. We assume that the bit rate of
the video stream is constant. Using the results of PLR and
the CQI table, we can define a set of bit rate R and PLR
P
PHY
(R, P
PHY
), as a vector
¯
v
in the two-dimensional R-
P
PHY
space. Conventiona lly, onl y one v is selected as an
operation point with respect to the predefined target
BLER. For a given SNR and a given maximum retransmis-
sion number of H-ARQ, howeve r, at most five different
¯
V
’s can be used, since |C| = 5, and the set of
¯
v
’sisdefined
as the equi-SNR curve. For immediate adaptation in a
time-varying condition, there are sufficient SNR values;
these equi-SNR curves can be generated before providing
video service in the R-P
PHY
space.
Figure 4 gives an equi-SNR graph of all possible
operation points at every given SNR. Among them, only
one point, bigger than the others, is selected by the con-
ventional scheme. It is questionable whether the selec-
tion is good for any application.
Figure 1 SVC frame structure.
20
25
30
35
40
0 100 200 300 400 500 600
PSNR(dB)
R(Kbits/s)
CI TY 352x288
SOCCER 352x288
Figure 2 R-D curve (frame rate: enhance 30 Hz, base 15 Hz,
QP: enhance 28, base 30, resolution: enhance CIF, base QCIF,
contents: Soccer, City sequence).
Kwon et al. EURASIP Journal on Wireless Communications and Networking 2011, 2011:31
/>Page 3 of 9
0.001
0.01
0.1
1
-8 -4 0 4 8 12 16 20 24
P_PHY
SNR(dB)
(5, 400)
(15, 400)
(25, 400)
(5, 800)
(15, 800)
(25, 800)
Figure 3 PLR of each packet size.
0.001
0.01
0.1
1
100 200 300 400 500 600 700 800
P_PHY
R (kbps)
6 8 9 10
11 12 13 14
15 16 17 20
Equi-SNR
Figure 4 Equi-SNR graph (CQI(c): 5-25, SNR: 6-20).
Kwon et al. EURASIP Journal on Wireless Communications and Networking 2011, 2011:31
/>Page 4 of 9
3.2. Generation of the equi-PSNR curve
In the same R - P
PHY
space, video service range (VS R) Ř
can be represented two-dimensionally, as shown in
Figure 5. Ř includes the bit rates of both video packets
and parity p ackets. If P
PHY
is almost zero, no parity is
included and all bit rates are used for video data. Ř cor-
responds to the top line from r
min
to r
max
.AsP
PHY
increases (vertically moving down), parity data are
added to satisfy the loss by constraint P
app <
P
target
. This
results in exponentially decreasing lines on both sides.
ˇ
R =
(R, P
PHY
) | r >
rN
K
, RS
(
N, K, P
PHY
)
= P
app
≤ P
target
, K =
τ × T
M × 8
bits per b ytes
, r
min
≤ r ≤ r
max
Within the Ř, we can calculate the maximum PSNR at
each R, P
PHY
point. Then, the set of points representing
the same PSNR is defined as the equi-PSNR curve. Fig-
ure 5 shows equi-PSNR curves of the lowest and highest
PSNR values, while Figure 6 shows all equi-PSNR
graphs as a contour map.
3.3. Application-driven AMC
The equi-SNR curve for a given SNR value is the trace
of all possible sets of (R, P
PHY
), while the equi-PSNR
curve for a given PSNR value is a trace of (R, P
PHY
)sets
that result in the video quality of t he given PSNR when
FEC is optimally applied. Both equi-SNR curves and
equi-PSNR curves are drawn in the two-dimensional (R,
P
PHY
) space. As we mentioned in the introduction, an
optimal operation point is found by overlapping those
two sets of curves. For each measured SNR value, an
optimal service point (R, P
PHY
) can be found if at least
one equi-SNR curve exists in the VSR and the equi-SNR
and equi-PSNR curves are convex. An equi-SNR curve
¯
V
has connections for discrete points
¯
v
for all CQI
levels.
¯
V
(
S, M, A
)
=
¯
v
|¯
v
c
(
S, M, A
)
= {R
c
P
PHY,c
}, c =5, 10, ,25
,
where c is a CQI level, M is packet size, S is SNR
value, and A is the number of allocated resource blocks
(A = 1 in this paper).
An equi-PSNR curve with a PSNR of q is defined as
¯
Q
q
= {
(
R, P
PHY
)
q =max
(sl,fl)
PSNR
(
R, P
PHY
)
}
,
where sl and fl represent scalability level and parity
level (i.e., FEC level ), respectively. The bit rates of video
data are determined by sl. Sums of bit rates of video
data and parity data should not exceed R,andresidual
PLR resulting from fl should be less than the target PLR
P
target
when PLR resulting from the MAC/PHY layers is
P
PHY
. Using these two kinds of curves in the (R, P
PHY
)
space, the optimal operation point can be identified.
R
c
∗
,P
∗
PHY
=argmax q
(
¯
v
s
)
¯
v =
¯
V
(
S, M, A
)
At the same time, the optimal CQI level c* can be
determined. This operation point provides the best
video quality under certain conditions, which are SNR,
packet size, and number of resource blocks.
4. Experiments and discussion
The video sequences “City” and “Soccer” were used for
experiments. Since spatial complexity of both sequences
is high while the temporal complexity of “Soccer” is
much higher than that of “City”, the highest quality of
UBPLQ
UBPD[
UPD[
UPLQ
Figure 5 Video service range: minimum video stream rate line(r_min) and maximum video rate line(r_max) of (1) City, (2) Soccer.
Kwon et al. EURASIP Journal on Wireless Communications and Networking 2011, 2011:31
/>Page 5 of 9
“City” is achieved at lower bitrate as shown Figure 2.
Therefore, their video service areas vary, as shown in
Figure 5 in Section 3.2. They are encoded in si x layers,
including two spatial layers and five temporal layers (the
base has four temporal layers). The two spatial layers
arecomposedofQCIFandCIF,whilethethreetem-
poral layers have frame rates from 15 to 3 0 Hz. Video
packet size is fixed at M = 400 bytes and P
target
,which
is the target PLR in the application layer, is 10
-5
.
Figure 6 shows contour maps of equi-PSNR curves
for City and Soccer, respectively. The highest plateaus
at the uppe r and right corners correspond to video
quality when all layers are correctly received and
decoded. Gray regions represent VSR. As the video
service area of each sequence is different, the slope of
their contour line is also different. These differences
show distinct characteristics when equi-SNR and equi-
PSNR curve are merged.
D 6RFFHUVHTXHQFH
0.06%
0.10%
0.17%
0.31%
0.54%
0.96%
1. 7 0 %
3.0 1%
5.34%
9.45%
16 . 7 5 %
29.67%
52.56%
9 3. 11%
10
15
20
25
30
35
40
0 128 256 384 512 640 768 896
P_PHY
PSNR
R(Kbits/sec)
35-40
30 -35
25-30
20-25
15- 20
10 - 15
PSNR
0.06%
0.10%
0.17%
0.31%
0.54%
0.96%
1. 7 0 %
3.0 1%
5.34%
9.45%
16 . 7 5%
29.67%
52.56%
9 3. 11%
10
15
20
25
30
35
40
0128256384512640768896
P_PHY
PSNR
R(Kbits/sec)
35-40
30 -35
25-30
20-25
15- 20
10 - 15
PSNR
Figure 6 PSNR over (R, P
PHY
) from the application layer. (a) Soccer sequence. (b) City sequence.
Kwon et al. EURASIP Journal on Wireless Communications and Networking 2011, 2011:31
/>Page 6 of 9
Figures 4 and 6 are merged into Figure 7. The equi-
SNR curves in Figure 4 are drawn in white-colored
lines. The equi-PSNR curves are denoted as a black-
and-white contour map in which a brighter region
means higher video quality. In this graph, the white
points are conventional points according to the target
BLER (10
-1
). We can find four other points that have
different PSNRs. In the VSR, the vector of maximum
VSR points is defined as
MCS =
¯
r
(
r = r
max
)
∈ R
.The
operation points nearest to
MCS
yield the best PSNR
quality. We derive the optimal CQI point c* as follows:
c
∗
= min
MCS −
¯
v
s
.
Figure 7 PSNR and equi-SNR, conventional point, VSR. (a) Soccer sequence. (b) City sequence.
Kwon et al. EURASIP Journal on Wireless Communications and Networking 2011, 2011:31
/>Page 7 of 9
AD-AMC ensures maximum video quality in time-
varying situations. The conventional MCS selection
scheme is not optimal f or a video service, which is less
sensitive to information loss and requires a higher bit
rate than a n ormal data service with the same condi-
tions. In this paper, we used only one resource block
(i.e., A = 1). For video of higher resolution, more than
oneresourceblock(A > 1) providing a higher bit rate
will be used. The optimal CQI point at the maximum
bit rate (R) must be selected for the Soccer sequence, as
it has a wider video service range than the City
sequence does; furthermore, a resource-saving selection
must be made for the City sequence, as it is in an area
where the equi-SNR curve is over the limit.
As shown in Figure 8, at the two extremes of the
highest SNR and lowest SNR, the proposed method
does not seem to have any gain while the UE, the
mobile device in LTE, moves in the cell area. At the
lowest SNR, even the lowest-quality video cannot be
delivered at all. At the highest SNR, resources are so
abundant that all video data can be delivered. In a nor-
mal situation with an SNR range from 12 to 20 dB, the
proposed method outperforms the conventional MCS
selection scheme by 2 to 3 dB in terms of PSNR.
5. Conclusions
This pape r proposes an ac tive cross-layer design in
which the application layer controls MAC/PHY opera-
tion. MAC/PHY operation is currently controlled to
maximize the channel utility of non-real-time data ser-
vices. For higher total throughput, channel resources
maybeconsumedprimarilybyafewterminalswhose
SNRs are high enough, while others “starve.” The service
requirements of real-time multimedia servi ces, however,
are different from those of non-real-time services. The
real-time service should regard characteristics of the
video sequence over (R, PLR) rather than use a fixed
target BLER, since each sequence has the same condi-
tion set. As mobile multimedia services become more
popular, operation policies must adapt to their demands.
We have demonstrated the effects of application-dri-
ven MAC/PHY operation, in which modulation type
and channel-coding level are determined to maximize
QoS. Among the possible operation points at a certain
SNR, maximizing PSNR is selected as an operation
point that satisfies the BLER constraint regardless of
application. In most cases, operation points for multime-
dia services are selected at a higher bit rate and higher
BLER compared to t hose of non-real-time services. By
virtue of scalable video coding and FEC for the recovery
of lost packets, the proposed method achieved at most a
5 dB gain in PSNR.
We also described a technique to isolate the lower
layers from the upper layers of the system without los-
ing the benefits of cross-layer optimization by simplify-
ing the interfaces between the two. Both equi-PSNR
curves from the application and transport layers and
equi-SNR curves from the MAC/PHY layers are mapped
23
25
27
29
31
33
35
37
1234567
PSNR(dB)
SNR(dB)
CITY Conven tion al
CITY AD AMC
SOCCER Con vention al
SOCCER AD AMC
Figure 8 Average PSNR of UE moving in the cell area.
Kwon et al. EURASIP Journal on Wireless Communications and Networking 2011, 2011:31
/>Page 8 of 9
onto the same two-dimensional space of (R, P
PHY
). The
equi-PSNR curves in the (R, P
PHY
) space can be pre-
pared independently of the equi-SNR curves, and vice
versa. By using these two kinds of curves, which are pre-
pared before service, cross-layer optimization during
service is simply used to measure SNR and to determine
a maximum PSNR point along the corresponding equi-
SNR curve. Even though the MAC/PHY scheme has
been altered so that new equi-SNR curve s are built, the
same equi-PSNR curves can be used with the new equi-
SNR curves. This approach will enable users to switch
video-coding techniques or to switch m obile communi-
cation modality more easily in the further development
of cross-layer design.
Abbreviations
AMC: adaptive modulation and coding; BLER: block error rate; CLO: cross-
layer optimization; CQI: channel quality information; FEC: forward error
correction; FGS: fine granular scalability; GOP: group of pictures; H-ARQ:
hybrid-auto repeat request; MAC: medium access network; MCS: modulation
and coding scheme; OFDM: orthogonal frequency division multiplexing; PLR:
packet loss ratio; QAM: quadrature amplitude modulation; QCIF: quarter
common-intermediate-format; QoE: quality of experience; QoS: quality of
service; QPSK: quadrature phase shift keying; SNR: signal-to-noise ratio; SVC:
scalable video coding; VSR: video service range.
Acknowledgements
This paper was partly supported by the IT R&D program of MKE/KEIT
(KI001814, Game Theoretic Approach for Crosslayer Design in Wireless
Communications) and MKE (The Ministry of Knowledge Economy), Korea,
under the ITRC (Information Technology Research Center) support program
supervised by the NIPA (National IT Industry Promotion Agency) (NIPA-2011-
(C1090-1111-0001)).
Competing interests
The authors declare that they have no competing interests.
Received: 6 Septemb er 2010 Accepted: 7 July 2011
Published: 7 July 2011
References
1. S Shankar, M van der Schaar, Performance analysis of video transmission
over IEEE 802.11a/e WLANs. IEEE Trans Veh Technol. 56(4), 2346–2362
(2007)
2. F Foukalas, V Gazis, Cross-layer design proposals for wireless mobile
networks: a survey and taxonomy. IEEE Commun Surv. 10(1), 70–85 (2008)
3. M Van der Schaar, Cross-layer wireless multimedia transmission: challenges,
principles, and new paradigms. IEEE Wirel Commun Mag. 12(4), 55–58
(2005)
4. T Fang, L Chau, GOP-based channel rate allocation using genetic algorithm
for scalable video streaming over error-prone networks. IEEE Trans Image
Process. 15(6), 1323–1330 (2006)
5. H Ha, C Yim, Layer-weighted unequal error protection for scalable video
coding extension of H.264/AVC. IEEE Trans Consumer Electron. 54(2),
736–744 (2008)
6. E Haghani, S Parekh, A quality-driven cross-layer solution for MPEG video
streaming over WiMAX networks. IEEE Trans Multimedia. 11(6), 1140–1147
(2009)
7. MK Jubran, M Bansal, Accurate distortion estimation and optimal
bandwidth allocation for scalable H.264 video transmission over MIMO
systems. IEEE Trans Image Process. 18(1), 106–116 (2009)
8. S Sesia, I Toufik, LTE, the UMTS long term evolution: from theory to
practice. (2009) ISBN 978-0-470-69716-0
9. Text of ISO/IEC 14496-4:2001/PDAM 19 Reference Software for SVC, Joint
Video Team (JVT) of ISO-IEC MPEG & ITU-T VCEG, N9195 (2007)
doi:10.1186/1687-1499-2011-31
Cite this article as: Kwon et al.: Applica tion driven, AMC-based cross-
layer optimization for video service over LTE. EURASIP Journal on Wireless
Communications and Networking 2011 2011:31.
Submit your manuscript to a
journal and benefi t from:
7 Convenient online submission
7 Rigorous peer review
7 Immediate publication on acceptance
7 Open access: articles freely available online
7 High visibility within the fi eld
7 Retaining the copyright to your article
Submit your next manuscript at 7 springeropen.com
Kwon et al. EURASIP Journal on Wireless Communications and Networking 2011, 2011:31
/>Page 9 of 9