báo cáo hóa học: " Analogue-based approaches in anti-cancer compound modelling: the relevance of QSAR models" pot
Bạn đang xem bản rút gọn của tài liệu. Xem và tải ngay bản đầy đủ của tài liệu tại đây (1.06 MB, 12 trang )
ORIGINAL Open Access
Analogue-based approaches in anti-cancer
compound modelling: the relevance of QSAR
models
Mohammed Hussaini Bohari, Hemant Kumar Srivastava
*
and Garikapati Narahari Sastry
*
Abstract
Background: QSAR is among the most extensively used computational methodology for analogue-based design.
The application of various descriptor classes like quantum chemical, molecular mechanics, conceptual density
functional theory (DFT)- and docking-based descriptors for predicting anti-cancer activity is well known. Although
in vitro assay for anti-cancer activity is available against many different cell lines, most of the computational studies
are carried out targeting insufficient number of cell lines. Hence, statistically robust and extensive QSAR studies
against 29 different cancer cell lines and its comparative account, has been carried out.
Results: The predictive models were built for 266 compounds with experimental data against 29 different cancer
cell lines, employing independent and least number of descriptors. Robust statistical analysis shows a high
correlation, cross-validation coefficient values, and provides a range of QSAR equations. Comparative performance
of each class of descriptors was carried out and the effect of number of descriptors (1-10) on statistical parameters
was tested. Charge-based descriptors were found in 20 out of 39 models (approx. 50%), valency-based descriptor
in 14 (approx. 36%) and bond order-based descriptor in 11 (approx. 28%) in compa rison to other descriptors. The
use of conceptual DFT descriptors does not improve the statistical quality of the models in most cases.
Conclusion: Analysis is done with various models where the numb er of descriptors is increased from 1 to 10; it is
interesting to note that in most cases 3 descriptor-based models are adequate. The study reveals that quantum
chemical descriptors are the most important class of descriptors in modelling these series of compounds followed
by electrostatic, constitutional, geometrical, topological and conceptual DFT descriptors. Cell lines in
nasopharyngeal (2) cancer average R
2
= 0.90 followed by cell lines in melanoma cancer (4) with average R
2
= 0.81
gave the best statistical values.
Keywords: Analogue-based design, Anti-cancer cell lines, Anti-cancer drugs, Quantum chemical descriptors, QSAR,
Docking
Background
Cancer has been seriously threatening the health and life
of humans for a long period and has become the leading
disease- related cause of deaths of human population [1].
Radiation therapy and surgery as a means of treatment
are only successf ul when the cancer is found at early-
localized stage. However, chemotherapy in contrast is
the mainstay in treatment of malignancies because of its
ability to cure widespread or metastatic cancers. Natural
products are the chemical agents that have been the
major source of anti-ca ncer drugs. According to a
review on new chemical entities, approximately 74% of
anti-cancer drugs were either natural products or nat-
ural product-related synthetic compounds or their
mimetics [2]. Computational methodologies have
eme rged as an indispensible tool for any drug discovery
program, playing key role from hit identification to lead
optimization. The QSPR/QSAR is among the most prac-
tical tool used in analogue/ligand-based drug design and
has been extensively reviewed for prediction of various
properties like ADME [3], toxicity [4,5], carcinogenicity
* Correspondence: ;
Molecular Modelling Group, Indian Institute of Chemical Technology,
Taranaka, Hyderabad 500 607, India
Bohari et al . Organic and Medicinal Chemistry Letters 2011, 1:3
/>© 2011 Bohari et al; licensee Springer. This is an Open Access article distributed under the terms of the Creative Commons At tribution
License
[6], retention time [7] stab ility [8] and other physico-
chemical properties apart from the biological activity
[9-12]. This theoretical method follows the axiom that
the variance in the activities or physico chemical proper-
ties of chemical compounds is determined by the var-
iance in their molecular structures [13-15].
Computational methods aids in not only the design
and interpretation of hypothesis-driven experiments in
the field of cancer research but also in the rapid genera-
tion of new hypotheses. The QSAR has widely been
applied for the activity prediction of diverse series of
biological and/or chemical compounds including anti-
cancer drugs [16-21]. A number of quantum chemical
descriptors (such as charge, molecular orbital, dipole
moment, etc.) and molecular property descriptors (such
as steric, hydrophobic coefficient, etc.) have b een suc-
cessfully applied to establish 2D QSAR models for pre-
dicting activities of compounds [22-24]. Density
functional theory (DFT)-based descriptors have found
immense usefulness in the prediction of reactivity of
atoms and molecules, and its application in the develop-
ment of QSAR has been recently reviewed [25-30].
QSAR has been instrumental in the development of var-
ious popular drugs, and it has been discussed in detail
earlier [31].
For a cancer type, there are a number of cell lines
available, on which in vitro evaluation of biological
activity can be performed, but the results of this evalua-
tion varies based on the cell line employed for assay.
Therefore, it becomes difficult for computational che-
mist to choose experimental data from a pool of avail-
able biological activity for a single scaffold type, so as to
proceed for analogue-based design. Although in vitro
assay for anti-cancer activity is available against ma ny
different cell lines, most of the computational studies
are carried out t argeting any one particular cell line,
which may not be a good approach to rely upon. The
study considering all the available experimental data to
build predictive models, will guide medicinal chemist to
more reliably design new and potent compounds. Also,
analyzing the obtained descriptors for models against all
the cell lines, may suggest the importance of a particular
class of descriptor in modelling anti-cancer activity
against a cancer type. Such statistically robust and
extensive QSAR s tudies against many different cancer
cell lines have not been reported yet. Hence, we per-
formed comprehensive QSAR modelling studies on 266
anti-cancer compounds against 29 different cancer cell
lines. Descriptor analysisofalltheQSARmodelswas
performed to derive commonality among various cell
lines belonging to a cancer type. The experi mental data
considered in the study was from in vitro cell line-based
assays, and it is difficult to get reliable target-based
information from such studies, unless meticulously
validated. Since the aim of the present study was to
evaluate the potentials of simple 2D-based descriptors in
anti-cancer compound modelling, the biological target-
related aspects were not considered. This study provides
one of the most comprehensive accounts of the struc-
ture-activity relationship of a large number of molecules
against 29 different cancer cell lines. Besides being sta-
tistically significant, the aim of this study is to assess the
role and relevance of computationally demanding con-
ceptual-DFT descriptors compared with the conven-
tional descriptors. The strengths and limitations of
QSAR models on treating a c omplex area such as the
development of anti-cancer compounds are important
to notice, and the present study shows a systematic way
of developing and applying QSAR equations effectively.
Table 1 shows the name of scaffolds considered, differ-
ent cell lines [32-41], number of molecules correspond-
ing to cell lines and the target of action or the
molecular mechanism of scaffolds.
Results and discussion
Two different schemes were opted to develop statisti-
cally significant QSAR models. In the first scheme, 10
QSAR models were developed for the 10 scaffolds used
in this study (i. e. scaffold-based QSAR m odels), whereas
in the second scheme 29 different QSAR models were
developed based on the availability of IC
50
values against
29 cancer cell lines by combining all the scaffolds (i.e.
cell lines-b ased QSAR models). The parent structure of
all th e scaffolds with a number of compounds and name
of cell lines are represented in Scheme 1.
It is vitally nec essary to avoid the oversimplification of
the QSAR modelling process and employ statistically
robust approaches for the model development. The
selection of the best model was based on the values of
correlation coefficient obtained from the correlation of
approximately 300 descriptors (constitutional, geometri-
cal, topological, electrostatic and quantum chemical,
etc.) in different combinations. In one hand, the unique-
ness of a compound and its total chemical information
cannot be described by very few descriptors while on
the other hand large number of descriptors will create
confusions and reduce the statistical robustness and pre-
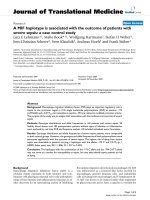
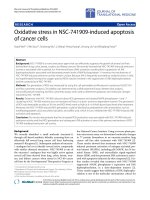
dictive ability of the model. The effect of a number of
descriptors on the correlation coefficient values for all
the models were tested on training set by correl ating 1-
10 descriptors separately and presented in Figure 1a (for
cell lines-based models) and b (for scaffold-based mod-
els). We observed that in various models, three descrip-
tors are sufficient for getting a good correlation and
using more than three descriptors make only small
effect on the statistical quality of the models in most
cases. Although more than six descriptor-based models
may provide high correlation and cross-validation
Bohari et al . Organic and Medicinal Chemistry Letters 2011, 1:3
/>Page 2 of 12
Table 1 Details of scaffolds considered in the study and the cell lines against which their anticancer activity was
reported along with the number of molecules in each cell lines and its molecular target/mechanism of action if
studied
No. Scaffold name Cell lines Cancer type # of comp. Comments Ref.
S1 Naphthalimides LoVo Colon 23 DNA intercalators [31]
A549 Lung 27
Hs468 Glioblastoma 23
U373-MG Glioblastoma 29
HCT-15 Colon 25
MCF-7 Breast 20
S2 Aryl thiazolyl benzamide MB-231 Breast 27 Nek2 mitotic pathway [32]
MB-468 Breast 25
K562 Blood 25
S3 Procaspase activators U937 Lymphoma 19 Enhance procaspase-3 activity [33]
S4 Tylophorine analogues KB Nasopharyngeal 21 NF-kB signalling pathway [34]
A549 Lung 21
DU-145 Prostate 21
S5 Parthenin analogues HL-60 Blood 37 TopoisomeraseII inhibition [35]
HeLa Cervical 37
S6 Arylthiazolidine-4-acid amides A375 Melanoma 33 - [36]
B16F1 Melanoma 33
DU-145 Prostate 32
LNCaP Prostate 35
PC-3 Prostate 31
PPC-1 Prostate 33
WM-164 Melanoma 32
Fibroblast Fibroblast 27
RH7777 Prostate 32
S7 Hydroxyl benzofuranones LNCaP Prostate 22 Selective inhibitor of the mammalian target of rapamycin [37]
S8 Arylthiazole-4-acid amides B16F1 Melenoma 20 Tubulin polymerization inhibition [38]
A375 Melanoma 20
DU-145 Prostate 16
PC-3 Prostate 17
LNCaP Prostate 17
PPC-1 Prostate 18
S9 Estradiol 3,17-O,O-bis-sulfamates DU-145 Prostate 29 Disruption of the tubulin-microtubule equilibrium [39]
MB-231 Breast 22
S10 Aromathecins SF-539 CNS 29 Inhibitors of human topoisomerase I [40]
HOP-62 Lung 28
HCT-116 Colon 28
UACC-62 Melanoma 27
SN12C Renal 26
MCF-7 Breast 29
DU-145 Prostate 23
Bohari et al . Organic and Medicinal Chemistry Letters 2011, 1:3
/>Page 3 of 12
coefficient values, however, this may be false and thus
may not be very useful for the further prediction of IC
50
values. Before the division of training and test set of
compounds three, four and five, descriptor-based mod-
els were selected. While comparing the statistical perfor-
mance of the selected models, three descriptor-based
models were found to be optimum as they provide very
acceptable correlation in most cases.
All the models were divided into training and test set
by randomly selecting around 20% of the compounds in
the test set. Two independent test sets were constructed
to rule out chance correlation (statistical data for
the second test set is re ported in Addition al file 1
Table S83). Both the test sets showed the similar statisti-
cal performance indicating that the developed models
are adequate. Final QSAR models were generated within
the training set, and they were used to predict the activ-
ity of test set of compounds. The lower average residual
obtained in both the training and test set of compound s
in all the models indi cate that the developed models ar e
valuable and have capability to establish the relationship
between the structure and activity for various anti-can-
cer scaffolds used in this study.
In order to assess and compare the predictive power
and the stability of the QSAR models, several statistical
and other parameters are reported and widely applied
like R
2
, R
cv
2
, s
2
, F, and AE (for details about these para-
meters, see footnote to Table 2). Table 2 contains the
regression summary for cell lines-based QSAR models
along with regression equation, name of the cell lines
and t ypes of cancer. Most of the cell lines-based QSAR
models where the activity range is broad (M1, M 2, M4,
M5, M6, M8, M9, M11, M12 and M20) show higher
statistical quality (R
2
~0.80,R
cv
2
~ 0.75) and seems
valuable for the current class of compounds. The statis-
tical quality of few other cell line-based models (M10,
M15, M19 and M21) is also reasonable (R
2
~ 0.75, R
cv
2
~ 0.70), and these models can be used for the predic-
tion. However, the statistical qualities of M17, M23 and
M26 models, wh ich are l ower (R
2
~0.60,R
cv
2
~0.50),
show that extra care is required before utilizing these
models for the prediction. However, M29 cannot be
Scheme 1 266 compounds which have IC
50
values represented into different scaffolds (S1-S10), the number of compounds in each
scaffold in parenthesis and different cell lines against which the cytotoxicity values were reported (please see Tables S1-10 in
Additional file 1 for structure of all the compounds with their in vitro IC
50
values against various cell lines).
Bohari et al . Organic and Medicinal Chemistry Letters 2011, 1:3
/>Page 4 of 12
used for the prediction because of the insignificant sta-
tistical results obtained for this model (R
2
=0.46,R
cv
2
=
0.43). The reason for poor result in M29 is probably
due to involvement of 118 compounds and 5 different
scaffolds in this model. The increase in the number of
descriptors for M29 is not much improving t he quality
of the model (with 10 descriptors R
2
~0.7)andindi-
cates that the currently used descriptors are not good
enough for developing the structure-activity relationship
for this model, and one needs to try or develop
a
b
Figure 1 Effect of number of descriptors on the correlation coefficient of (a) cell line-based QSAR models, (b) scaffold-based QSAR models.
Bohari et al . Organic and Medicinal Chemistry Letters 2011, 1:3
/>Page 5 of 12
Table 2 Cell line with type of cancer in parenthesis, scaffolds involved, regression summary and number of
compounds in various cell lines based QSAR models
No Cell line
(Type)
Scf Regression equation R
2
R
cv
2
AE O s
2
F # Comp.
TR TS PD
M1 A375
(melanoma)
S6, S8 = 20.6264* MiVH -6.19186* ZXS/ZXR -9719.75*MiNRC
-10.9946
0.79 0.76 0.40 1 0.308 43.24 38 12 19
M2 B16-F1
(melanoma)
S6, S8 = -91.8353*MaPCH-4.3472* ZXS/ZXR-96.017*Ma1ERN
+10.0303
0.83 0.80 0.36 1 0.255 55.71 38 12 19
M4 KB
(nasopharyngeal)
S4 = 769.472* HC-2/Tz +9193.37* Mi1ERN +68.531* MiNACH
-7.67576
0.80 0.71 0.24 0 0.065 40.02 17 4 0
M5 WM-164
(melanoma)
S6 P = 0.172982*PS-3A
Z
-0.968448* KHI
3
-1205.47* MiNRN
+7.6019
0.81 0.77 0.16 1 0.062 33.70 24 6 7
M6 PC-3
(prostate)
S6, S8 = -3.14901* ZXS/ZXR -95.5552* MaPCH -2.37816*FS-2P
z
+
9.10613
0.83 0.79 0.31 0 0.136 77.55 29 12 23
M8 UACC-62
(melanoma)
S10 = -256.732* MaPCN +13.6563 *MaPC+6.61641 *MaVO-
34.0055
0.81 0.74 0.30 1 0.094 51.96 21 5 6
M9 SF-539
(CNS)
S10 = 0.000240276*GI
AP
+ 0.113696*TPCCMD
+13.1633*MaBOO-20.9902
0.81 0.75 0.28 0 0.120 37.46 21 6 3
M10 LNCaP
(prostate)
S6, S7, S8 = -0.0396034* ZXS +0.412216* SIC
0
-24.4713* RNN
+0.80884
0.75 0.74 0.46 1 0.370 67.18 58 15 24
M11 PPC-1
(prostate)
S6, S8 = 0.00211384* PS-1
Z
-17.6992* RPCG
Z
-11.5927* MaNACH
+8.51731
0.80 0.77 0.27 1 0.150 48.02 37 12 20
M12 HCT-116
(colon)
S10 = -7.48415* ZXS/ZXR+ 0.157414 *TPCCMD-0.0635789*
RNCS
Q
+ 7.09755
0.86 0.77 0.19 1 0.157 17.06 24 9 5
M15 MB-231
(breast)
S2, S9 = -0.031465*YZS+ 5.30324* FBCS
q
+1.16981* MaPBO
+1.40089
0.70 0.66 0.35 1 0.191 25.79 37 11 21
M17 A549
(lung)
S1, S4 = -0.505821* RPCS
Z
-3.59234* MiVO +2.58951* MiBOO +
9.37614
0.64 0.56 0.32 1 0.135 30.22 38 9 12
M19 HOP-62
(lung)
S10 = -12.0428* ZXS/ZXR -4.44967* RPCS
Q
-0.819861* NF
+12.2371
0.70 0.66 0.38 0 0.278 14.69 23 5 2
M20 KBvin
(nasopharyngeal)
S4 = -5.01349**HC-1/T -5.01844* PP/SD -0.768924* MaNACC
+3.76504
0.99 0.97 0.02 0 0.047 31.28 17 4 0
M21 MCF-7
(breast)
S1, S10 = -5.62149*ZXS/ZXR-64.0123* MiNRO-100.36*Mi1ERC
+5.76988
0.72 0.65 0.32 1 0.138 31.51 39 9 36
M23 SN12C
(renal)
S10 = -0.339628*NN-8.49682* XYS/XYR-1.57052* MiVC+
14.5423
0.60 0.51 0.25 1 0.048 17.50 17 8 5
M26 OVCR-3
(ovarian)
S1, S10 = -0.00524177* MSA -0.300618*THCMD +2.31159* MaVO
-0.441172
0.63 0.51 0.25 2 0.072 25.39 18 8 18
M29 DU 145
(prostate)
S4, S6, S8, S9,
S10
= 15.0725* RNO +0.00985941* HS-1
Z
-25.5879* H-HC-2/ST
+2.19779
0.46 0.43 0.44 1 0.391 28.73 99 18 36
M3 HeLa
(cervical)
S2, S5 = 0.298986*NN+0.00213416*W-1wP+0.849867*MiVC-
2.24538
0.83 0.76 0.13 1 0.043 71.93 44 16 11
M7 U937
(lymphoma)
S3 = -22.0891* MiBOH +8.67391* MiVN -52.0125* H-HD-2/T
-7.6190
0.84 0.75 0.14 0 0.029 32.41 15 4 8
M13 Hs-638
(glioblas toma)
S1 = 9.68671* MaVC -1671.96* A1ERC -2.78721*MiVO
-30.7528
0.83 0.70 0.08 1 0.009 29.13 17 5 16
M14 HCT-15
(colon)
S1 = 2.33664* AVN -2.02577* MiNACN +9.95155* MaVC
-46.34
0.86 0.77 0.08 0 0.021 14.25 17 8 14
M16 HL-60
(blood)
S5 = -7.57298*RNH-2.67981*RNO+ 3.66509*MaVO-2.2655 0.65 0.61 0.17 0 0.053 18.98 29 8 0
M18 MB468
(breast)
S2 = -0.184603* RPCS
Z
+0.0249929* RNCS
Z
-2.74917*MiBOH
+4.0713
0.64 0.50 0.16 0 0.044 11.23 19 6 10
M22 LoVo
(colon)
S1 = 106.594* MaERC +5.20066* MaBOO-47.3247*MaVH
+37.9454
0.60 0.53 0.16 0 0.038 13.92 25 6 8
M24 K562
(blood)
S2 = 0.034093* H-HC-1
Q
-0.273258* RPCS
Z
-24886* MiERC
+1.64689
0.62 0.54 0.20 0 0.061 8.70 19 6 10
M25 U373-MG
(glioblas toma)
S1 = -27.0375* ANRN -0.297945* H-1E -0.195554*MaBON 0.55 0.46 0.17 0 0.043 8.18 23 6 10
Bohari et al . Organic and Medicinal Chemistry Letters 2011, 1:3
/>Page 6 of 12
additional descriptors. However, the involvement of sin-
gle scaffolds in this model provides a good statistical
quality (DU145/S10 in Table 3). The models (M3, M7,
M13, M14, M16, M18, M22, M24, M25, M27 and M28),
for which the activity range was narrow were moved to
the end of Table 2 and will not be very reliable for pre-
dictions. Some of these models (M3, M7, M13, M14
and M27) show higher correlation values (R
2
~ 0.80,
R
cv
2
~ 0.75) while other six models show moderate cor-
relation values (R
2
~ 0.65, R
cv
2
~ 0.60) although the resi-
duals are lower in all the 11 models as per expectations.
The statistical details and descriptor types for cell line-
based QSAR models are depicted in Figure 2a.
Regression summary for scaffold-based QSAR models
along with regression equation, name of the cell lines
and types of cancer is given in Table 3. We observed a
good statistical quality with higher regression coefficient
values in all the scaff old-based QSAR models probably
because of the involvement of lesser number of com-
pounds and only one scaffold in the d evelopment of
these models. The range of activity of compounds in
four models (S1, S2, S5 and S6) is narrow, so these
models were moved to the end of Table 3 and these
models will not be very r eliable. The models with nar-
row activity range compounds show lower regression
coefficient values compared with the ones with broad
activity range compounds. All the scaffold-based models
with broad activity range compounds seem reasonable
and can be used for the prediction. The statistical details
and descriptor types for scaffold-based QSAR models
are depicted in Figure 2b.
The obs erved and predicted activity with residuals and
descriptor values for all the developed models are pre-
sented in Additional file 1 (Tables S12 to S46). Outliers
Table 3 Cell line with type of cancer in parenthesis, scaffolds involved, regression summary and number of
compounds in various scaffolds based QSAR models developed for the prediction of IC
50
values
No Cell line
(Type)
Regression equation R
2
R
CV
2
AE O s
2
F # Comp.
TR TE PD
S3 U937
(lymphoma)
= -22.0891* MiBOH +8.67391* MiVN -52.0125* H-HD-2/T -7.61902 0.84 0.75 0.14 0 0.029 32.41 15 4 8
S4 KBvin
(nasopharyngeal)
= -5.01349**HC-1/T -5.01844* PP/SD -0.768924* MaNACC +3.76504 0.99 0.98 0.02 0 0.047 31.28 17 4 0
S7 LNCaP
(prostate)
= -18.4821*RNC-0.0467594*PS-3A
z
-22.7663*HS-1/T+15.7067 0.84 0.75 0.39 1 0.175 51.03 17 4 5
S8 A375
(melanoma)
= -126.706*Mi1ERS-48.08*RNN -49.070* MaERN +5.9514 0.91 0.88 0.24 0 0.164 48.73 16 4 13
S9 MB231
(breast)
= 32.1529* ABC -64.8239* H-HD-2/T -0.546856* HE -31.4458 0.71 0.58 0.33 1 0.099 30.56 17 4 13
S10 DU-145
(prostate)
= 10.2264*MaBOC+0.17954*TPCCMD-1904.46*MiERO-14.72 0.86 0.74 0.23 0 0.091 36.82 16 5 7
S1 Hs-638
(glioblastoma)
= 9.68671* MaVC -1671.96* A1ERC -2.78721*MiVO -30.7528 0.83 0.70 0.08 1 0.009 29.13 17 5 16
S2 K562
(blood)
= 0.039572* H-HC-1
Q
-0.264148* RPCS
Z
-28043.6*MiERC+1.5088 0.62 0.46 0.19 0 0.061 8.70 19 6 10
S5 HeLa
(cervical)
= 0.306112* ACI
2
+ 5.47295*MiPCO +0.533647* RNAB +1.85607 0.57 0.51 0.07 1 0.006 15.88 27 9 0
S6 B16-F1
(melanoma)
= -0.236646*KHI
3
-9.21013*MV/X-128.278*MaPCH+13.064 0.65 0.34 0.28 0 0.096 22.23 25 6 6
Please refer to the footnote of Table 2 for definition of the statistical parameters as well as other abbreviations.
Table 2 Cell line with type of cancer in parenthesis, scaffolds involved, regression summary and number of com-
pounds in various cell lines based QSAR models (Continued)
M27 Fibroblast
(fibroblast)
S6 = 20.3816* MiVN +0.783874* L1E-70.268548*THCMD-
59.2997
0.79 0.72 0.12 0 0.046 22.98 20 5 7
M28 RH7777
(prostate)
S6 = -43.2403*MI-A-1.24807*MaBOC-69.6817*AERN+4.96796 0.58 0.38 0.16 0 0.057 3.45 23 6 7
R
2
is the square of the correlation coefficient and represents the statistical significance of the model. Rcv
2
is the cross-validated R
2
, a measure of the quality of
the QSAR model. O is the number of outlier for the model. s
2
is the standard deviation. F is the Fischer statistics, the ratio between explained and unexplained
variance for a given number of degrees of freedom, thereby indicating a factual correlation or the significance level for QSAR models. AE is the averageof
absolute difference between experimental and predicted IC
50
values. TR is number of molecules in training set, TE is test set molecules, PD is number of
molecules for which activity was not reported, and the QSAR model predicted it.
Bohari et al . Organic and Medicinal Chemistry Letters 2011, 1:3
/>Page 7 of 12
are those compounds which are unable to fit in the
developed QSAR models. Although most of these QSAR
models do not have any outlier, however, in some cases
maximum of one outlier is present because of its higher
deviation between the observed and predicted activities.
The occurrence of outliers is not only due to the possi-
bility that the compounds may act by different mechan-
isms or interact with the receptor in different binding
modes but also due to the intrinsic noise associated
with both the original data and methodological aspects
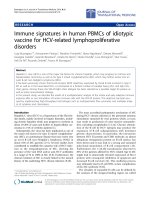
opted for the construction of models. Figure 3a,b repre-
sents the plot between the experimental and predicted
IC
50
values for cell line- and scaffold-based QSAR,
respectively, (the plot for 11 cell line- and 4 scaffold-
based models, which has narrow activity range, is pre-
sented in Figure S1a,b, respectively, of t he Additional
file 1). The average residual for test and training set
compounds presented in this figure clearly shows the
compounds of test set are closer to the line compared
with the compounds of training set. Rigorous validation
for the applicability of generated QSAR models was
done by dividing another independent test set. As per
our e xpectations, the statistical performance of the sec-
ondtestsetissimilartothatofthefirsttestset.The
observed and predicted activity with residuals and
descriptors values for all the developed models for the
second test set of compounds are presented in Addi-
tional file 1 (Tables S48-S82).
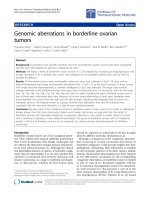
In the developed QSAR models, 78 descriptors (42
quantum chemical, 18 electrostatic, 8 constitutional, 7
geometrical and 3 topological) were used in different
combinations. Figure 4 depicts the details of all the 78
descriptors, its type and occurrence in the models. The
inter-correlation of the descriptors appeared in all the
developed models were taken into account, and the
descriptors were found to be reasonably orthogonal (see
Additional file 1 Table S47 for details). Frequent occur-
rence of quantum chemical descriptors was found in
general in the developed QSAR models. Charge-based
descriptors (such as Maximum partial charge for a H
atom, Minimum net atomic charge for a H atom, Rela-
tive positive charged surface area, Maximum net atomic
charge for a C atom etc.) were present in 20 of 39 mod-
els (approx. 50%) thereby sharing a major proporti on of
overall descriptor space. This was followed by valenc y-
based descriptors (such as Minimum valency of O atom,
Minimum valency of a C atom, Average valency of a N
atom, Maximum vale ncy of a H atom, etc.) present in
14 models (approx. 36%). This was later followed by
bond order-based descriptors (such as Minimum (>0.1)
bond order of a H atom, Maximum bond o rder of a N
atom, Average bond order of a C atom, Maximum PI-PI
bond order, etc.) present in 11 models (~28%). This
indicates the role of charge-based, valency-based and
bond order-based descrip tors in modelling of the pre-
sent set of compounds. We have tested the conceptual
DFT descriptors on all the above models and found that
these descriptors are not important for this class of
compounds.
Cell lines considered in the current study correspond
to 14 different cancer types (Additional file 1 Table
S84). A mong them, eight cancer types have experimen-
tal data with more than one cell line. Thus, comparative
a
b
Figure 2 Regression summary (correlation coefficient R
2
, cross-
validation coefficient R
CV
2
and average residual AE values) for
(a) cell line-based QSAR models, (b) scaffold-based QSAR
models.
Bohari et al . Organic and Medicinal Chemistry Letters 2011, 1:3
/>Page 8 of 12
a
0.51.01.52.02.53.03.54.04.55.05.5
0.0
0.5
1.0
1.5
2.0
2.5
3.0
3.5
4.0
4.5
5.0
5.5
A37 5
R
2
0.79
R
CV
2
0.76
AE
TR
0.46
AE
TS
0. 1 8
0.5 1.0 1.5 2.0 2.5 3.0 3.5 4.0 4.5 5.0
1.0
1.5
2.0
2.5
3.0
3.5
4.0
4.5
5.0
B16-F1
R
2
0.83
R
CV
2
0.80
AE
TR
0.43
AE
TS
0.17
1.52.02.53.03.54.04.5
2.0
2.5
3.0
3.5
4.0
4.5
5.0
KB
R
2
0.80
R
CV
2
0.71
AE
TR
0.24
AE
TS
0.24
0.5 1.0 1.5 2.0 2.5 3.0 3.5
0.5
1.0
1.5
2.0
2.5
3.0
WM-164
R
2
0.82
R
CV
2
0.77
AE
TR
0.19
AE
TS
0. 0 6
1.5 2.0 2.5 3.0 3.5 4.0 4.5 5.0 5.5
2. 0
2. 5
3. 0
3. 5
4. 0
4. 5
5. 0
PC -3
R
2
0.83
R
CV
2
0.79
AE
TR
0.35
AE
TS
0.19
1.5 2.0 2.5 3.0 3.5 4.0 4. 5 5.0 5.5
2.0
2.5
3.0
3.5
4.0
4.5
5.0
UACC-62
R
2
0.82
R
CV
2
0.74
AE
TR
0.30
AE
TS
0.11
1.5 2.0 2.5 3.0 3.5 4.0 4.5 5.0 5.5
2.0
2.5
3.0
3.5
4.0
4.5
5.0
SF-539
R
2
0.80
R
CV
2
0.75
AE
TR
0. 2 8
AE
TS
0.27
1. 5 2.0 2 . 5 3.0 3. 5 4 .0 4. 5 5.0 5 . 5 6.0 6. 5
1.5
2.0
2.5
3.0
3.5
4.0
4.5
5.0
5.5
6.0
6.5
LNCaP
R
2
0.75
R
CV
2
0.74
AE
TR
0. 5 5
AE
TS
0.15
1.5 2.0 2. 5 3.0 3. 5 4.0 4.5 5.0 5.5
2.5
3.0
3.5
4.0
4.5
5.0
PP C-1
R
2
0.80
R
CV
2
0.77
AE
TR
0.27
AE
TS
0.26
1.0 1.5 2 . 0 2 .5 3. 0 3.5 4 .0 4 . 5 5.0
1.0
1.5
2.0
2.5
3.0
3.5
4.0
4.5
HC T -1 16
R
2
0.86
R
CV
2
0.77
AE
TR
0.19
AE
TS
0.16
1.52.02.53.03.54.0 4.5
1.5
2.0
2.5
3.0
3.5
4.0
4.5
MB 23 1
R
2
0.70
R
CV
2
0.66
AE
TR
0.34
AE
TS
0.29
1.52.02.53.03.54.0 4.55.0
1.5
2.0
2.5
3.0
3.5
4.0
4.5
A549
R
2
0.64
R
CV
2
0.56
AE
TR
0. 3 0
AE
TS
0.15
1.0 1.5 2. 0 2 .5 3 . 0 3 .5 4 . 0 4 .5 5 .0 5. 5
1. 5
2. 0
2. 5
3. 0
3. 5
4. 0
4. 5
5. 0
HO P -62
R
2
0.70
R
CV
2
0.66
AE
TR
0.42
AE
TS
0.19
2.9 3 .0 3.1 3.2 3.3 3 .4 3.5
2.8
2.9
3.0
3.1
3.2
3.3
3.4
3.5
3.6
KBvin
R
2
0.99
R
CV
2
0.98
AE
TR
0.01
AE
TS
0.01
1.0 1.5 2.0 2.5 3.0 3.5 4.0 4.5 5.0 5.5
2.0
2.5
3.0
3.5
4.0
4.5
MC F- 7
R
2
0.72
R
CV
2
0.65
AE
TR
0.35
AE
TS
0.17
1.0 1.5 2. 0 2.5 3.0 3.5
1.6
1.8
2.0
2.2
2.4
2.6
2.8
3.0
3.2
3.4
SN -12 C
R
2
0.60
R
CV
2
0.51
AE
TR
0.25
AE
TS
0.24
0. 5 1.0 1 . 5 2.0 2. 5 3 .0 3. 5 4.0 4 . 5 5.0 5. 5
2.0
2.5
3.0
3.5
4.0
4.5
5.0
DU-145
R
2
0.46
R
CV
2
0.43
AE
TR
0.49
AE
TS
0.12
1.52.02.53.03.54.0
1.5
2.0
2.5
3.0
3.5
OVCR-3
R
2
0.61
R
CV
2
0.29
AE
TR
0.25
AE
TS
0.40
b
1.01.21.41.61.82.02.22.42.62.83.03.2
1.0
1.2
1.4
1.6
1.8
2.0
2.2
2.4
2.6
2.8
S3
R
2
0.84
R
CV
2
0.75
AE
TR
0.15
AE
TS
0.07
2.93.03.13.23.33.43.5
2.8
2.9
3.0
3.1
3.2
3.3
3.4
3.5
3.6
S4
R
2
0.99
R
CV
2
0.98
AE
TR
0.01
AE
TS
0.01
2.0 2.5 3.0 3.5 4.0 4.5 5.0 5.5 6.0 6.5
1
2
3
4
5
6
S7
R
2
0.84
R
CV
2
0.75
AE
TR
0.39
AE
TS
0.35
1.01.52.02.53.03.54.04.55.0
1.0
1.5
2.0
2.5
3.0
3.5
4.0
4.5
5.0
S8
R
2
0.91
R
CV
2
0.88
AE
TR
0.25
AE
TS
0.19
2.02.53.03.54.04.5
2.0
2.5
3.0
3.5
4.0
S9
R
2
0.72
R
CV
2
0.64
AE
TR
0.28
AE
TS
0.29
1.0 1.5 2.0 2.5 3.0 3.5 4.0 4.5 5.0 5.5
2.0
2.5
3.0
3.5
4.0
4.5
5.0
5.5
S10
R
2
0.86
R
CV
2
0.74
AE
TR
0.26
AE
TS
0.15
Figure 3 Plot between experimenta l and predicted IC
50
values with correlation coefficient, cross-validation coefficient and average
residual for training and test set of molecules separately for (a) Cell line-based QSAR, (b) scaffold-based QSAR models.
Bohari et al . Organic and Medicinal Chemistry Letters 2011, 1:3
/>Page 9 of 12
statistical significance of various types of cancer has
been analysed (see Additional file 1 Table S84 for
details). It is interesting to note that nasopharyngeal (R
2
=0.90,R
cv
2
=0.84),lymphoma(R
2
= 0.84, R
cv
2
=0.75),
cervical (R
2
=0.83,R
cv
2
= 0.76), melanoma (R
2
= 0.81,
R
cv
2
=0.77),CNS(R
2
=0.81,R
cv
2
=0.75),fibroblast(R
2
= 0.79, R
cv
2
= 0.72) and colon (R
2
=0.77,R
cv
2
=0.69)
types of cancer show better statistical performance
(average R
2
= 0.82 and average R
cv
2
= 0.75) compared
with other types of cancer (glioblastoma, prostate,
breast, lung, blood , ovarian and renal; average R
2
=0.65
and average R
cv
2
= 0.57).
Conclusions
Within the present study, we assessed the predictive
power of QSAR approaches to model anti-cancer com-
pounds.Atotalof39QSARmodels,10fordifferent
scaffolds and 29 for different cell lines, were built to
assess the predictive power of QSAR models for anti-
cancer activity. Although analysis is done with various
models where the number of descriptors is increased
from 1 to 10, it is interesting to note that in most cases
3 descriptor-based models are adequate. The study
rev eals that quantum chem ical descrip tors are the most
important c lass of descriptors followed by electrostatic,
constitutional, geometrical, topological and conceptual
DFT descriptors. Charge-based descriptors prevailed
among the rest, followed by valency-based and bond
order-based descriptors. Thus, the current study high-
lights the importance of analogue-based designing
approaches in modelling anti-cancer com pounds. Con-
siderably, we did not make any assumptions about t he
site of interaction or mechanism of action of these com-
pounds yet were able to develop statistically robust
models for all experimentally tested compounds where
the correlation coefficient (R
2
) and cross-validation coef-
ficient (R
cv
2
) values are higher and average residuals
(AE) are lower in most cases. Cell lines in nasopharyn-
geal (2) cancer average R
2
= 0.90 followed by cell lines
in melanoma cancer (4) with average R
2
=0.81gavethe
best statistical values.
Methods
Details of the scaffold considered in the study along
with the cell lines against which experimental IC
50
values is reported with number of compounds in each
cell line is give n in Table 1. Two different sche mes
(scaffold- and cell line-base d) were followed for per-
forming QSAR studies. Scaffold-based QSAR studies
were carried out based on the availability of compounds
in various scaffolds (S1-S10) collected from ten different
studies. The cell line that provided the best regression
summary was used for making scaffold-based QSAR
models. See Tables S1-S10 in Additional file 1 for the
structure and the corresponding activity values of all the
compounds. Scheme 2 provides a schematic illustration
of workflow adopted in the manuscript for building and
validating various QSAR models. A total of 266 com-
pounds are collected along with their anti-cancer activity
against 29 cancer cell lines which belong to 10 different
chemical scaffolds (Scheme 1). All the structures were
initially optimized using semi-empi rical AM1 procedure
and later subjected to energy evaluations at B3LYP/6-
31G(d) level on AM1 geometries [42]. Important
descriptors were obtained using these B3LYP calcula-
tions by using the CODESSA [43] program in conjunc-
tion with the Gaussian output files. The 300 descriptors
obtained using the CODESSA prog ram can be divided
into different classes such as constitutional, topological,
geometrical, quantum chemical and thermodynamic. For
Figure 4 Classi fication of various descriptors involved in QSAR model. Numbers in parenthesis indicates the number of descriptors from
one group while numbers outside parenthesis indicates the occurrence of a particular type of descriptor in the models (see Additional file 1
Table S11 for the details of all the descriptors).
Bohari et al . Organic and Medicinal Chemistry Letters 2011, 1:3
/>Page 10 of 12
each compound these descriptors were calculated, and
non-significant descriptors were identified by heuristic
method and eliminated. The inter-correlation of the
descriptors in a ll the models was tested. Then, models
where the descriptors a re highly inter-correlated were
replaced and refined so that the descriptors employed in
a given model are virtually orthogonal to each other. In
order to find out the minimum number of descriptors
defining activity, we systematically developed 3 , 4 and 5
descriptor-based models for a ll sets of compounds,
using heurist ic method. It was found that three descr ip-
tor-based models are fairly satisfactory. Then all the
compounds were divided into two independent tests
(approx. 20%) and t raining set (app rox. 80%) using Pro-
ject Leader applicat ion associated with Scigress explorer
[44]. The statistical quality of the model was assessed by
various parameters like R
2
, R
2
cv
,AE,s, F, for both test
and training set. The validation of QSAR models was
done by examining the prediction of activity on test set
i.e. R
2
, R
2
cv
and AE. The effect of the number of
descriptors o n the correlation c oefficient was examined
on the training set o f molecules by running heuristic
method at 1-10 descriptors. Two different training and
test sets were developed to rule out chance correlation.
Scheme 2 illustrates the steps taken for developing the
final QSAR models in a schematic fashion.
Additional material
Additional file 1: The additional data file available with the online
version of the article contains following information: (a) Structure of
all the compounds used in this study (Tables S1-S10); (b) Full name of all
the descriptors involved in the study (Table S11); (c) The predicted
activity and descriptors values for all the models, the first test set (Tables
S12-S46); (d) Inter-correlation analysis of the descriptors (Table S47); (e)
The predicted activity and descriptors values for all the models, the
second test set (Tables S48-S82); (f) Regression summary for cell- line-
based and scaffold-based QSAR models pertaining to the second test set
(Table S83a and S83b); (g) Comparative statistical significance of various
cancer types (Table S84); (h) Figure of plot between the experimental
and predicted IC
50
values for the QSAR models where activity range was
narrow, based on cell lines and scaffold (Figure S1a,b).
Abbreviation
DFT: density functional theory.
Acknowledgements
HKS and GNS thank Department of Science and Technology (DST), New
Delhi for Fast-Track young scientist and Swarnajayanti fellowships,
respectively. The support from CSIR-IICT and NIPER (Hyderabad) is
acknowledged.
Competing interests
The authors declare that they have no competing interests.
Received: 7 April 2011 Accepted: 18 July 2011 Published: 18 July 2011
References
1. Gibbs JB (2000) Mechanism-based target identification and drug discovery
in cancer research. Science 287:1969–1973
2. Cragg GM, Grothaus PG, Newman DJ (2009) Impact of natural products on
developing new anti-cancer agents. Chem Rev 109:3012–3043
3. Hansch C, Leo A, Mekapati SB, Kurup A (2004) QSAR and ADME. Bioorg
Med Chem 12:3391–3400
4. Cronin MT, Dearden JC (1995) QSAR in toxicology. 2. Prediction of acute
mammalian toxicity and interspecies correlations. Quant Struct Act Relat
14:117–120
5. Mwense M, Wang XZ, Buontempo FV, Horan N, Young A, Osborn D (2006)
QSAR approach for mixture toxicity prediction using independent latent
descriptors and fuzzy membership functions. SAR QSAR Environ Res
17:53–73
6. Benigni R, Giuliani A (2003) Putting the predictive toxicology challenge into
perspective: reflections on the results. Bioinformatics 19:1194–1200
7. Zhao M, Li Z, Wu Y, Tang YR, Wang C, Zhang Z, Peng S (2007) Studies on
log P, retention time and QSAR of 2-substituted phenylnitronyl nitroxides as
free radical scavengers. Eur J Med Chem 42:955–965
8. Srivastava HK, Chourasia M, Kumar D, Sastry GN (2011) Comparison of
computational methods to model dna minor groove binders. J Chem Inf
Model 51:558–571
9. Reddy AS, Pati SP, Kumar PP, Pradeep HN, Sastry GN (2007) Virtual
screening in drug discovery–a computational perspective. Curr Protein Pept
Sci 8:329–351
10. Pasha FA, Muddassar M, Cho SJ (2009) Molecular docking and 3D QSAR
studies of Chk2 inhibitors. Chem Biol Drug Des 73:292–300
11. Srivastava HK, Pasha FA, Singh PP (2005) Atomic softness-based QSAR study
of testosterone. Int J Quant Chem 103:237–245
12. Srivani P, Sastry GN (2009) Potential choline kinase inhibitors: a molecular
modeling study of bis-quinolinium compounds. J Mol Graph Mod
27:676–688
13. Schultz TW, Cronin MTD, Walker JD, Aptula AO (2003) Quantitative
structure-activity relationships (QSARs) in toxicology: a historical perspective.
J Mol Struct 622:1–22
14. Karcher W, Devillers J, (eds) (1990) Kluwer Academic Publishers, Dordrecht,
Practical Applications of Quantitative Structure-Activity Relationships (QSAR).
Environmental Chemistry and Toxicology 1–12
Scheme 2 Flowchart of methodology adopted for building and
validating QSAR models.
Bohari et al . Organic and Medicinal Chemistry Letters 2011, 1:3
/>Page 11 of 12
15. Katritzky AR, Petrukhin R, Tatham D, Basak S, Benfenati E (2001)
Interpretation of quantitative structure-property and activity relationships. J
Chem Inf Comput Sci 41:679–685
16. Ravindra GK, Achaiah G, Sastry GN (2008) Molecular modeling studies of
phenoxy-pyrimidinyl imidazoles as p38 kinase inhibitors using QSAR and
docking. Eur J Med Chem 43:830–838
17. Janardhan S, Srivani P, Sastry GN (2006) 2D and 3D quantitative structure-
activity relationship studies on a series of bis-pyridinium compounds as
choline kinase inhibitors. QSAR Combi Sci 25:860–872
18. Kumar SH (2009) A comparative QSPR study of alkanes with the help of
computational chemistry. Bull Kor Chem Soc 30:67–76
19. de Jonge MR, Koymans LM, Vinkers HM, Daeyaert FF, Heeres J, Lewi PJ,
Janssen PA (2005) Structure based activity prediction of HIV-1 reverse
transcriptase inhibitors. J Med Chem 48:2176–2183
20. Miguet L, Zervosen A, Gerards T, Pasha FA, Luxen A, Disteche-Nguyen M,
Thomas A (2010) Discovery of new inhibitors of resistant streptococcus
pneumoniae penicillin binding protein (PBP) 2x by structure-based virtual
screening. J Med Chem 52:5926–5936
21. Liao SY, Chen C, Qian L, Shen Y, Zheng KC (2008) QSAR studies and
molecular design of phenanthrene-based tylophorine derivatives with
anticancer activity. QSAR Combi Sci 27:280–288
22. Sivaprakasam P, Xie A, Doerksen RJ (2006) Probing the physicochemical and
structural requirements for glycogen synthase kinase-3α inhibition: 2D-QSAR
for 3-anilino-4-phenylmaleimides. Bioo Med Chem 14:8210–8218
23. Chen JC, Shen Y, Liao SY, Chen LM, Zheng KC (2007) DFT-based QSAR
study and molecular design of AHMA derivatives as potent anticancer
agents. Int J Quant Chem 107:1468–1478
24. Zhang S, Wei L, Bastow K, Zheng W, Brossi A, Lee KH, Tropsha A (2007)
Application of validated QSAR models to database mining: discovery of
novel tylophorine derivative as potential anticancer agents. J Comput Aided
Mol Des 21:97–112
25. Parr RG, Szentpály Lv, Liu S (1999) Electrophilicity index. J Am Chem Soc
121:1922–1924
26. Chermette H (1999) Chemical reactivity indexes in density functional theory.
J Comp Chem 20:129–154
27. Chattaraj PK, Maiti B, Sarkar U (2003) Philicity: a unified treatment of
chemical reactivity and selectivity. J Phys Chem A 107:4973
28. Chattaraj PK, Roy DR (2005) Local descriptors around a transition state: a
link between chemical bonding and reactivity. J Phys Chem A 109:3771
29. Karelson M, Lobanov VS, Katritzky AR (1996) Quantum-chemical descriptors
in QSAR/QSPR studies. Chem Rev 96:1027–1043
30. DeProft F, Geerlings P (1997) Calculation of ionization energies, electron
affinities, electronegativities, and hardnesses using density functional
methods. J Chem Phys 106:3270–3279
31. Ooma F (2000) Molecular modeling and computer aided drug design.
Examples of their application in medicinal chemistry. Curr Med Chem
7:141–158
32. Quaquebeke EV, Mahieu T, Dumont P, Dewelle J, Ribaucour F, Simon G,
Sauvage S, Gaussin JF, Tuti JE, Yazidi M, Vynckt FV, Mijatovic T, Lefranc F,
Darro F, Kiss R (2007) 2,2,2-Trichloro-N-({2-[2-(dimethylamino)ethyl]-1,3-
dioxo-2,3-dihydro-1H-benzo[de]isoquinolin-5-yl}carbamoyl)acetamide
(UNBS3157), a novel nonhematotoxic naphthalimide derivative with potent
antitumor activity. J Med Chem 50:4122–4134
33. Qiu XL, Li G, Wu G, Zhu J, Zhou L, Chen PL, Chamberlin AR, Lee WH (2009)
Synthesis and biological evaluation of a series of novel inhibitor of Nek2/
Hec1 analogues. J Med Chem 52:1757–1767
34. Peterson QP, Hsu DC, Goode DR, Novotny CJ, Totten RK, Hergenrother PJ
(2009) Procaspase-3 activation as an anti-cancer strategy: structure-activity
relationship of procaspase-activating compound 1 (PAC-1) and its cellular
co-localization with caspase-3. J Med Chem 52:5721–5731
35. Yang X, Shi Q, Liu Y, Zhao G, Bastow KF, Lin J, Yang S, Yang P, Lee K (2009)
Design, synthesis, and mechanistic studies of new 9-substituted
phenanthrene-based tylophorine analogues as potent cytotoxic agents. J
Med Chem 52:5262–5268
36. Shah BL, Kaur B, Gupta P, Kumar A, Sethi VK, Andotra SS, Singh J,
Saxena AK, Taneja SC (2009) Structure-activity relationship (SAR) of
parthenin analogues with pro-apoptotic activity: development of novel
anti-cancer leads. Bioorg Med Chem Lett 19:4394–4398
37. Lu Y, Wang Z, Li C, Chen J, Dalton JT, Li W, Miller DD (2010) Synthesis, in
vitro structure-activity relationship, and in vivo studies of 2-arylthiazolidine-
4-carboxylic acid amides as anticancer agents. Bioorg Med Chem
18:477–
495
38. Tsoua H, MacEwan G, Birnberg G, Grosu G, Bursavich MG, Bard J,
Brooijmansa N, Toral-Barzab L, Hollanderb I, Mansoura TS, Ayral-
Kaloustiana S, Yub K (2010) Discovery and optimization of 2-(4-substituted-
pyrrolo[2,3-b]pyridin-3-yl)methylene-4-hydroxybenzofuran-3(2H)-ones as
potent and selective ATP-competitive inhibitors of the mammalian target of
rapamycin (mTOR). Bioorg Med Chem lett 20:2321–2325
39. Lu Y, Li C, Wang Z, Ross CRII, Chen J, Dalton JT, Li W, Miller DD (2009)
Discovery of 4-substituted methoxybenzoyl-aryl-thiazole as novel anticancer
agents: synthesis, biological evaluation, and structure-activity relationships. J
Med Chem 52:1701–1711
40. Jourdan F, Leese MP, Dohle W, Hamel E, Ferrandis E, Newman SP,
Purohit A, Reed MJ, Potter BVL (2010) Synthesis, antitubulin, and
antiproliferative SAR of analogues of 2-methoxyestradiol-3,17-O,O-bis-
sulfamate. J Med Chem 53:2942–2951
41. Cinelli MA, Morrel AE, Dexheimer TS, Agama K, Agarwal S, Pommier Y,
Cushman M (2010) The structure-activity relationships of A-ring-substituted
aromathecin topoisomerase I inhibitors strongly support a camptothecin-
like binding mode. Bioorg Med Chem 18:5535–5552
42. Frisch MJ., et al (2003) Gaussian 03, revision E.0.1. Gaussian, Inc., Pittsburgh,
PA
43. Katritzky AR, Lobanov VS, Karelson M (1994) CODESSA 2.0, comprehensive
descriptors for structural and statistical analysis. University of Florida
44. Scigress Explorer version 7.7; Fujitsu: Tokyo, Japan.
doi:10.1186/2191-2858-1-3
Cite this article as: Bohari et al.: Analogue-based approaches in anti-
cancer compound modelling: the relevance of QSAR models. Organic
and Medicinal Chemistry Letters 2011, 1:3.
Submit your manuscript to a
journal and benefi t from:
7 Convenient online submission
7 Rigorous peer review
7 Immediate publication on acceptance
7 Open access: articles freely available online
7 High visibility within the fi eld
7 Retaining the copyright to your article
Submit your next manuscript at 7 springeropen.com
Bohari et al . Organic and Medicinal Chemistry Letters 2011, 1:3
/>Page 12 of 12