Management and Services Part 3 docx
Bạn đang xem bản rút gọn của tài liệu. Xem và tải ngay bản đầy đủ của tài liệu tại đây (331.44 KB, 7 trang )
An empirical research of ITESCM
(integrated tertiary educational supply chain management) model 7
The researcher develops a conceptual framework of educational supply chain for the
universities. The resulting model is finally evaluated for accuracy and validity through the
Structural Equation Modeling (SEM) technique (Habib, 2009; Habib & Jungthirapanich,
2010b). For providing the clear conception of the conceptual framework, the researcher
depicts holistic view of educational supply chain in Figure 2. In this supply chain, raw
materials are students as well as internal and external projects. Finished products are
graduates and research outcomes (Habib and Jungthirapanich, 2009d). In this framework,
single-level, bi-directional simplified form of supply chain management has been
formulated for the universities, as shown in Figure 3. In the higher educational institutions,
since a single party is unable to do anything, the researcher involves different parties to
achieve final outcomes. Customers can closely monitor the value added by service
providers. When customers supply major inputs, they know exactly what condition those
inputs are. Then, when they subsequently receive the output from the service provider, they
can easily assess the amount of value added by the service provider.
Fig. 2. Holistic view of educational supply chain
However, it is very difficult to determine the supplier and customer of the intangible
product in the service industry. Suppliers, the service provider, customers, and the
consumer have been identified in this research. This exploratory study also identifies
supplied inputs, customer-consuming output (O/P), customer-supplying input (I/O) and
finally supplied outputs (Habib and jungthirapanich, 2010e).
Fig. 3. Simplified form of supply chain management for the universities
Figure 4 illustrates an education supply chain and a research supply chain, which together
form the integrated supply chain for the universities to produce quality outcomes. The three
decision levels including strategic, planning and operating level in the university have been
explored in this research model. These three decision phases build up an integrated form of
educational supply chain for the universities. The performance of this supply chain depends
on the quality of the graduates with desirable quality and quality research outcomes of the
university.
A. Suppliers
In the conceptual model, the researcher identified two major parts in the suppliers, namely
education suppliers and research suppliers for the universities (Habib and Jungthirapanich,
2009e; Habib, 2010b; Habib and Jungthirapanich, 2010d).
Education Suppliers: Suppliers of the student (High school/college), suppliers of the faculty
(other universities), Self funding students, source of fund – family (parents, siblings),
relatives, etc. government and private organizations (scholarship), suppliers of assets or
equipment (furniture, computer, networking equipment, etc.), suppliers of educational
materials (stationery, instruction materials, etc.).
Research Suppliers: Suppliers of internal research projects (university self funding), suppliers
of external research projects (external research funds, Ministry of education, private
organizations, etc.).
Fig. 4. An integrated supply chain for the universities
Management and Services 8
B. A Service Provider
A university is regarded as a service provider in this paper. The researcher identified two
major wings including development and assessment for both education and research in the
university. Fig. 3 represents educational supply chain for the universities in four aspects,
including programs establishment, university culture, faculty capabilities, and facilities, are
considered for development and assessment in both education and research part. The final
outcomes of the university, i.e. graduates and research outcomes are delivered to the society
(Habib and Jungthirapanich, 2010c).
C. Customers
In the conceptual model, the researcher identified two major parts in the customers namely
education customers and research customers for the universities (Habib and
Jungthirapanich, 2008b; Habib, 2009). Some of the graduates would be added in the service
provider as the supplied input. On the other hand, some graduates would be acted as the
supplied output to the end customer. Therefore, the researcher also identified graduates as
the supplying input customer in this supply chain.
Education Customers: Graduates, family (parents, siblings, relatives, etc.), employers of
government and private organizations
Research Customers: Funding organizations of research projects, research outcomes
(researchers, research publications, findings etc.), Others (research professional
organizations -IEEE, INFORMS, ACM, Society of manufacturing engineers etc. and Trade
associations -American trade association, Grocery manufacturers association, etc.).
D. Consumer
The researcher identifies the society as the end customer or the consumer in this educational
supply chain. As universities are the part of the society, the final outcomes of this supply
chain, including graduates with desirable quality and quality research outcomes are
delivered to the society (Habib and Jungthirapanich, 2008a, 2009c, 2009e).
4.1 Final Outcomes
Graduates with Desirable Quality
Graduates with desirable quality is one of the final outcomes in the educational supply
chain management. Benchmarking and value enhancement determinants are identified and
incorporated in the process of the university to produce graduates with desirable quality.
(a) Graduates benchmarking includes knowledge (tacit or explicit), skills, competencies,
capabilities, ethics, career development programs, etc.
(b) Graduates value enhancement includes source of fund (self-funding, scholarship, etc.),
wisdom, faculty capabilities, facilities, Information & Communication Technology (ICT),
research involvements, etc.
Quality Research Outcomes
The author defined another final outcome of the educational supply chain management is
quality research outcomes. The university develops strategic plans for multidisciplinary
research to maintain an emphasis on research as an important component of the academic
mission of the university. Research outcomes may include problem solution, pure theory,
internal and external projects applications, thesis findings, research publications, or research
findings, etc.
4.2 ITESCM Model
From the literature review, the researcher develops the proposed ITESCM (Integrated
Tertiary Educational Supply Chain Management) model for the universities. This model
depicts the integrated form of educational supply chain and educational management for
the universities in the following Figure 5. Educational supply chain also consists of
education supply chain and research supply chain.
Fig. 5. Integrated Tertiary Educational Supply Chain Management (ITESCM) model for the
universities
An empirical research of ITESCM
(integrated tertiary educational supply chain management) model 9
B. A Service Provider
A university is regarded as a service provider in this paper. The researcher identified two
major wings including development and assessment for both education and research in the
university. Fig. 3 represents educational supply chain for the universities in four aspects,
including programs establishment, university culture, faculty capabilities, and facilities, are
considered for development and assessment in both education and research part. The final
outcomes of the university, i.e. graduates and research outcomes are delivered to the society
(Habib and Jungthirapanich, 2010c).
C. Customers
In the conceptual model, the researcher identified two major parts in the customers namely
education customers and research customers for the universities (Habib and
Jungthirapanich, 2008b; Habib, 2009). Some of the graduates would be added in the service
provider as the supplied input. On the other hand, some graduates would be acted as the
supplied output to the end customer. Therefore, the researcher also identified graduates as
the supplying input customer in this supply chain.
Education Customers: Graduates, family (parents, siblings, relatives, etc.), employers of
government and private organizations
Research Customers: Funding organizations of research projects, research outcomes
(researchers, research publications, findings etc.), Others (research professional
organizations -IEEE, INFORMS, ACM, Society of manufacturing engineers etc. and Trade
associations -American trade association, Grocery manufacturers association, etc.).
D. Consumer
The researcher identifies the society as the end customer or the consumer in this educational
supply chain. As universities are the part of the society, the final outcomes of this supply
chain, including graduates with desirable quality and quality research outcomes are
delivered to the society (Habib and Jungthirapanich, 2008a, 2009c, 2009e).
4.1 Final Outcomes
Graduates with Desirable Quality
Graduates with desirable quality is one of the final outcomes in the educational supply
chain management. Benchmarking and value enhancement determinants are identified and
incorporated in the process of the university to produce graduates with desirable quality.
(a) Graduates benchmarking includes knowledge (tacit or explicit), skills, competencies,
capabilities, ethics, career development programs, etc.
(b) Graduates value enhancement includes source of fund (self-funding, scholarship, etc.),
wisdom, faculty capabilities, facilities, Information & Communication Technology (ICT),
research involvements, etc.
Quality Research Outcomes
The author defined another final outcome of the educational supply chain management is
quality research outcomes. The university develops strategic plans for multidisciplinary
research to maintain an emphasis on research as an important component of the academic
mission of the university. Research outcomes may include problem solution, pure theory,
internal and external projects applications, thesis findings, research publications, or research
findings, etc.
4.2 ITESCM Model
From the literature review, the researcher develops the proposed ITESCM (Integrated
Tertiary Educational Supply Chain Management) model for the universities. This model
depicts the integrated form of educational supply chain and educational management for
the universities in the following Figure 5. Educational supply chain also consists of
education supply chain and research supply chain.
Fig. 5. Integrated Tertiary Educational Supply Chain Management (ITESCM) model for the
universities
Management and Services 10
5. ITESCM Model Evaluation
The proposed ITESCM (Integrated Tertiary Educational Supply Chain Management) model
is the integrated form of educational management and educational supply chain for the
universities. There are two main contributions of the universities to the society, namely
education and research. Both contributions are further categorized into development and
assessment. Each category is analyzed in four different aspects, namely programs
establishment, university culture, faculty capabilities, facilities at three decision levels,
including strategic, planning, and operating levels. To enhance customer satisfaction,
generating quality outcomes for the betterment of the end customer, i.e. the society, the
author developed this research model for the universities.
5.1 Educational Management
In the educational management, the researcher defines education development, education
assessment, research development and research assessment for the universities to provide
the conclusion of research issue items. From the research results, they show the significant
relationships among four aspects in educational management to produce quality graduates
and quality research outcomes. The authors represent model A and B in this section. Model
A stands for graduates and model B represents research outcomes. From the research
model, the following hypotheses are established. Hypotheses 1 and 2 stand for graduates
and hypotheses 3 and 4 for research outcomes.
H
1
: There is a relationship between education development and graduates.
H
2
: There is a relationship between education assessment and graduates.
H
3
: There is a relationship between research development and research outcomes.
H
4
: There is a relationship between research assessment and research outcomes.
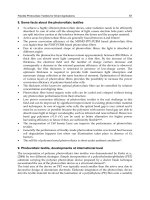
5.1.1 Model A: Graduates
The researcher identified graduates as final outcomes of the education part in the university.
Education part is divided into two segments including education development and
education assessment. Model 3 contains group 1 and group 2. Group 1 is defined as the
education development in the model 3. There are four subgroups, including subgroup 1,
subgroup 2, subgroup 3 and subgroup 4 those are representing programs establishment,
university culture, faculty capabilities and facilities respectively.
On the other hand, group 2 stands for the education assessment in the model 3. There are 4
subgroups, namely subgroup 5, subgroup 6, subgroup 7 and subgroup 8 those are
representing programs establishment, university culture, faculty capabilities and facilities
respectively. Figure 6 illustrates the inter relationships among different variables to justify
the hypothesis 1 and 2 by SEM through AMOS.
Multiple Linear Regression (MLR) Equations
F
Group 1
= 0.63 f
subgroup 1
+ 0.70 f
subgroup 2
+ 0.65 f
subgroup 3
+ 0.63 f
subgroup 4
(1)
F
Group 2
= 0.68 f
subgroup 5
+ 0.74 f
subgroup 6
+ 0.69 f
subgroup 7
+ 0.66 f
subgroup 8
(2)
F
Graduates
= 0.97 F
Group 1
+ 0.92 F
Group 2
(3)
Fig. 6. AMOS Graphics Output of Model A (Standardized Estimates)
From the research findings, equation (1) states that university culture (sub group 2) is the
most significant factor in education development. On the other hand, equation (2) represents
that university culture (sub group 6) is highly contributed to education assessment. Finally,
equation (3) depicts that education development is highly contributed to produce quality
graduates in the universities. From equation (1), (2) and (3),
F
Graduates
= 0.97 F
Group 1
+ 0.92 F
Group 2
= 0.97 [0.63 f
subgroup 1
+ 0.70 f
subgroup 2
+ 0.65 f
subgroup 3
+ 0.63 f
subgroup 4
]
+ 0.92 [0.68 f
subgroup 5
+ 0.74 f
subgroup 6
+ 0.69 f
subgroup 7
+ 0.66 f
subgroup 8
]
= 0.61 f
subgroup 1
+ 0.68 f
subgroup 2
+ 0.63 f
subgroup 3
+ 0.61 f
subgroup 4
+ 0.63 f
subgroup 5
+
0.68 f
subgroup 6
+ 0.63 f
subgroup 7
+ 0.61 f
subgroup 8
(4)
The above equation shows the significant relationship among all factors namely programs
establishment, university culture, faculty capabilities, and facilities in education
development as well as education assessment to produce the graduates. University culture
at education development and education assessment is highly contributed to produce the
graduates in the universities.
Model Fit Index
Chi-square = 169.792, Degrees of freedom =19, Probability level = 0.000, CMIN/DF = 8.936
(Ratio of relative chi-square close to 5 indicates reasonable fit) (Wheaton and et al., 1997),
RMSEA (Root Mean Square Error of Approximation) = 0.127, NFI (Normed Fit Index) = 0.880,
CFI = 0.891 (NFI and CFI (Comparative Fit Index) values close to 1 indicate a very good fit)
(Bentler, 1990).
The equation (3), (4), graphics output and above all statistical discussion on AMOS magnifies
that hypotheses 1 and 2 fail to reject and states that there are significant relationship between
education development and graduates as well as education assessment and graduates.
.39
Sub Grou
p
1
.49
Sub Grou
p
2
.42
Sub Grou
p
3
.39
Sub Grou
p
4
.94
Grou
p
1
err 28
err 27
err 26
err 25
.63
.70
.65
.63
.46
Sub Grou
p
5
.54
Sub Grou
p
6
.47
Sub Grou
p
7
.44
Sub Grou
p
8
.84
Grou
p
2
err 32
err 31
err 30
err 29
.68
.74
.69
.66
Graduates
.97
.92
err 33
err 34
An empirical research of ITESCM
(integrated tertiary educational supply chain management) model 11
5. ITESCM Model Evaluation
The proposed ITESCM (Integrated Tertiary Educational Supply Chain Management) model
is the integrated form of educational management and educational supply chain for the
universities. There are two main contributions of the universities to the society, namely
education and research. Both contributions are further categorized into development and
assessment. Each category is analyzed in four different aspects, namely programs
establishment, university culture, faculty capabilities, facilities at three decision levels,
including strategic, planning, and operating levels. To enhance customer satisfaction,
generating quality outcomes for the betterment of the end customer, i.e. the society, the
author developed this research model for the universities.
5.1 Educational Management
In the educational management, the researcher defines education development, education
assessment, research development and research assessment for the universities to provide
the conclusion of research issue items. From the research results, they show the significant
relationships among four aspects in educational management to produce quality graduates
and quality research outcomes. The authors represent model A and B in this section. Model
A stands for graduates and model B represents research outcomes. From the research
model, the following hypotheses are established. Hypotheses 1 and 2 stand for graduates
and hypotheses 3 and 4 for research outcomes.
H
1
: There is a relationship between education development and graduates.
H
2
: There is a relationship between education assessment and graduates.
H
3
: There is a relationship between research development and research outcomes.
H
4
: There is a relationship between research assessment and research outcomes.
5.1.1 Model A: Graduates
The researcher identified graduates as final outcomes of the education part in the university.
Education part is divided into two segments including education development and
education assessment. Model 3 contains group 1 and group 2. Group 1 is defined as the
education development in the model 3. There are four subgroups, including subgroup 1,
subgroup 2, subgroup 3 and subgroup 4 those are representing programs establishment,
university culture, faculty capabilities and facilities respectively.
On the other hand, group 2 stands for the education assessment in the model 3. There are 4
subgroups, namely subgroup 5, subgroup 6, subgroup 7 and subgroup 8 those are
representing programs establishment, university culture, faculty capabilities and facilities
respectively. Figure 6 illustrates the inter relationships among different variables to justify
the hypothesis 1 and 2 by SEM through AMOS.
Multiple Linear Regression (MLR) Equations
F
Group 1
= 0.63 f
subgroup 1
+ 0.70 f
subgroup 2
+ 0.65 f
subgroup 3
+ 0.63 f
subgroup 4
(1)
F
Group 2
= 0.68 f
subgroup 5
+ 0.74 f
subgroup 6
+ 0.69 f
subgroup 7
+ 0.66 f
subgroup 8
(2)
F
Graduates
= 0.97 F
Group 1
+ 0.92 F
Group 2
(3)
Fig. 6. AMOS Graphics Output of Model A (Standardized Estimates)
From the research findings, equation (1) states that university culture (sub group 2) is the
most significant factor in education development. On the other hand, equation (2) represents
that university culture (sub group 6) is highly contributed to education assessment. Finally,
equation (3) depicts that education development is highly contributed to produce quality
graduates in the universities. From equation (1), (2) and (3),
F
Graduates
= 0.97 F
Group 1
+ 0.92 F
Group 2
= 0.97 [0.63 f
subgroup 1
+ 0.70 f
subgroup 2
+ 0.65 f
subgroup 3
+ 0.63 f
subgroup 4
]
+ 0.92 [0.68 f
subgroup 5
+ 0.74 f
subgroup 6
+ 0.69 f
subgroup 7
+ 0.66 f
subgroup 8
]
= 0.61 f
subgroup 1
+ 0.68 f
subgroup 2
+ 0.63 f
subgroup 3
+ 0.61 f
subgroup 4
+ 0.63 f
subgroup 5
+
0.68 f
subgroup 6
+ 0.63 f
subgroup 7
+ 0.61 f
subgroup 8
(4)
The above equation shows the significant relationship among all factors namely programs
establishment, university culture, faculty capabilities, and facilities in education
development as well as education assessment to produce the graduates. University culture
at education development and education assessment is highly contributed to produce the
graduates in the universities.
Model Fit Index
Chi-square = 169.792, Degrees of freedom =19, Probability level = 0.000, CMIN/DF = 8.936
(Ratio of relative chi-square close to 5 indicates reasonable fit) (Wheaton and et al., 1997),
RMSEA (Root Mean Square Error of Approximation) = 0.127, NFI (Normed Fit Index) = 0.880,
CFI = 0.891 (NFI and CFI (Comparative Fit Index) values close to 1 indicate a very good fit)
(Bentler, 1990).
The equation (3), (4), graphics output and above all statistical discussion on AMOS magnifies
that hypotheses 1 and 2 fail to reject and states that there are significant relationship between
education development and graduates as well as education assessment and graduates.
.39
Sub Grou
p
1
.49
Sub Grou
p
2
.42
Sub Grou
p
3
.39
Sub Grou
p
4
.94
Grou
p
1
err 28
err 27
err 26
err 25
.63
.70
.65
.63
.46
Sub Grou
p
5
.54
Sub Grou
p
6
.47
Sub Grou
p
7
.44
Sub Grou
p
8
.84
Grou
p
2
err 32
err 31
err 30
err 29
.68
.74
.69
.66
Graduates
.97
.92
err 33
err 34
Management and Services 12
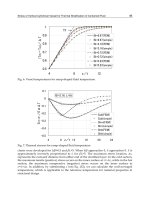
5.1.2 Model B: Research Outcomes
The author identified research outcomes as final outcomes in the research wing of the
university. This part is divided into two segments including research development and
research assessment. The model 6 contains two groups including group 3 and group 4.
Group 3 is defined as the research development in this model. There are four subgroups,
namely subgroup 9, subgroup 10, subgroup 11 and subgroup 12, those are representing
programs establishment, university culture, faculty capabilities and facilities respectively.
On the other hand, group 4 stands for the research assessment in this model. There are four
subgroups, namely subgroup 13, subgroup 14, subgroup 15 and subgroup 16, those are
representing programs establishment, university culture, faculty capabilities and facilities
respectively.
Fig. 7. AMOS Graphics Output of Model B (Standardized Estimates)
Figure 7 illustrates the inter relationships among different variables to justify the hypothesis
3 and 4 by SEM through AMOS.
Multiple Linear Regression (MLR) Equations
F
Group 3
= 0.60 f
subgroup 9
+ 0.71 f
subgroup 10
+ 0.63 f
subgroup 11
+ 0.67 f
subgroup 12
(5)
F
Group 4
= 0.67 f
subgroup 13
+ 0.72 f
subgroup 14
+ 0.74 f
subgroup 15
+ 0.69 f
subgroup 16
(6)
F
Research Outcomes
= 0.99 F
Group 3
+ 0.89 F
Group 4
(7)
From the research findings, equation (5) states that university culture (sub group 10) is the
most significant factor in research development. On the other hand, equation (6) represents
that faculty capabilities (sub group 15) are highly contributed to research assessment.
Finally, equation (7) depicts that research development is highly contributed to produce
research outcomes in the universities.
.36
Sub Grou
p
9
.51
Sub Grou
p
10
.40
Sub Grou
p
11
.45
Sub Grou
p
12
.98
Grou
p
3
err 70
err 69
err 68
err 67
.60
.71
.63
.67
.46
Sub Grou
p
13
.52
Sub Grou
p
14
.54
Sub Grou
p
15
.47
Sub Grou
p
16
.
79
Grou
p
4
err 74
err 73
err 72
err 71
.
6
7
.72
.74
.
69
Research
Outcomes
.99
.89
err 75
err 76
From equation (5), (6) and (7),
F
Research Outcomes
= 0.99 F
Group 3
+ 0.89 F
Group 4
= 0.99 [0.60 f
subgroup 9
+ 0.71 f
subgroup 10
+ 0.63 f
subgroup 11
+ 0.67 f
subgroup12
+ 0.89 [0.67 f
subgroup 13
+ 0.72 f
subgroup 14
+ 0.74 f
subgroup 15
+ 0.69 f
subgroup 16
]
= 0.59 f
subgroup 9
+ 0.70 f
subgroup 10
+ 0.62 f
subgroup 11
+ 0.66 f
subgroup12
+
0.60 f
subgroup 13
+ 0.64 f
subgroup 14
+ 0.66 f
subgroup 15
+ 0.61 f
subgroup 16
(8)
From the research results of equation (8), they show the significant relationships among four
aspects, namely programs establishment, university culture, faculty capabilities, and
facilities in research development as well as research assessment to produce the research
outcomes in the universities. University culture and facilities in research development as
well as faculty capabilities in research assessment are highly contributed to produce the
research outcomes in the universities.
Model Fit Index
Chi-square = 189.828, Degrees of freedom = 19, Probability level = 0.000, CMIN/DF = 9.991,
RMSEA = 0.135, NFI = 0.872, CFI = 0.883 (NFI and CFI values close to 1 indicate a very good
fit) (Bentler, 1990).
The equation (7), (8), graphics output and above all statistical discussion on AMOS rectifies that
hypotheses 3 and 4 fail to reject and states that there are significant relationship between research
development and research outcomes as well as research assessment and research outcomes.
5.2 Educational Supply Chain
The author represents model C and D in this section. Model C stands for supplied inputs
and model D represents supplied outputs. Hypotheses 5 and 6 stand for supplied inputs
and hypotheses 7 to 10 for supplied outputs.
H
5
: There is a relationship between education suppliers and students in the universities.
H
6
: There is a relationship between research suppliers and research projects in the universities.
H
7
: There is a relationship between graduates and education customers.
H
8
: There is a relationship between research outcomes and research customers.
H
9
: There is a relationship between education customers and the society.
H
10
: There is a relationship between research customers and the society.
In the educational supply chain, the researcher defines supplied inputs to the university,
supplied outputs of the universities to provide the conclusion of research issue items. From
the research results, they show the significant relationships among different variables in
educational supply chain to produce quality graduates and quality research outcomes for
the betterment of the society.
5.2.1 Model C - Supplied Inputs
In model C, there are two main inputs for the universities, namely students and research
projects that have been evolved from education suppliers and research suppliers
respectively. Figure 8 illustrates the inter relationships among different variables to justify
the hypotheses 5 and 6 by SEM through AMOS. MLR equations:
An empirical research of ITESCM
(integrated tertiary educational supply chain management) model 13
5.1.2 Model B: Research Outcomes
The author identified research outcomes as final outcomes in the research wing of the
university. This part is divided into two segments including research development and
research assessment. The model 6 contains two groups including group 3 and group 4.
Group 3 is defined as the research development in this model. There are four subgroups,
namely subgroup 9, subgroup 10, subgroup 11 and subgroup 12, those are representing
programs establishment, university culture, faculty capabilities and facilities respectively.
On the other hand, group 4 stands for the research assessment in this model. There are four
subgroups, namely subgroup 13, subgroup 14, subgroup 15 and subgroup 16, those are
representing programs establishment, university culture, faculty capabilities and facilities
respectively.
Fig. 7. AMOS Graphics Output of Model B (Standardized Estimates)
Figure 7 illustrates the inter relationships among different variables to justify the hypothesis
3 and 4 by SEM through AMOS.
Multiple Linear Regression (MLR) Equations
F
Group 3
= 0.60 f
subgroup 9
+ 0.71 f
subgroup 10
+ 0.63 f
subgroup 11
+ 0.67 f
subgroup 12
(5)
F
Group 4
= 0.67 f
subgroup 13
+ 0.72 f
subgroup 14
+ 0.74 f
subgroup 15
+ 0.69 f
subgroup 16
(6)
F
Research Outcomes
= 0.99 F
Group 3
+ 0.89 F
Group 4
(7)
From the research findings, equation (5) states that university culture (sub group 10) is the
most significant factor in research development. On the other hand, equation (6) represents
that faculty capabilities (sub group 15) are highly contributed to research assessment.
Finally, equation (7) depicts that research development is highly contributed to produce
research outcomes in the universities.
.36
Sub Grou
p
9
.51
Sub Grou
p
10
.40
Sub Grou
p
11
.45
Sub Grou
p
12
.98
Grou
p
3
err 70
err 69
err 68
err 67
.60
.71
.63
.67
.46
Sub Grou
p
13
.52
Sub Grou
p
14
.54
Sub Grou
p
15
.47
Sub Grou
p
16
.
79
Grou
p
4
err 74
err 73
err 72
err 71
.
6
7
.72
.74
.
69
Research
Outcomes
.99
.89
err 75
err 76
From equation (5), (6) and (7),
F
Research Outcomes
= 0.99 F
Group 3
+ 0.89 F
Group 4
= 0.99 [0.60 f
subgroup 9
+ 0.71 f
subgroup 10
+ 0.63 f
subgroup 11
+ 0.67 f
subgroup12
+ 0.89 [0.67 f
subgroup 13
+ 0.72 f
subgroup 14
+ 0.74 f
subgroup 15
+ 0.69 f
subgroup 16
]
= 0.59 f
subgroup 9
+ 0.70 f
subgroup 10
+ 0.62 f
subgroup 11
+ 0.66 f
subgroup12
+
0.60 f
subgroup 13
+ 0.64 f
subgroup 14
+ 0.66 f
subgroup 15
+ 0.61 f
subgroup 16
(8)
From the research results of equation (8), they show the significant relationships among four
aspects, namely programs establishment, university culture, faculty capabilities, and
facilities in research development as well as research assessment to produce the research
outcomes in the universities. University culture and facilities in research development as
well as faculty capabilities in research assessment are highly contributed to produce the
research outcomes in the universities.
Model Fit Index
Chi-square = 189.828, Degrees of freedom = 19, Probability level = 0.000, CMIN/DF = 9.991,
RMSEA = 0.135, NFI = 0.872, CFI = 0.883 (NFI and CFI values close to 1 indicate a very good
fit) (Bentler, 1990).
The equation (7), (8), graphics output and above all statistical discussion on AMOS rectifies that
hypotheses 3 and 4 fail to reject and states that there are significant relationship between research
development and research outcomes as well as research assessment and research outcomes.
5.2 Educational Supply Chain
The author represents model C and D in this section. Model C stands for supplied inputs
and model D represents supplied outputs. Hypotheses 5 and 6 stand for supplied inputs
and hypotheses 7 to 10 for supplied outputs.
H
5
: There is a relationship between education suppliers and students in the universities.
H
6
: There is a relationship between research suppliers and research projects in the universities.
H
7
: There is a relationship between graduates and education customers.
H
8
: There is a relationship between research outcomes and research customers.
H
9
: There is a relationship between education customers and the society.
H
10
: There is a relationship between research customers and the society.
In the educational supply chain, the researcher defines supplied inputs to the university,
supplied outputs of the universities to provide the conclusion of research issue items. From
the research results, they show the significant relationships among different variables in
educational supply chain to produce quality graduates and quality research outcomes for
the betterment of the society.
5.2.1 Model C - Supplied Inputs
In model C, there are two main inputs for the universities, namely students and research
projects that have been evolved from education suppliers and research suppliers
respectively. Figure 8 illustrates the inter relationships among different variables to justify
the hypotheses 5 and 6 by SEM through AMOS. MLR equations: