Báo cáo hóa học: " Mechanics of lipid bilayer junctions affecting the size of a connecting lipid nanotube" pptx
Bạn đang xem bản rút gọn của tài liệu. Xem và tải ngay bản đầy đủ của tài liệu tại đây (415.8 KB, 6 trang )
NANO EXPRESS Open Access
Mechanics of lipid bilayer junctions affecting the
size of a connecting lipid nanotube
Roger Karlsson
1
, Michael Kurczy
2
, Richards Grzhibovskis
3
, Kelly L Adams
4,1
, Andrew G Ewing
1
, Ann-Sofie Cans
2
and
Marina V Voinova
5*
Abstract
In this study we report a physical analysis of the membrane mechanics affecting the size of the highly curved
region of a lipid nanotube (LNT) that is either connected between a lipid bilayer vesicle and the tip of a glass
microinjection pipette (tube-only) or between a lipid bilayer vesicle and a vesicle that is attached to the tip of a
glass microinjection pipette (two-vesicle). For the tube-only configuration (TOC), a micropipette is used to pull a
LNT into the interior of a surface-immobilized vesicle, where the length of the tube L is determined by the
distance of the micropipette to the vesicle wall. For the two-vesicle configuration (TVC), a small vesicle is inflated at
the tip of the micropipette tip and the length of the tube L is in this case determined by the distance between
the two interconnected vesicles. An electrochemical method monitoring diffusion of electroactive molecules
through the nanotube has been used to determine the radius of the nanotube R as a function of nanotube length
L for the two configurations. The da ta show that the LNT connected in the TVC constricts to a smaller radius in
comparison to the tube-only mode and that tube radius shrinks at shorter tube lengths. To explain these
electrochemical data, we developed a theoretical model taking into account the free energy of the membrane
regions of the vesicles, the LNT and the high curvature junctions. In particular, this model allows us to estimate the
surface tension coefficients from R(L) measurements.
Background
Membrane tethers have been studied extensively over
the past 40 years [1-11]. These structures,alsocalled
membrane nanotubes, were observed during fluid shear
deformation of live cells attached to a substrate. As
these cells were dislodged, membrano us tethers
remained attached to the surface displaying both the
fluid and the elastic properties of the membrane [1,2].
Following this work many naturally forming membrane
nanotubes have been identified [7-10]. For example,
membrane nanotubes have been shown to exist within
the cell, notably in the trans golgi network [10]. Here,
lipid and protein cargo destined for various destinations
throughout the cell are sorted and pinched off from the
tubular membrane of the network. It has also been
reported that cells have the ability to use membrane
nanotubes for the exchange of organelles [7], and this
exchange has interestingly even been recognized
between different cell types [8]. Thus, these tethers,
which were first observed following a dramatic manipu-
lation, have been shown to be a common occurrence in
biology.
Following their initial discovery, the lipid membrane
nanotubes (LNTs) have been created artificially in sev-
eral model membrane systems. By attaching a bead or a
micropipette to a point on the membrane and applying
a localized mechanical force to the bilayer surface it has
been shown that a lipid tether can be pulled from the
vesicle membrane [3-5,11]. The size of the struct ure is a
result of the interplay between the curvature elasticity
effects maintaining the original geometry and the mem-
brane tension [12]. Tether pulling experiments can be
used for estimations of tube diameters. By measuring
the forces required for pulling a tube, the diameter of
the LNTs were estimated to be 50 -200 nm [13]. From a
tube coalescence method [14] and video pixel analysis of
accumulated fluorescence images as well as from micro-
graphs obtained with differential interference contrast
optics [5], the LNT diameters were determined to be in
* Correspondence:
5
BioNano Systems Laboratory, Institute for Microtechnology and
Nanoscience, Chalmers University of Technology, 41296 Gothenburg,
Sweden
Full list of author information is available at the end of the article
Karlsson et al. Nanoscale Research Letters 2011, 6:421
/>© 2011 Karlsson et al; licensee Springer. Thi s is an O pen Access arti cle distributed under the terms of the Creative Commons
Attribution License (http://creativecom mons.org/licenses/by/2.0), which permits unrestricted use, distribution, and reproduction in
any medium, provided the original w ork is properly cited.
the range of 100-300 nm [13]. To complement these
methods, we developed an electrochemical method to
monitor the dif fusion of electroactive molecules through
the LNT, thus allowing the LNT diameter to be mea-
sured as a function of nanotube length [11]. The
method relies on the formation of a vesicle-LNT net-
work by using a micropipet te technique [5,15]. The
micropipette-assisted vesicle-LNT network formation
allows us to create complex systems of vesicles intercon-
nected by LNTs, including a so-called inward configura-
tion where a small daughter vesicle is created inside a
larger mother vesicle, the two vesicles being connected
byaLNT[6](seeFigure1A).Duringnetworkforma-
tion, the LNT is pulled with a micropipette to the inter-
ior of the vesicle and thus the opening of the tube faces
outward to the exterior of the vesicle. This makes it
possible to monitor the diffusion of a marker molecule
from the micropipette, through the tube, and out of the
nanotube opening. The concentration of the molecules
measured at t he opening o f the LNT is directly related
to the inner diameter of a LNT of determined length
[11]. In this article we use the electrochemical method
for monitoring the size of a nanotub e attached directly
to the micropipette in the configuration we refer to as
the tube-only configuration (TOC) (see Figure 1B).
Additionally, by inflating a small ("daughter”) vesicle
at the tip of the micropipette, the diameter of a nano-
tube placed in between the inner vesicle and mem-
brane of the outer vesicle can be examined in a
configuration here called two-vesicle configuration
(TVC) (see Figure 1A). The measurements show that
there is a reduction in tube diameter at shorter length,
and the effect appears to be more pronounced in the
TVC. In this work we suggest a geometrical model
based on direct minimization of the Helfrich’ sfunc-
tional for the system of lipid vesicles linked to a LNT
via junctions of specific geometry. This new model
presents a unified quantitative analysis of TOC and
TVC and explains why the length of the LNT in the
TVC is twice as high as in TOC for a given radius.
Furthermore, the model has just two parameters,
which can be chosen to fit the experimental data on
monitoring of the size of the LNT. This allows for
identifying the contribution of the surface tension to
the free elastic energy of the system. This low-tension
term has been neglected in the related publi cation
[11], where a phenomenological description of the sys-
tem was suggested and only a qualitative consistency
with experimental data was obtained.
Experimentals
Materials and methods
Surface-immobilized giant unilamellar soybean lipo-
somes (SBL) were made from soybean polar lipid extract
(Avanti Polar Lipids, Alab aster, AL), as previously
described [5,6,11,15]. An injection pipette pulled with a
comm ercial pipette puller (Model PE-21, Narishige Inc.,
London, UK) and was back-filled with a 50 mM catechol
solution. The pipette was then electro-inserted into the
unilamellar liposome with the aid of a voltage pulse gen-
erated relative to a 5 μm counter electrode (ProCFE
from Dagan Corp, Minneapolis, MN), which was placed
on the o pposite side of the liposome from the injection
pipette. Carbon fiber working electrodes were fabricated
in house and have been described elsewhere [11]. Work-
ing electrodes were held at +800 mV versus a silver/sil-
ver chloride reference electrode (Scanbur, Sweden). All
measurements were made using an Axon 200B potentio-
stat (Molecular Devices, Sunnyvale, CA).
Nanotube radius measurements and calculations
The flux of catechol through t he nanotube was m ea-
sured using carbon fib er amperometry. A 5 μmcarbon
fiber microelectrode was placed at the nanotube-lipo-
some junction. The nanotube was then either length-
ened or shortened by manipulating the injection pipette.
After the new length was obtained, the current was
allowed to st abilize and was then recorded. This process
was repeated several times for each liposome resulting
in a series of electrochemical measurements for tubes of
different lengths. The elect rode was then removed from
the nanotube-liposome junction and allowed to reach a
steady current to establish a baseline. The difference in
measured current for a nanotube versus this background
tog ether with the length of the nanotub e was then used
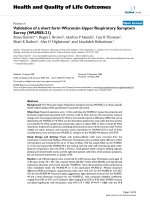
Figure 1 Experimental configurations. Sketches of the
geometries of the large unilamellar vesicles interconnected with a
common LNT; (A) the “two-vesicle” configuration, where the LNT is
connected between the mother vesicle and a small daughter
vesicle inside of the mother vesicle, (B) the “tube-only”
configuration where the LNT is connected between the tip of a
glass pipette and the giant unilamellar vesicle.
Karlsson et al. Nanoscale Research Letters 2011, 6:421
/>Page 2 of 6
to compute the diameter of the nanotube based on the
previously derived relationship
R =
i
nFπD
C
L
,
(1)
where R is the radius of the nanotube of a given
length L, Δi is the change in measured current with
respect to the background, n is the number of moles of
electrons transferred per mole of redox species (for cate-
chol, this is equal to 2), F ≈ 96 485.34 C/mol is Fara-
day’ sconstant,D =7.0× 10
-6
cm
2
/s is the diffusio n
coefficient of the selected redox species (catechol). ΔC is
the change in concentration of catechol over the nano-
tube length and is equal to the concentration of electro-
active species in the pipette assuming that the
concentration at the electrode surface is zero (in our
experiments ΔC = 50 mM).
The results for the tube radius deduced from the
simultaneous measurement of electrochemical current
and the tube length by using formula (1) are presented
in this study. In comparison with our previous publica-
tion [11], a wider range of the length L ofthetubeis
presented for the TOC configuration.
Theoretical approach
The system under consideration
In the first system (Figure 1A), a mother vesicle contains
a small daughter vesicle on the inside with a common
LNT connecting the two compartments. In the second
case (Figure 1B), the lipid tube is pulled to the inside of
the vesicle and is directly fixed to the tip of the micropip-
ette. Also, there is a source of lipid attached to the
mother vesicle wall. The presence of lipid source means
that the surface tension is low. We model the membrane
as a two-dimensional surface Γ. Its free elastic energy
written in the form of Helfrich functional [16] reads
F =
k
2
(
2H − C
0
)
2
dA + σ A.
(2)
Here H is the mean curvature of the surface, C
0
is the
spontaneous curvature which is determined by the spe-
cific chemical composition of the membrane, k is the
coefficient of membrane bending, s is the coefficient of
membrane surface tension. The equilibrium shape of
the membrane with pulled cylindrical tubule can be
found from minimum of the functional
F =
k
2
(
2H − C
0
)
2
dA + σ A − fL,
where f is the force needed to pull the lipid tube of
length L [12].Inthecase,whenthejunctionsarenot
taken into account, the interplay between membrane
bending k and membran e tension s produces variability
in tubule radius and the force f
0
R
0
=
k/2σ , f
0
=2π
√
2kσ
(3)
where f
0
is the force needed to hold the tube of radius
R
0
at a fixed position [12]. However, it was shown that
for lipid vesicles interconnected with LNTs, either
pulled outward from the vesicle wall [5,15] or inward
into the vesicle interior [11,17], the neck elements (the
junctions between the lipid tube and the vesicle body)
also contribute to the total free energy of the mem-
brane. Below we consider a theoretical model based on
the Helfrich functional to find the equilibrium shape of
the membrane accounting for the junctions of the speci-
fic geometry. By comparing the results of numerical
computations with experimental data, we are able to
determine the tension in the LNT after fitting the
experimental data with the geometrical model described
below.
The geometrical model
When the inner vesicle or the junction between the
micropipette and the nanotube is subjected to the trans-
lation movement along the LNT axis, the length of the
tube is changed (increasing or decreasing its value in a
controlled way, which can be monitored under the
microscope). During these manipulations the radius of
the tube adapts to minimize the Helfrich’sfreeenergy
(2) with C
0
= 0, as we neglect any contribution from
spontaneous curvature.
We assume that the shape of LNT can be approxi-
mated by a cylindrical surface o f radius R and length L.
Since radii of both vesicles are much larger than the
tube radius, the junctions between the cylinder and vesi-
cles are modelled by toroidal surfaces with the inner
radius R + r and crossection radius r (Figure 2). In the
TOC, when the inner vesicle is not present, only one
junction is considered. Although the junction between
the micropipette and the tube contributes to the total
free energy, it is assumed that this contribution does
not depend on the tube radius R and, thus, the corre-
sponding term vanishes after the variation. In these set-
tings, the radius-dependent part of the free energy is
given by the expression:
F( L, R, r, k, σ)=
k
2
˜
(
2H
)
2
dA + σ A
(4)
Karlsson et al. Nanoscale Research Letters 2011, 6:421
/>Page 3 of 6
where
˜
=
C
∪
T
and
C
=
⎧
⎨
⎩
⎛
⎝
x
R cos φ
R sin φ
⎞
⎠
, x ∈ (0,L), φ ∈ (0,2π)
⎫
⎬
⎭
,
T
=
⎧
⎪
⎨
⎪
⎩
⎛
⎜
⎝
r sin
(R + r(1 − cos )) cos φ
(R + r(1 − cos )) sin φ
⎞
⎟
⎠
, ∈ ((1 − ν)
π
2
,
π
2
), φ ∈ (0, 2π )
⎫
⎪
⎬
⎪
⎭
.
(5)
The toroidal part of the surface can be parametrised
by (5) due to translation invariance of the energy func-
tional (4). The multiplier ν assumes the value 1 for
TOC and 2 for TVC to represent both junctions.
In Equation 4, L, r, s are fixed parameters while the
radius of the tube R is adjusted to satisfy
∂F(L, R, r, k, σ )
∂R
=0.
(6)
The variation (6) yields the following relation between
the tube length L and radius R
L(R)=
νR
2
1 − 2R
2
˜σ
⎡
⎢
⎢
⎢
⎢
⎣
πr ˜σ +
(r + R)
(R + r)
2
− 2r
2
arctan
2r + R
R
rR
3/2
(
2r + R
)
3/2
⎤
⎥
⎥
⎥
⎥
⎦
,
(7)
where
˜σ =
σ
k
.The model parameter r as well as
˜σ
are
chosen to obtain the best fit to the experimental data.
Assuming that the radius of the tube R is much larger
than the pa rameter r, the first two terms of the power
series expansion for (7) with respect to r/R can also be
used to quantitatively model th e measured relation L(R).
This, simplified, form of (7) reads
L(R)=
πν
2R
2
− r
2
1 − 4R
2
˜σ
4r
1 − 2R
2
˜σ
(8)
and allows for expressing R as a function of L
R(L)=
r
(
4L + νπr
)
2νπ +4r ˜σ
(
2L + νπr
)
.
(9)
An important feature of the proposed model is the
asymptote
R
0
=
k/2σ
(compared to (3)), which is pre-
sent in all three relations (7), (8), and (9). As we
increase L,theradiusR grows and the energy of the
cylindrical part of the surface becomes dominant over
theenergyofthetoroidaljunctions.Thus,inthelimit
case L ® ∞, we obtain the junction free equilibrium
value of R given by (3).
Fitting the parameters
For given K measurements (L
i
, R
i
), i = 1 K, we vary
˜σ
and r to minimize
G
1
(
˜σ , r
)
=
K
i=1
(
L
(
R
i
)
− L
i
)
2
(10)
by means of conjugate gradient minimization proce-
dure. Here, the relation L(R) is given by (7). When the
ratio r/R is small, the approximation (8) can be used
instead. In this case, one can also fit (9) to the data by
minimizing the functional
G
2
(
˜σ , r
)
=
K
i=1
(
R
(
L
i
)
− R
i
)
2
.
(11)
The latter method is preferable when the relative mea-
surement error for R is greater than the one for L.
Results and discussion
When fitting the curve (7) to the dataset for the TVC,
the parameter values are r ≈ 1.7 nm and s/k ≈ 89 μm
-2
.
The corresponding value s for the dataset in the case of
TOC are r ≈ 1.2 nm and s/k ≈ 54 μm
-2
.TherelationL
(R) with fitted parameters are plotted on Figure 3 (blue
curves) together with measured experimental data. As
expected, the parameter r is much smaller than the
radius R: r/R<0.06. Therefore, the simplified form (8)
anditsinverse(9)canbeusedforthegivenrangeof
values of R. Fitting the relation (9) to the measurements
by minimizing (11) yields s/k ≈ 98 μm
-2
, r ≈ 1.9 nm
and s /k ≈ 72 μ m
-2
, r ≈ 1.7 nm for TVC and TOC,
respectively. The corresponding curves are plotted in
Figure 3 in red. The model exhibits good agreement
with the empirical data. A rather large scattering of
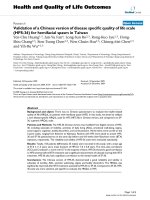
Figure 2 Schematics of the geometry of the tube-junctions.
Karlsson et al. Nanoscale Research Letters 2011, 6:421
/>Page 4 of 6
measurement points at high R values in the TOC case is
reflected as about 20% difference in parameter values
when using different approaches to find the best fit. In
this case, the values obtained through fitting (9), namely
s/k ≈ 72 μm
-2
, r ≈ 1.7 nm have higher reliability.
Our model establishes a connection between the data
from TOC and TVC experiments. It follows directly
from formula (7), that to reach a given radius R of the
tube, the length L
TVC
ofthetubeintheTVCexperi-
ment must be double of that in TOC arrangement
L
TVC
(
R
)
=2L
TOC
(
R
)
.
To explore this theoretical prediction, we divide the
lengths obtained in the experiment with TVC by two and
plot the resulting data set together with the measure-
ments for TOC on Figure 4 . The optimal parameters of
the model for this, unified, data are s/k ≈ 55 μm
-2
, r ≈
1.2 nm and s/k ≈ 71 μm
-2
, r ≈ 1.6 nm for functionals
(10) and (11), respectively. These values are similar to
ones for the TOC c ase since this porti on of the data is
more disperse and has much greater contributions to
functionals (11) and (10) when compared to the data for
the TVC case. Figure 4 also shows that the measure-
ments are in agreement in the region, where they overlap,
i.e., for values of R between 0.05 and 0.06 μm.
Assuming the well established value of bending modu-
lus k =10
-12
erg [16], the recalculated coefficients of the
surfacetensionarefoundintheintervalofs ~ 0.01-
0.02 dyn/cm. These tension values are much smaller
comparing to the lipid molecular compressibility (100
dyn/cm) [18] but much larger than the critical surface
tension for the instability of t he membrane cylinder and
“pearling” (10
-5
dyn/cm for (DGDG/DMPC membrane)
LNTs of radius R ~0.3-5μm found in [19] work)
while comparable with the magnitude of the lateral ten-
sion (higher limit) f or mutual adhesion of lecithine
membranes ~10
-4
erg/cm
2
[20].
The small value of the junction radius corresponds to
the strongly deformed state of the membrane. These
small values should be considered as order estimates,
since they are attributes of the assumed toroidal geome-
try of junctions. The real shape of these junctions is
probably more complex and, thus, cannot be described
by just two scalar valued parameters. Although freeze-
fracture electron microscopy does not reveal bilayers
with curvature less than 20 nm, the value r ~1.5nm
which is found from the model is similar to the radius
curvature of small inverted pores (for example, it is
known that phospholipids spontaneously form inverted
membrane structures with the radius varying between
0.5 and 5 nm, and smallest fusion pores have a calcu-
lated diameter less than 2.5 nm) [21,22].
0.050 0.055 0.060 0.065 0.070
0.075
5
10
15
20
25
0.045
0.030 0.035 0.040 0.045 0.050 0.055 0.060
5
10
15
20
25
●
●
●
●
●
●
●
●
●
●
●
0.025
Figure 3 Co mparison of experimental and model results. The measurement points (shown as marker s) and the predictions of the model
(solid lines). Parameters for the model predictions were chosen to minimize functionals (11) (red lines) and (10) (blue lines).
0.05
0.06
0.07
0.01
0.02
7
40
47
30
37
●
●
●
●
●
●
●
●
●
●
●
Figure 4 Comparison of experimental and model results
(unified description). The measurement points (shown as markers)
for both TVC and TOC plotted after dividing the TVC length by two.
Parameters for the model predictions were chosen to minimize
functionals (11) (red line) and (10) (blue line).
Karlsson et al. Nanoscale Research Letters 2011, 6:421
/>Page 5 of 6
Conclusions
We propose a simple geomet rical model for the quanti-
tative explanation of t he experimental results on equili-
brium geome trical shape and L NTs parameters, R(L), in
the different configurations. The experimental observa-
tions show that the nanotube diameter is reduced at
shorter lengths and also that the diameter is consistently
smaller for the TVC as compared to the TOC for a
given length. The observed effect is ascribed to originate
from the elastic junctions, since the phenomenon is
accentuated in a system containing two necks connected
to a vesicle membrane. We approximate the shape of
these junctions by simple geometrical shapes and
express the free elastic energy of the membrane in
terms of the length of the LNT, its radiu s, the radius of
the junction and the tension of the membrane. Variation
of the energy with respect to the nanotube radius yields
an explicit relation between the radius and the length.
The relation is in agreement with observed values. The
model enables estimations of the current surface tension
coefficient and the curvature at junction regions. The
esti mated values of the surface tension are of order 10
-2
dyn/cm and the curvature value at junctions are com-
parable to ones at fusion pores. Furthermore, the pro-
posed model offers a clear explanation of the difference
in measurements for TVC and TOC: in contrast to
TOC, the TVC features two junction regions, thus, the
length of the LNT in this configuration must be twice
as long to achieve the same value of the radius.
Abbreviations
DGDG: digalactosyldiacylglycerol; DMPC: dimyristoylp hosphatidylcholine; LNT:
lipid nanotube; SBL: soybean liposomes; TOC: tube-only configuration; TVC:
two-vesicle configuration.
Acknowledgements
The authors are grateful to Prof. Sergei Rjasanow for the helpful discussion
of the geometrical model. Part of this study supported by the German
Academic Exchange Service (Deutscher Akademischer Austausch Dienst).
ASC acknowledges support from the Swedish Research Council (VR) and the
Knut and Alice Wallenberg Foundation. AGE acknowledges support from the
European Research Council, VR and the USA National Institutes of Health .
Author details
1
Department of Chemistry, University of Gothenburg, Kemivägen 10, 41296
Gothenburg, Sweden
2
Department of Chemical and Biological Engineering,
Chalmers University of Technology, 41296 Gothenburg, Sweden
3
Applied
Mathematics, University of Saarland, 66121 Saarbrücken, Germany
4
Department of Chemistry, Penn State University, 104 Chemistry Building,
University Park, PA 16802, USA
5
BioNano Systems Laboratory, Institute for
Microtechnology and Nanoscience, Chalmers University of Technology,
41296 Gothenburg, Sweden
Authors’ contributions
RG contributed in development of the geometrical model, analysis of
experimental data and participated in writing of the manuscript. MVV
participated in the model development and analysis of experimental data,
physical interpretation of results and writing the manuscript. KLA and MK
have contributed to the experimental part of the study. RK, MK, AGE, and
ASC have equally participated in writing of Sections ‘Background’,
‘Experimental’, and ‘Results and discussion.’ RK and MVV provided the idea
for the theoretical work. All authors read and approved the final manuscript.
Competing interests
The authors declare that they have no competing interests.
Received: 22 December 2010 Accepted: 14 June 2011
Published: 14 June 2011
References
1. Hochmuth R, Mohandas N, Blackshearjr P: Measurement of the elastic
modulus for red cell membrane using a fluid mechanical technique.
Biophys J 1973, 13:747-762.
2. Evans E: New membrane concept applied to the analysis of fluid shear-
and micropipette-deformed red blood cells. Biophys J 1973, 13:941-954.
3. Waugh R: Surface viscosity measurements from large bilayer vesicle
tether formation. II. Experiments. Biophys J 1982, 38:29-37.
4. Evans E, Bowman H, Leung A, Needham D, Tirrell D: Biomembrane
templates for nanoscale conduits and networks. Science 1996,
273:933-935.
5. Karlsson A, Karlsson R, Karlsson M, Cans A, Strömberg A, Ryttsén F, Orwar O:
Networks of nanotubes and containers. Nature 2001, 409:150-152.
6. Cans A, Wittenberg N, Karlsson R, Sombers L, Karlsson M, Orwar O, Ewing A:
Artificial cells: unique insights into exocytosis using liposomes and lipid
nanotubes. Proc Natl Acad Sci USA 2003, 100:400-404.
7. Onfelt B, Davis D: Can membrane nanotubes facilitate communication
between immune cells? Biochem Soc Trans 2004, 32:676-678.
8. Rustom A, Saffrich R, Markovic I, Walther P, Gerdes H: Nanotubular
highways for intercellular organelle transport. Science 2004,
303:1007-1010.
9. Onfelt B, Nedvetzki S, Benninger R, Purbhoo M, Sowinski S, Hume A,
Seabra M, Neil M, French P, Davis D: Structurally distinct membrane
nanotubes between human macrophages support long-distance
vesicular traffic or surfing of bacteria. J Immunol 2006, 177 :8476-8483.
10. de Matteis M, Luini A: Exiting the Golgi complex. Nat Rev Mol Cell Biol
2008, 9:273-284.
11. Adams K, Engelbrektsson J, Voinova M, Zhang B, Eves D, Karlsson R,
Heien M, Cans A, Ewing A: Steady-state electrochemical determination of
lipidic nanotube diameter utilizing an artificial cell model. Anal Chem
2010, 82:1020-1026.
12. Derényi I, Jülicher F, Prost J: Formation and interaction of membrane
tubes. Phys Rev Lett 2002, 88:238101.
13. Bo L, Waugh R: Determination of bilayer membrane bending stiffness by
tether formation from giant, thin-walled vesicles. Biophys J 1989,
55:509-517.
14. Cuvelier D, Derényi I, Bassereau P, Nassoy P: Coalescence of membrane
tethers: experiments, theory, and applications. Biophys J 2005,
88:2714-2726.
15. Karlsson M, Sott K, Cans A, Karlsson A, Karlsson R, Orwar O: Micropipette-
assisted formation of microscopic networks of unilamellar lipid bilayer
nanotubes and containers. Langmuir 2001,
17:6754-6758.
16. Helfrich W: Elastic properties of lipid bilayers: theory and possible
experiments. Z Naturforsch C: Biochem Biophys Biol Virol 1973, 28:693-703.
17. Michalet X, Bensimon D, Fourcade B: Fluctuating vesicles of nonspherical
topology. Phys Rev Lett 1994, 72:168-171.
18. Evans E, Rawicz W: Entropy-driven tension and bending elasticity in
condensed-fluid membranes. Phys Rev Lett 1990, 64:2094-2097.
19. Bar-Ziv R, Moses E: Instability and “pearling” states produced in tubular
membranes by competition of curvature and tension. Phys Rev Lett 1994,
73:1392-1395.
20. Servuss R, Helfrich W: Mutual adhesion of lecithin membranes at ultralow
tensions. J Phys 1989, 50:809-827.
21. Nanavati C, Markin V, Oberhauser A, Fernandez J: The exocytotic fusion
pore modeled as a lipidic pore. Biophys J 1992, 63:1118-1132.
22. Sackmann E, Merkel R: Lehrbuch der Biophysik Berlin: Wiley-VCH; 2010.
doi:10.1186/1556-276X-6-421
Cite this article as: Karlsson et al.: Mechanics of lipid bilayer junctions
affecting the size of a connecting lipid nanotube. Nanoscale Research
Letters 2011 6:421.
Karlsson et al. Nanoscale Research Letters 2011, 6:421
/>Page 6 of 6