Báo cáo hóa học: " Nanomechanical properties of a-synuclein amyloid fibrils: a comparative study by nanoindentation, harmonic force microscopy, and Peakforce QNM" potx
Bạn đang xem bản rút gọn của tài liệu. Xem và tải ngay bản đầy đủ của tài liệu tại đây (1.54 MB, 10 trang )
NANO EXPRESS Open Access
Nanomechanical properties of a-synuclein
amyloid fibrils: a comparative study by
nanoindentation, harmonic force microscopy,
and Peakforce QNM
Kim Sweers
*
, Kees van der Werf, Martin Bennink and Vinod Subramaniam
*
Abstract
We report on the use of three different atomic force spectroscopy modalities to determine the nanomechanical
properties of amyloid fibrils of the human a-synuclein protein. a-Synuclein forms fibrillar nanostructures of
approximately 10 nm diameter and lengths ranging from 100 nm to several microns, which have been associ ated
with Parkinson’s disease. Atomic force microscopy (AFM) has been used to image the morphology of these protein
fibrils deposited on a flat surface. For nanomechanical measurements, we used single-point nanoindentation, in
which the AFM tip as the indenter is moved vertically to the fibril surface and back while the force is being
recorded. We also used two recently developed AFM surface property mapping techniques: Harmonic force
microscopy (HarmoniX) and Peakforce QNM. These modalities allow extraction of mechanical parameters of the
surface with a lateral resolution and speed comparable to tapping-mode AFM imaging. Based on this
phenomenological study, the elastic moduli of the a-synuclein fibrils determined using these three different
modalities are within the range 1.3-2.1 GPa. We discuss the relative merits of these three methods for the
determination of the elastic properties of protein fibrils, particularly considering the differences and difficulties of
each method.
Introduction
Amyloid fibrils are insoluble protein aggregates that
have been associated with a range of neurodegenerative
diseases, including Huntington, Alzheimer’s, Parkinson’s,
and Creutzfeldt-Jakob disease [1]. The fibrils typically
have a diameter ranging from 4 to 12 nm, and lengths
from 100 nm up to several microns [2-4]. In this study,
we investigated the nanomechanical properties of amy-
loid fibrils formed from the human a-synuclein protein,
which is associated with Parkinson’s disease. a-Synuclein
amyloid fibrils are found in the brains of Parkinson’ s
disease patients as components of larger plaques called
Lewy bodies [5,6].
Atomic force microscopy (AFM) has been primarily
used as an imaging tool to determine morphological
parameters such as height and length of amyloid fibrils,
such as those formed from a-synuclein [2-4], insulin [7],
and b-lactoglobulin [8]. AFM is also a powerful techni-
que for characterizing mechanical properties. With the
ability to exert and measure forces up to the piconewton
range, AFM is a particularly suitable tool to determine
the nanomechanical properties of nanometer-size d bio-
logical structures, such as amyloid fibrils. Mechanical
properties such as stiffn ess, rigidity, resistance to break-
age or adhesive properties of t hese fibrils or individual
monomers are interesting for the use of these fibrils as
nanomaterials, for getting a better understanding of the
physico-chemical properties of these fibrils, and to get
more insight into their structure and growth [9-14].
Indentation-type AFM or single-point nanoindentation
(SPI), for example, implemented as ‘Point-and-Shoot’ in
the Veeco operating software, is the most widely used
method to measure nanomechanical properties of a
sample. In this mode, the tip approaches and indents
the sample until a certain predefined force is reached.
* Correspondence: ;
Nanobiophysics Group, MESA+ Institute for Nanotechnology, Faculty of
Science and Technology, University of Twente, Enschede, The Netherlands
Sweers et al. Nanoscale Research Letters 2011, 6:270
/>© 2011 Sweers et al; l icensee Springer. This is an Open Access article distributed under the terms of the Creative Commons Attribution
License (http://creat ivecommons.org/licenses/by/2.0), which permits unrestricted use, distribution, and reproduction in any medium,
provided the original work is properly cited .
At this point the tip is retracted again. During this
approach and retract cycle the force is continuously
measured, resulting in a force versus distance graph.
AFM nanoindentation has been performed on different
biological substrates such as collagen [15], insulin fibrils,
and crystals [16], but also on different polymeric materi-
als, such as fibrils used for biodegradable scaffolds [17].
The approach-retract cycle is typically performed at a
rate of 0.5 to 10 Hz, which makes this method inher-
ently slow. To get an overview of the mechanical prop-
erties of a sample, nanoindentation can be used in a
force-volume mode. Here, for every pixel in an image a
complete force curve is reco rded, which results in data
acquisition times of up to hours for a single image.
Recently, several different surface property mapping
techniques have become available that work at much
higher speeds, leading to significantly increased data
throughput [18-20]. Two commercially available
approaches are PeakForce QNM and Harmonic force
microscopy or HarmoniX (Ve eco, Santa Barbara, CA,
USA). PeakForce QNM is based on the force-volume
approach; however, the speed of taking the force curves
is significantly increased (either at 1 or 2 kHz). In this
mode the maximum force exerted on the sample is
maintained constant, which is beneficial for soft delicate
biological samples. Because of the recent introduction of
the Peakforce QNM method, only a few studies have
been reported, such as the stiffness mapping of polymer
blends [18].
HarmoniX is another surface property mapping techni-
que based on the nonlinear dynamic behav ior of a canti-
lever in tapping mode due to repulsive and attractive
forces caused by the specific material characteristics of
the sample acting on the tip [21,22]. Because of the low
bandwidth of the cantilever response, this information
ends up in the phase image as obtained during tapping
mode imaging. This phase signal is related to energy dis-
sipation, which is determined by the viscoelastic and
adhesive properties of the sample [21,23]. However,
because of the convolution of multiple physical proper-
ties into one signal, interpretation of these images is n ot
straightforward. The higher harmonic vibrations of the
cantilever excited by these material properties can pro-
vide more information, but they are heavily suppressed
and are difficult to measure [21,24]. In Harmo niX, a tor-
sional cantilever with the tip positioned off-axis solves
this problem and acts as a high bandwidth force sensor
[24]. HarmoniX has been applied to both polymers and
biological features, for example, DNA [25,26].
We used these three different methods, SPI, PeakForce
QNM, and HarmoniX, to determine the modulus of
elasticity of protein nanofibrils, generated from the
E46K mutant of t he human a-synuclein protein. The
resulting values for the elastic modu lus are in the range
between 1.3 and 2.1 GPa. We discuss the re lative merits
of the application of these three methods specifically for
the determination of the elastic properties of protein
fibrils in more detail, with particular emphasis on the
differences and difficulties of each method.
Results
Single-point nanoindentation experiments in liquid
a-Synuclein fibrils deposited on mica were scanned both
in tapping mode and contact mode, respectively, for
determining the height and finding the i ndentation
points for the SPI measurements. We determined an
average fibril height of 9.0 ± 0.4 nm (N =60)fromthe
tapping mode images. This ave rage height value was
used to determine the effective contact surface in the
indentation measurements according to the model
shown in Figure 1. The fibril heights measured in con-
tact mode imaging were considerably lower and were
therefore not used in determining the average fibril
height. This was attributed to the pressure from the tip
on the sample. The force exerted on fibrils with the 0.1
N/m cantilever during scanning was between 0.5 and
1 nN.
We performed nanoindentation experiments on five
fibrils, each of which was indented 8 times at different
locations along its length. A typical force distance curve
resulting from this procedure is shown in Figure 2A.
The absence of adhesion during the measurements
allowed the use of the Hertz model.
Although every fibril was indented 8 times, not all
curves were suitable for analysis. For some curves, the r
2
values of the linear fit did not exceed 0.95 in the part
where the tip was indenting the fibril (part 1 in Figure
2C). From the curves that were analyzed, an average
elastic modulus of 1.3 ± 0.4 GPa (N = 31) was found for
a-synuclein fibrils.
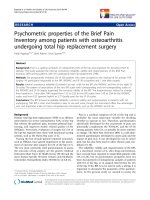
Figure 1 Schematic representation of equivalent contact
radius. Schematic representation of the AFM tip as a spherical
indenter and the protein fibril as an infinitely long cylinder.
Sweers et al. Nanoscale Research Letters 2011, 6:270
/>Page 2 of 10
Harmonic force microscopy
A sample of a-synuclein fibrils deposited on mica was
scanned. Figure 3 shows two typical images recorded,
with corresponding height and elasticity profiles. The
fibrils show considerably lower modulus of elasticity
compared to the background. However, the edges of the
fibril show increased modulus of elasticity values, also
displayed in the cross-section of the fibr il shown in
Figure 3F. We attribute this effect is due to the chan-
ging contact are a compared to the contact area shown
in Figure 1 where the tip is indenting the middle of the
fibril. This artifact is a lso visible in the height images
derived from the harmonic force mode, shown in Figure
3E, and they are therefore not used in further analysis.
For each individual fibril, the values for the elastic mod-
ulus measured along the fibril were averaged. The aver-
age value was 1.2 ± 0.2 GPa (N = 95).
Peakforce QNM
The surface property mapping technique Peakforce
QNM is able to image the sample both in ambien t con-
ditions and in buffer solution. Figure 4 shows height
images and the corresponding elasticity maps obtained
with Peakforce QNM of a-synuclein fibrils, obtained in
buffer (Figure 4A, B) and in air (Figure 4C, D). These
images were obtained with a high setpoint of around
15 nN and show that for both liquid and ambient condi-
tions the height and elasticity ranges which can be
obtained with Peakforce QNM are similar. However,
this large setpoint causes the fibrils to break, especially
in liquid, see Figure 4A.
To prevent damage to the a-synuclein fibrils, a lower
setpoint of 1-2 nN was used. This resulted in intact
fibrils with significant lower values of the elastic moduli
(Figure 5). The elastic modulus for each fibril is deter-
mined from the average value of the DMT modulus
obtained along the fi bril length. This resulted in a mod-
ulus of elasticity of 1.3 ± 0.3 GPa (N = 57) for the fibrils
in ambient conditions and 1.0 ± 0.2 GPa (N = 59) for
those in liquid.
Discussion
Choosing the right cantilever
In order to measure the elastic properties of a material,
the choice of the cantilever is key. In nanoindentation
the highest sensitivit y (and thus a ccuracy) is achieved if
the spring constant of the probe cantilever is identical
to the effective spring constant of the sample (also
referred to as contact stiffness), see Figure 6. If the
spring constant of the cantilever is more than 10 times
lower or higher than that of the sample, the sensitivity
is about 3 times lower, see Figure 6 making the determi-
nation of the elastic modulus less accurate. Practically
Figure 2 Typical force curves. (A) Atypicalforceversuspiezo
displacement curve obtained from the measurement, with the
approach curve (solid red) and the retract curve (dashed blue). (B)
Force versus separation approach curve calculated from the force
versus piezo displacement curve. (C) Force to the power of 2/3
versus separation approach curve, showing distinct transition from
the tip only sensing the fibril (part I) to the part where the tip is
sensing the mica under the fibril (part II) until the part where the
tip is only pressing on the mica (part III). From the slope of part I, a
modulus of elasticity of 1.2 GPa was calculated for the force curve
presented here.
Sweers et al. Nanoscale Research Letters 2011, 6:270
/>Page 3 of 10
since one does not know the stiffness of the sample
a priori, an estimation is necessary. This is also the case
for the surface mapping methods. The nominal elastic
modulus ranges accessible by HarmoniX and Peakforce
QNM are 10 MPa-10 GPa and 0.7 MPa-70 GPa, respec-
tively [18]. However, as noted above, this range depends
on the cantilever that is used for the measurements and
is in practice significantly smaller.
A second point to consider when choosing the canti-
lever is the adhesion between the tip and the sample.
The spring constant of the cantilever should be suffi-
ciently high to create enough force to come loose from
the surface. In the PeakForce QNM experiments
reported here on protein fibrils, p erformed in ambient
air, an adhesion of few nanonewtons was observed. For
reproducible and proper deflection c urves in air we
used in this case a cantilever with a spring constant of
approximately 27 N/m. In the HarmoniX mode the
fibrils are measured in a s pecial tapping mode. In this
mode reproducible results were obtained with cantile-
vers with medium stiffness of 2 N/m in amb ient condi-
tions. The cantilever used for the nanoindentation
measurements (0.1 N/m) showed an incredibly large
artifact in both approach and retract curves at the
1 kHz ramp rate in Peakforce QNM in liquid, which
was not seen in the nanoindentation measurements.
This artifact could be induced by the impact of the
effective mass and damping forces at the working
Figure 3 Harmonic force microscopy images .Height(A, C) and cor responding elasticity images (B, D) of a-synuclein fibrils on mica. E
represents the cross-sections drawn over the fibril in C. F represents the cross-section from D and shows a few scan artifacts. The background,
mica, has here a stiffness of ± 1.5 GPa, probably caused by the limited range of elastic moduli which can be measured with the chosen
cantilever. The peaks shown around 80 and 120 nm are edge effects caused by changing contact areas. The dip around 100 nm is assumed to
be relevant for averaging and used to determine a modulus of elasticity. Scale bars are 250 nm.
Sweers et al. Nanoscale Research Letters 2011, 6:270
/>Page 4 of 10
Figure 4 Peakforce QNM images in liquid and ambient conditions. Height (A, C) andcorrespondingelasticitymaps(B, D) recorded with
Peakforce QNM. Panels A and B are recorded in liquid (setpoint is 14 nN) and C and D in ambient conditions (setpoint is 16 nN). The fibrils
have in these images an average modulus of elasticity of 3 GPa and mica between 6 and 7 GPa. Image size is 2 × 2 μm.
Figure 5 Peakforce QNM images. Height and stiffness map of fibrils obtained with a setpoint of 1 nN in liquid, images size is 1 μm (A, B). C and
D represent the cross-section of the fibril. Notice that in Peakforce QNM the artifacts at the edges of the fibrils seen in HarmoniX (Figure 3F)
caused by changing contact areas are absent.
Sweers et al. Nanoscale Research Letters 2011, 6:270
/>Page 5 of 10
frequency of 1 kHz. These hydrodynamic forces acting
on the cantilever are frequency-dependent [27,28].
Although we do not know how the Peakforce QNM
software compensates for this, it is possible these effects
in liquid could interfere with the measurements. Scan-
ning with stiffer cantilevers with nominal spring con-
stant 2.8 N/m yielded reproducible results.
Finally, in addition to choosing the optimal cantilever
stiffness, it is also important to ensure that the reso-
nance frequency for Peakforce QNM imaging is above
10 kHz, in order not to interfere with the 1 kHz
ramping.
Calibration
The calibration of all three methods is difficult and con-
sists of several steps. For all methods one needs the deflec-
tion sensitivity, the spring constant of the cantilever and
the tip radius. For the SPI experiments the tip radius can
be determined afterwards. Both surface mapping methods
need the tip radius as an input parameter before measur-
ing. For HarmoniX, in addition to this tip radius, some
additional parameters, such as the torsional frequency, are
needed. An alternative way of calibration of the surface
mapping methods was done with the reference sample
(see “Methods” section). In this study, this reference sam-
ple is only used in the HarmoniX measurements.
Analysis of results
Error analysis
All three techniques use a contact mechanics model which
is based on assumptions and parameters which can only
be determined with a limited accuracy. The first assump-
tion starts with the Poisson ratio for these protein fibrils.
For small biological samples this ratio between lateral
strain and axial strain is not known. The theoretical upper
limit is 0.5 and concrete as a material has a value between
0.1 and 0.2. In this study we used 0.3, because we assumed
the fibrils to be in the s ame range as polymers [29]. This
Poisson ratio has only a small influence on the actual
modulus of elasticity values (Poisson ratio change from 0.3
to 0.4 gives a 5% change in modulus of elasticity).
The tip radius has, compared to the Poisson ratio and
fibril radius, a large impact on the results. It is therefore
important to measure the tip radius after the experi-
ments. The tip radius is in our experience in practice
always larger than the manufacturer specification, both
before and after th e experiment. Figure 7 shows th e
impact of the tip radius on the results of the SPI mea-
surements on the a-synuclein fibrils when all the other
parameters are kept constant. The dependence is less
significant at larger tip radii.
Figure 6 Effective spring constant as a function of sample
stiffness. (A) Force versus z piezo displacement curve in case of
sample spring constant larger, the same or lower compared to the
spring constant of the cantilever. (B) Effective spring constant (k
eff
,
representing the slope of the force curves in A) as a function of the
stiffness of the sample. From the slope of this curve it is clear that
the maximum sensitivity is achieved when both spring constants
are of the same order of magnitude.
Figure 7 Dependence of modulus of elasticity in tip radius. The
force curve data obtained with SPI measurements are used to
calculate the modulus of elasticity with variable tip radii while all
other parameters are kept constant.
Sweers et al. Nanoscale Research Letters 2011, 6:270
/>Page 6 of 10
However, even when using blunt tips there are mea-
surement errors which have to be considered. The
radius of the tip in indentation studies is often deter-
mined by scanning electron microscopy [16] after the
indentation experiments where the tip shape could be
influenced by wear [30]. Another method is to deter-
mine the tip radius from tip sample convolution models
[21,31]. From previous studies the error from the tip
sample convolution method is around 30% [32].
An additional important step is the calibration of the
cantilever spring constant. There are a number of tech-
niques available to determine the spring constant, each
with their own uncertainties [33-35]. In this study, can-
tilevers were calibrated with the thermal noise method,
which has an associated average error of 5% [33].
All three methods described here are susceptible to
relatively large systematic errors arising from the com-
pounding of errors inherent to the different calibration
and characterization techniques. Using the law of propa-
gation of errors, we estimate that this systematic error
combined wit h the above-mentioned and the previously
described 2% error in the deflection sensitivity measure-
ments [34] yields an uncertainty of approximately 39%
of the average measured value. In addition to these
errors, experimental data are also influenced by the
expected statistical variation due to heterogeneity of a
large sample set.
Finite sample thickness
When indenting small fibrillar features with a relatively
large tip radius one has to take the finite sample thick-
ness effects into account. As shown in Figure 2C the
force curve displays distinct regimes: from being free in
air above the sample to the initial fibril indenting sec-
tion where the tip ‘only’ feels the fibril (Figure 2C, part
I),towherethemicaunderneathstartstoplayarole
(Figure 2C, part II), and finally to th e last section where
only the hard surface is felt by the tip (Figure 2C, part
III). The initial 20% of the total height of a feature is
thought to be unaffected by these final sample thickness
effects for large objects relative to the tip radius [12].
However, at the typical size scales of these nanofibrils, a
correction for these effects is necessary [16,36]. In the
Peakforce QNM software these effects are not consid-
ered and therefore not compensated for [18]. In Harmo-
niX there is also no correction for these effects.
However, the question is whether these effects are
nearly as pronounced in HarmoniX because of the small
indentations that are made with this technique. In the
SPI measurements from this study the correction factor
was small (~1.3) because of the rather high modulus of
elasticity.
Discussion of results
All methods used in this study yielded moduli of elasti-
city between 1.3 and 2.1 GPa (see Table 1), which is
close to values found for collagen and other amyloid
fibrils [10,15]. These va lues are somewhat smaller than
those obtained for films made with fibri llar networks of
b-lactoglobulin (5.2-6.2 GPa ) and lysozyme (6.7-7.2
GPa) [37], and potentially reflect the differences in
experimental conditions. We also measured insulin and
lysozyme amyloid fibrils using HarmoniX under ambient
conditions. The values measured, 1.4 ± 0.2 GPa for lyso-
zyme fibrils and 1.4 ± 0.1 GPa for insulin, were com-
mensurate to that measured for a-synuclein. The
modulus previously found for insulin fibrils measured
with SPI in liquid, which is at a lower working speed, is
three orders of magnitude lower [16]. However, Smith
et al. [11] have found a value of 3.3 GPa for insulin fibril
using force spectroscopy on suspended fibrils. Note that
in this work all the methods result in relatively similar
values, although they all have very different operation
speeds.
The spread in the SPI measurements is also compar-
able to earlier work. The reason for this spread, besides
the previously mentioned errors, has been related to
heterogeneity in the internal packing of amyloids
[1,16,38].
Both surface contact area and finite sample thickness
corrections were performed offline on the HarmoniX
and Peakforce QNM data, see Table 1 which results in
higher values. The finite sample correction value found
in the analysis of the SPI of 1.3 and the relation for a
spherical indenter on an infinit e long cylinder are used.
The high modulus of elasticity of the fibrils suggests a
high packing density. The difference between liquid and
ambient air conditions becomes more significant after
correction. With the uncorrected values the difference is
lower, which suggests little room for water within the
fibril, but the corrected r esults could point to an
observed drying effect.
However, the large spread, seen in Table 1 and in pre-
vious studies, combined with t he large systematic error
Table 1 Overview of results from different methods
Method Environment Operation
frequency
(Hz)
Uncorrected
modulus of
elasticity
(GPa)
Modulus
of
elasticity
(GPa)
Nanoindentation Liquid 1 - 1.3 ± 0.4
Peakforce QNM Liquid 10
3
1.0 ± 0.2 1.6 ± 0.3
Peakforce QNM Air 10
3
1.3 ± 0.3 2.1 ± 0.5
HarmoniX Air 10
5
1.2 ± 0.2 1.9 ± 0.3
Overview of results from different methods under different environmental
conditions, 4th column represents the corrected values for modulus of
elasticity. This correction is the same as done in the analysis of the
indentation measurements; the contact area is changed to a spherical
indenter on an infinite cylinder (average fibril height of 9.0 ± 0.4 nm,
measured in AFM tapping mode) and is corrected for the finite sample
thickness as described in the “Methods” section.
Sweers et al. Nanoscale Research Letters 2011, 6:270
/>Page 7 of 10
of 39% calculated above makes interpreting these results
very difficult.
Conclusions
The nanometer scale diameters of a-synuclein protein
fibrils pose some serious challenges for interpretation of
the data obtained with SPI, HarmoniX and Peakforce
QNM. The t ypical size scales of the fibrils give rise to
finite sample thickness effects [16,36]. Furthermore,
these fibrils cannot be described as a flat film on a sur-
face for which all the standard models are valid [39,40].
Finally, these samples have strong adhesive properties
which results in choosing cantilevers that possibly result
in less contrast betw een the fibrils and the surfac e,
because of the mismatch between cantilever and sample
stiffness. All these difficulties are addressable with the
conventiona l nanoindentation measurements, where the
analysis is mostly done offline and in custom-written
algorithms. For the surface property mapping techniques
it is at this point o nly possible to customize the analysis
in a limited manner. The methods come with specifi c
conditions in which the analysis is valid. First, the tip
should be a hard sphere compared to the sample. Sec-
ond, only elastic deformation is taken into a ccount.
Last, the sample should not be confined vertically (finite
sample thickness effect) or laterally (by surrounding
material) [18]. For protein fibrils the second condition is
not actually known, after indentation with high forces
(> 3 nN) the fibrils appear to be broken, while with lower
forces they stay intact (< 2 nN). The third condition is
not met in case of the protein fibrils. For HarmoniX it is
also good to keep in mind that theoretically one needs an
infini te number of frequency components to reconstruct
the real time interaction between the tip and the surface
[18].
To obtain in a short amount of time quantitative
modulus of elasticity for protein fibrils the surface prop-
erty methods are relatively easy to use and fast. How-
ever, recording individual curves on the fibrils during
scanning is necessary to analyze the curves for all the
conditions that are not met in these methods. In case of
the measurements done on the protein fibrils the differ-
ences are within each others error ranges. This may no t
be the case for other biological structures. It is essential
to understand the limitations of each method and care-
fully analyze the data, including the individual force
curves, according to the valid conditions for the specific
structures.
Methods
Sample preparation
E46K disease mutant a-syn uclein was recombinantly
expressed and purified as previously described [4]. A
100 μM m onomeric E46K solution in 10 mM Tris-HCl,
50 mM NaCl, pH 7.4 was incubated at 70°C in Eppen-
dorf tubes under constant shaking. After 27 h, well-
defined protein fibrils were formed in soluti on, which
was verified by a Thioflavin T fluorescence assay specific
for cross-beta structures characteristic of amyloid fibrils.
Samples for AFM imaging in liquid were prepared by
placing 50 μl of a 5× diluted solution containing fibrils
onthemicasubstrate.Thissolutionwasallowedto
adsorb for 10 min and then washed gently with 200 μl
buffer. For imaging, 80 μl of fresh buffer solution was
placed on the sample. We used the same buffer solution
(10 mM Tris-HCl, 50 mM NaCl, pH 7.4) fo r both dilu-
tion and imaging. For the measurements performed in
ambient air, a 10× diluted protein solution was placed
on mica substrates and allowed to adsorb in the same
manner as described above. Subsequently, the sample
was washed with 200 μl milliQ water and dried w ith a
gentle nitrogen stream.
AFM cantilever and tip characterization
The tip radius was determine d with two different meth-
ods. First, from the AFM height images of protein fibrils
the tip radius was derived from the fibril height-to-
width ratio based on tip-sample convolution [21,31].
Only fibrils that were perpendicular to the scan axis
were used. From the tip sample c onvolution method an
average tip radius of 100 nm was determined. Second,
the tip was imaged by scanning electron microscopy
(Philips XL30 ESEM-FEG). With the SEM, the average
tip radius was found to be approximately 80 nm. For
both methods, the tip resulted in a considerably larger
number than the nominal tip radius provided by the
manufacturer. An average value of 90 nm was used in
the analysis with an error of 30%.
The cantilever spring const ants were determined with
the thermal noise method implemented in the Veeco
software and were assumed to have a 5% error [33].
Single-point nanoindentation
A Bioscope II microscope (Veeco, Santa Barbara, CA,
USA) was used for the SPI experiments. In order to
measure the fibril heights, AFM tapping mode images
were recorded in a physiological buffer (10 mM Tris-
HCl, 50 mM NaCl, pH 7.4) in tapping mode with low
force settings (reduced to 3 nm, 80-90% of the free
amplitud e) to minimize interaction with th e sample. We
use silicon nitride probes (MSCT, tip F, 0.5 N/m, Veeco,
Santa Barbara, C A, USA) for these measurements. The
average fibril height measured in tapping mode is used
to determine the surface contact area for all three
indentation methods. The indentation measurements
were performed with the “Point and Shoot” application
in the NanoScope 7.30 (Build R2Sr1.) software. To
locate the indentation lo cations we first imaged the
Sweers et al. Nanoscale Research Letters 2011, 6:270
/>Page 8 of 10
fibrils in contact mode using another probe (MSCT, tip
E, 0.1 N/m, Veeco, Santa Barbara, CA, USA). This
probe was selected to, on one hand, minimize the forces
during contact mode imaging and, on the other hand, to
match the sprin g constant of the cantilever to the stiff-
ness of the sample for the indentation measurements.
Every fibril was indented approximately 8 times at dif-
ferent positions along its length. Prior to fibril indenta-
tion, force curves were recorded on the mica substrate
close to the fibril to determine deflection sensitivities of
the cantilevers.
Data analysis
The raw deflection curves, obtained in the SPI mode,
were converted to a force separation curve using t he
deflection sensitivities and the spring constants o f the
cantilevers in a custom written Matlab program. To
extract the elastic modulus from the force separation
curve, the Hertz model was used to analyze the force
curve [39]. This model, in the case of a spherical inden-
teronacylindershapedobject,isgiveninFigure1
where F is the load, v the Poisson ratio, δ the separation,
and E the modulus of elasticity. The equivalent con tact
radius R
eq
for a spherical indenter with radius R
t
,with
an infinitely long cyli nder with radius R
f
is given by the
expression in Figure 1. The modulus of elasticity was
determined from the slope of the curve where F
2/3
was
plotted versus the separation. Small segments along this
curve were fitted to a linear equation and the r
2
value
was determined for every fit, yielding an elastic modulus
as a function of separation. From the point the force
increases, the r
2
value increases and only fits with an r
2
above 0.95 were used in the analysis. From the point of
contact the modulus of elasticity values for the following
2 nm were averaged (20% indentation [12]).
Due to the finite thickness effects, the obtained modu-
lus of elasticity is influenced by the stiff underlying sub-
strate (mica). A correction factor for this effect was
applied which was a function of the maximum applied
force and the value of the uncorrected modulus of elas-
ticity [16,36].
All analysis steps were implemented in a custom
Matlab program. The algorithm anal yzes both the force
curve and the r
2
curve to accurately determine the
point-of-contact, that is, the separation at which the tip
starts indenting the fibril. This point is defined as the
point where the force distance curve leaves the baseline,
and r
2
adopts a value higher than 0.95.
Harmonic force microscopy
HarmoniX was performed under ambient conditions
(that is, at room temperature without further control of
humidity) on a Veeco Multimode microscope with a
Nanoscope V controller (Veeco, Santa Barbara, CA,
USA). The analysis software uses the DMT model [40].
Torsional cantilevers (TL01, MikroMasch , Tallinn, Esto-
nia) with a nominal spring constant of 2 N/m were
used. The measured vertical and torsi onal resonance fre-
quencies were 111 kHz and 1.1 MHz, r espectively. The
system was calibrated with a reference sample (model
PS-LDPE, Veeco, Santa Barbara, CA, USA) [20]. Since
HarmoniX assumes a spherical tip that indents an infi-
nitely large and thick flat elastic surface, the value for the
modulus of elasticity needs to be corrected offline. The
first correction factor applied is to account for the differ-
ent geometry, which in these experiments is a spherical
tip indenting an infinitely long cylinder, see Figure 1. The
correction factor used here is 2.1. The second correction
factor was applied to account for the finite sample thick-
ness of the protein fibril. A correction factor of 1.3, deter-
mined by the SPI measurements, was used.
Peakforce QNM
Peakforce measurements were done on a Veeco Bio-
scope Catalys t microscope with a Nanos cope V control-
ler (Veeco, Santa Barbara, CA, USA). The analysis
software uses the DMT model [40]. The mea surements
were done both in ambient conditions (uncontrolled
humidity, temperature, and air pressure) and physiologi-
cal buffer (10 mM Tris-HCl, 50 mM NaCl, pH 7.4). The
manufacturer provides a list of optimal cantilevers to
measure specific ranges of elastic moduli. For the ambi-
ent measurements the stiff RTESP cantilevers (26.9 N/
m, Veeco, Santa Barbara, CA, USA) were used, due to
the high adhesion forces observed for other, less stiff
cantilevers. For the measurements performed in buffer
we used a medium stiff cantilever: FMR-10 cantilevers
(nominal spring constant 2.8 N/m, Nanoworld, Neuchâ-
tel, Switzerland). Here, the elastic moduli are also cor-
rected offline as described for the HarmoniX data (see
Harmonic force microscopy).
Image analysis
Using SPIP software (Image Metrology A/S, Lyngby,
Denmark), a trace was dra wn on top of the fibril to
determine the average height from the height images or
modulus of elasticity from the stiffness maps of the indi-
vidual fibrils, according to the procedure described in
[4]. A point of potential confusion is that both Harmo-
niX and Peakforce QNM create so-called ‘ stiffness’
maps, which in the software is expressed in units of Pa.
Technically this is not co rrect, since stiffness is
expressed in units of N/m. The parameter in these
images is a modulus of elasticity which is expressed in
Pa. In this manuscrip t we therefore refer to these values
as moduli of elasticity. All images in this article are line-
wise corrected. Actual measurements are done on
uncorrected images.
Sweers et al. Nanoscale Research Letters 2011, 6:270
/>Page 9 of 10
Abbreviations
AFM: Atomic force microscopy; SPI: single-point nanoindentation.
Acknowledgements
The authors thank Kirsten van Leijenhorst-Groener for protein expression
and purification and Sissi de Beer for advice on HarmoniX.
Authors’ contributions
VS and MLB supervised the project, KKMS performed the research, and
analyzed the results. KOW, MLB, and KKMS interpreted the results. All authors
critically discussed the results and the manuscript.
Competing interests
The authors declare that they have no competing interests.
Received: 7 December 2010 Accepted: 30 March 2011
Published: 30 March 2011
References
1. Dobson CM: Protein folding and misfolding. Nature 2003, 426:884-890.
2. Hoyer W, Antony T, Cherny D, Heim G, Jovin TM, Subramaniam V:
Dependence of α-synuclein aggregate morphology on solutions
conditions. J Mol Biol 2002, 322:383-393.
3. Segers-Nolten I, Van der Werf K, Van Raaij M, Subramaniam V: Quantitative
characterization of protein nanostructures using atomic force
microscopy. proceedings of the IEEE Conf Eng Med Biol Soc 2007, 6609-6612.
4. van Raaij ME, Segers-Nolten IMJ, Subramaniam V: Quantitative
morphological analysis reveals ultrastructural diversity of amyloid fibrils
from α-synuclein mutants. Biophys J: Biophys Lett 2006, 91:L96-L98.
5. Schultz W: Lewy bodies. Proc Natl Acad Sci 2006, 103:166-168.
6. Goedert M: Alpha-synuclein and neurodegenerative diseases. Nat Rev
Neurosci 2001, 2:492-501.
7. Jansen R, Dzwolak W, Winter R: Amyloidogenic self-assembly of insulin
aggregates probed by high resolution atomic force microscopy. Biophys
J 2005, 88:1344-1353.
8. Adamcik J, Jung JM, Flakowski J, Rios De Los P, Dietler G, Mezzenger R:
Understanding amyloid aggregation by statistical analysis of atomic
force microscopy images. Nat Nanotechnol 2010, 5:423-428.
9. Cherny I, Gazit E: Amyloids: not only pathological agents but also
ordered nanomaterials. Angew Chem Int Ed 2008, 47:4062-4069.
10. Knowles TP, Fitzpatrick AW, Meehan S, Mott HR, Vendruscolo M,
Dobson CM, Welland ME: Role of intermolecular forces defining material
properties of protein nanofibrils. Science 2007, 318:1900-1903.
11. Smith JF, Knowles TPJ, Dobson CM, MacPhee CM, Welland ME:
Characterization of the nanoscale properties of individual amyloid fibrils.
Proc Natl Acad Sci 2006, 103:15806-15811.
12. Sullan RMA, Gunari N, Tanur AE, Chan Y, Dickinson GH, Orihuela B,
Rittschof D, Walker GC: Nanoscale structures and mechanics of barnacle
cement. Biofouling 2008, 25:263-275.
13. Yu J, Malkova S, Lyubchenko YL: α-Synuclein misfolding: single molecule
AFM force spectroscopy study. J Mol Biol 2008, 384:992-1001.
14. Dong M, Hovgaard MB, Mamdouh W, Xu S, Otzen DE, Besenbacher F: AFM-
based force spectroscopy measurements of mature amyloid fibrils of the
peptide glucagon. Nanotechnology 2008, 19:384013.
15. Heim AJ, Matthews WG:
Determination of the elastic modulus of native
collagen fibrils via radial indentation. Appl Phys Lett 2006, 89:181902.
16. Guo S, Akhremitchev BB: Packing density and structural heterogeneity of
insulin amyloid fibrils measured by AFM nanoindentation.
Biomacromolecules 2006, 7:1630-1636.
17. Tan EPS, Lim CT: Nanoindentation study of nanofibers. Appl Phys Lett
2005, 87:123106.
18. Pittenger B, Erina N, Su C: Quantitative mechanical property mapping at
the nnoscale with PeakForce QNM. Application Note Veeco Instruments Inc
[ />Mechanical_Property_Mapping_at_the_Nanoscale_with_PeakForce-
QNM_AFM_AN128.pdf].
19. Rosa-Zeiser A, Weilandt E, Hild S, Marti O: The simultaneous measurement
of elastic, electrostatic and adhesive properties by scanning force
microscopy: pulsed-force mode operation. Meas Sci Technol 1997,
8:1333-1338.
20. Sahin O: Harnessing bifurcations in tapping-mode atomic force
microscopy to calibrate time-varying tip-sample force measurements.
Rev Sci Instrum 2007, 78:103707.
21. Garcia VJ, Martinez L, Briceno-Valero JM, Schilling CH: Dimensional
metrology of nanometric spherical particles using AFM: II, application of
model-tapping mode. Probe Microsc 1997, 1:107-116.
22. Burnham NA, Behrend OP, Oulevey F, Germaud G, Gallo P-J, Gourdon D,
Dupas E, Kulik AJ, Pollok HM, Briggs GAD: How does a tip tap?
Nanotechnology 1997, 8:67-75.
23. Cleveland JP, Anczykowski B, Schmid AE, Elings VB: Energy dissipation in
tapping-mode atomic force microscopy. Appl Phys Lett 1998,
72:2613-2615.
24. Sahin O, Magonov S, Su C, Quate CF, Solgaard O: An atomic force
microscope tip designed to measure time-varying nanomechanical
forces. Nat Nanotechnol 2007, 2:507-514.
25. Sahin O, Erina N: High-resolution and large dynamic range
nanomechanical mapping in tapping-mode atomic force microscopy.
Nanotechnology 2008, 19:445717.
26. Dong M, Husale S, Sahin O: Determination of protein structural flexibility
by microsecond force spectroscopy. Nat Nanotechnol 2009, 4:514-517.
27. Tamayo J, Calleja M, Ramos D, Mertens J: Underlying mechanisms of the
self-sustained oscillation of a nanomechanical stochastic resonator in a
liquid. Phys Rev B 2007, 76:180201.
28. Pirzer T, Hugel T: Atomic force microscopy spring constant determination
in viscous liquids. Rev Sci Instrum 2009, 80:035110.
29. Grellman W, Seidler S: Deformation and Fracture Behavior of Polymers.
Berlin: Springer-Verlag, First 2001.
30. Wang Y, Chen X: Carbon nanotubes: A promising standard for
quantitative evaluation of AFM tip apex geometry. Ultramicroscopy
2007,
107:293-298.
31. Zenhausern F, Adrian M, Heggeler-Bordied BT, Eng LM, Descouts P: DNA
and RNA polymerase/DNA complex imaged by scanning force
microscopy: Influence of molecular-scale friction. Scanning 1992,
14:212-217.
32. VanLandingham MR, Juliano TF, Hagon MJ: Measuring tip shape for
instrumented indentation using atomic force microscopy. Meas Sci
Technol 2005, 16:2173-2185.
33. Ohler B: Cantilever spring constant calibration using laser Doppler
vibrometry. Rev Sci Instrum 2007, 78:063107.
34. Cook SM, Schäffer TE, Chynoweth KM, Wigton M, Simmonds RW, Lang KM:
Practical implementation of dynamic methods for measuring atomic
force microscope cantilever spring constants. Nanotechnology 2006,
17:2135-2145.
35. Gibson CT, Smith DA, Roberts CJ: Calibration of silicon atomic force
microscope cantilevers. Nanotechnology 2005, 16:234-238.
36. Akhremitchev BB, Walker GC: Finite sample thickness effects on elasticity
determination using atomic force microscopy. Langmuir 1999,
15:5630-5634.
37. Knowles TPJ, Oppenheim TW, Buell AK, Chirgadze DY, Welland ME:
Nanostructured films from hierarchical self-assembly of amyloidogenic
proteins. Nat Nanotechnol 2010, 5:204-207.
38. Paparcone R, Keten S, Buehler M: Amyloid nanofibrils under compressive
loading. J Biomech 2009, 43:1196-1201.
39. Hertz H: Über die berührung fester elastischer körper (on the contact of
elastic solids). J Reine Angewandte Math 1882, 94:156-171.
40. Derjaguin BV, Muller VM, Toporov YUP: Effect of contact deformations on
the adhesion of particles. J Colloid Interface Sci 1975, 53:314-326.
doi:10.1186/1556-276X-6-270
Cite this article as: Sweers et al.: Nanomechanical properties of a-
synuclein amyloid fibrils: a comparative study by nanoindentation,
harmonic force microscopy, and Peakforce QNM. Nanoscale Research
Letters 2011 6:270.
Sweers et al. Nanoscale Research Letters 2011, 6:270
/>Page 10 of 10