Báo cáo hóa học: " Research Article Adaptive Single Image Superresolution " pot
Bạn đang xem bản rút gọn của tài liệu. Xem và tải ngay bản đầy đủ của tài liệu tại đây (7.49 MB, 13 trang )
Hindawi Publishing Corporation
EURASIP Journal on Advances in Signal Processing
Volume 2011, Article ID 852934, 13 pages
doi:10.1155/2011/852934
Research Article
Adaptive Single Image Superresolution Approach Using
Support Vector Data Description
Takahiro Ogawa (EURASIP Member) and Miki Haseyama
Graduate School of Information Science and Technology, Hokkaido University, Sapporo 060-0814, Japan
Correspondence should be addressed to Takahiro Ogawa,
Received 15 September 2010; Accepted 9 March 2011
Academic Editor: Abdelak Zoubir
Copyright © 2011 T. Ogawa and M. Haseyama. This is an open access article distributed under the Creative Commons Attribution
License, which permits unrestricted use, distribution, and reproduction in any medium, provided the original work is properly
cited.
An adaptive single image superresolution (SR) method using a support vector data description (SVDD) is presented. The proposed
method represents the prior on high-resolution (HR) images by hyperspheres of the SVDD obtained f rom training examples and
reconstructs HR images from low-resolution (LR) obser vations based on the following schemes. First, in order to perform accurate
reconstruction of HR images containing various kinds of objects, training HR examples are previously clustered based on the
distance from a center of a hypersphere obtained for each cluster. Furthermore, missing high-frequency components of the target
image are estimated in order that the reconstructed HR image minimizes the above distances. In this approach, the minimized
distance obtained for each cluster is utilized as a cr iterion to select the optimal hypersphere for estimating the high-frequency
components. This approach provides a solution to the problem of conventional methods not being able to perform adaptive
estimation of the high-frequency components. In addition, local patches in the target low-resolution (LR) image are utilized as
the training HR examples from the characteristic of self-similarities between different resolution levels in general images, and our
method can perform the SR without utilizing any other HR images.
1. Introduction
Estimation of high-resolution (HR) images from low-resolu-
tion (LR) images is one of the most important issues in
the field of digital imaging applications, and this research
field will always be important as long as limitations of
hardware and photo environments exist. Nearest neighbor,
bilinear, bicubic, and Lanczos-based approaches have been
traditionally utilized for enhancing spacial resolutions [1–3].
However, these approaches cannot preserve sharpness at
edges and textures in the obtained HR images since the miss-
ing high-frequency components cannot be reconstructed.
In order to overcome the limitations of the traditional
approaches, super-resolution (SR) methods have been exten-
sively studied by many researchers [1–16]. Most SR methods
are broadly categorized into two approaches, reconstruction-
based approach and learning-based approach. The
reconstruction-based approach estimates the HR image
from their multiple LR observations, and many methods
based on this a pproach have been proposed [1–6]. On the
other hand, the learning-based (example-based) approach
estimates the HR image from only its LR observation, but
several other HR images a re utilized to learn a prior on the
original HR image [8–16]. In this paper, we focus on the
learning-based approach and discuss its details.
In order to learn the prior on HR images, many methods
adopt multivariate analysis techniques. Principal component
analysis (PCA) is frequently utilized for hallucination of
face images [17]. Furthermore, kernel PCA (KPCA) is
capable of capturing a part of high-order statistics which
are particularly important for encoding image structures
[18, 19], and the obtained nonlinear eigenspace can success-
fully represent the priors. Therefore, by utilizing nonlinear
subspaces, KPCA-based face hallucination methods have also
been proposed [20, 21]. Kim et al. extended this approach to
multipatch-based SR of natural images [21].
It should be noted that the conventional approach has
the following three problems. (1) In the conventional KPCA-
based approach, eigenvectors, which span the nonlinear
eigenspace, cannot be directly defined, and the use of the
2 EURASIP Journal on Advances in Signal Processing
kernel trick becomes necessar y. Thus, even if the dimension
of the nonlinear subspace is reduced to a small value,
all tr a ining examples must be stored for representing this
subspace. Problems of memory consumption therefore occur
with increase in the number of training examples. (2)
In the conventional approach, since several other training
HR images must be prepared, suitable training images
must be provided manually. (3) The conventional approach
is based on the assumption that training examples are
globally similar, that is, they should represent a similar
class of objects. Therefore, if the target LR image contains
several kinds of objects or textures, the performance of the
conventional approach tends to be degraded.
Recently, the support vector learning method has become
a viable tool in the area of intelligent systems [22]. The
support vector machine (SVM) can define its separating
hyperplane utilized as a classifier from some suppor t vectors
which are selected from training examples. Furthermore,
support vector data description (SVDD) [23], whose interest
is another type of problem, that is, the problem of data
description or one-class classification, can also define its
separating hypersphere used as a classifier from only some
support vectors.
In this paper, we propose an adaptive single image SR
method using SVDD. Since the hypersphere of SVDD can be
applied to the data description, we utilize this hypersphere
as the subspace of the HR image. As described above, this
hypersphere is represented from only some support vectors,
and the first problem of the conventional KPCA-based
methods can be effectively solved by using SVDD. It is
well known that the center of the hypersphere in SVDD is
that of the distribution of a target object class. Therefore,
from this characteristic, the proposed method regards the
hypersphere of SVDD as the subspace of HR images. It
should be noted that SVDD, which is a one-class version of
SVM, has a characteristic of generalization. Therefore, the
proposed method tends to perform accurate reconstruction
even if tremendous number of training data cannot be
provided. Note that there have been proposed several SR
methods which use support vector regression as shown in
[24, 25]. These methods utilize the algorithm of SVM, that is,
support vector regression for SR. Therefore, their algorithm
is based on the regression for estimating HR images. On the
other hand, our method uses the hypersphere of SVDD as
the subspace of HR images. Then our method adopts entirely
different schemes from those conventional methods.
Furthermore, local patches within the target LR image
are utilized as HR training examples from a characteristic of
self-similarities between two different resolution levels. This
means that the training data can be obtained from only the
observed image, and the second problem of the conventional
methods can be solved. Then, in our method, every patch
has potential to be part of the training for individual target
patch. This is based on the characteristic of self-similarities as
shown in the above. It is well known that general images can
be accurately reconstructed from their own self-similarities,
and iterated function systems (IFS) [26]effectively use this
characteristic. Then, based on the idea of IFS, patches in
different resolution levels can be utilized for the accurate
reconstruction of images. Therefore, the proposed method
also uses the benefit of IFS.
In order to solve the third problem, we introduce
the following adaptive classification approach into the
estimation of missing high-frequency components in the
target image. The proposed method previously performs
clustering of training HR local patches based on distances
from the center of the hypersphere obtained for each cluster.
Furthermore, the high-frequency components minimizing
the distances are estimated by using the hypersphere of each
cluster. In this procedure, the proposed method monitors
the distances minimized in the estimation of the high-
frequency components and outputs the results obtained
from the optimal cluster minimizing these distances. This
classification approach thus enables adaptive estimation of
the high-frequency components for each local patch within
the target image, and reconstruction of the HR image is
realized without dependence on the conventional assump-
tion. Consequently, since the proposed method effectively
solves the problems of the conventional methods, successful
reconstruction of HR images can be expected.
This paper is organized as follows. In Section 2, the
SVDD utilized in the proposed method is explained. In
Section 3, the adaptive single image SR method using the
SVDD is presented. Experimental results that verify the
performance of the proposed method are shown in Section 4 .
Finally, concluding remarks are presented in Section 5.
2. Support Vector Data Description
In this section, the SVDD utilized in the proposed method
is explained. The SVDD was developed by Tax and Duin to
solve one-class classification problems [23]. Inspired by the
support vector machine learning theory, the SVDD obtains
a boundary around the target data set; this boundar y is used
to decide whether new objects are target objects or outliers.
Given a set of training target data x
i
(i = 1, 2, , N), the
simplest form of the SVDD defines a hypersphere around
the data. The sphere is characterized by a center a and a
radius R. The goal is to minimize the volume of the sphere
(i.e., minimize R
2
) while keeping all training objects inside
its boundary. Thus, the following constrained optimization
problem must be solved:
min
R,a,ξ
i
R
2
+ T
N
i=1
ξ
i
s.t. x
i
− a
2
≤ R
2
+ ξ
i
, ξ
i
≥ 0,
(
i = 1, 2, , N
)
,
(1)
where the parameter T controls the trade-off between the
volume and errors, and ξ
i
is a slack variable. Then, from the
obtained center a and the radius R, we can decide whether
new objects x are the target objects P or outliers as follows:
x
∈ P if f
svdd
(
x
)
≥ 0
x /
∈ P otherwise
f
svdd
(
x
)
= R
2
−x − a
2
.
(2)
EURASIP Journal on Advances in Signal Processing 3
High-resolution (HR) image F
Blurred high-resolution (HR) image
^
F
Low-pass filter
Downsampling
Upsampling
Low-resolution (LR) image
f
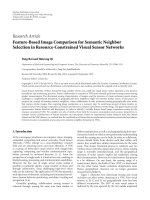
Figure 1: Relationship between HR image F, blurred HR image
F, and LR image f .
Clustering of local patches (3.1)
LR image f (training image)
SVDD
SVDD-based adaptive SR (3.2)
Selection of the optimal hypersphere
Unknown HR image F
Blurred HR image
^
F
Target local patch g
target
Figure 2: Overview of the adaptive single image SR method based on SVDD.
In the above equation, the output f
svdd
monotonically
decreases with increase in the distance
x−a
2
between x and
the center a. Therefore, when f
svdd
becomes larger, x becomes
closer to a. Furthermore, the center a of the sphere represents
that of the probabilistic density for the target objects.
3. SVDD-Based Adaptive SR Method
The adaptive SR method based on the SVDD is presented
in this section. As shown in Figure 1, the target LR image f ,
which we observe, is obtained by blurring and subsampling
the HR image F (in this paper, we assume any noises
are not included in the target LR image f to make the
problem easier.) We can easily calculate the blurred HR
image
F in Figure 1 by upsampling the target LR image f .
However, it is difficult to reconstruct F from
F since the
high-frequency components of F are missed by the low-pass
filter. Therefore, using the separating hypersphere obtained
from training examples by the SVDD, the proposed method
tries to estimate the missing hig h-frequency components.
It is well known that local patches between two different
resolution levels are similar to each other. Therefore, we
utilize local patches within the LR image f for calculating the
hypersphere of HR patches. This means the training data can
be obtained from only the target LR image f in the proposed
method.
It should be noted that in the target LR image f , there
are many local patches which are quite different from each
other. Such local patches should not affect the estimation
of the missing high-frequency components for the target
local patch within
F. Therefore, as shown in Figure 2, the
proposed method generates the separating hypersphere for
each cluster containing similar patches, and the optimal
sphere is adaptively utilized for the target local patch in
F.
In order to realize this scheme, clustering of the local patches
within the target LR image f must first be performed before
the high-frequency component estimation of the image
F.
Thus, clustering of local patches within the LR image f is
explained in Section 3.1, and SVDD-based estimation of the
missing high-frequency components is shown in Section 3.2.
3.1. Clustering of Training Local Patches. In this subsection,
local patches within the LR image f are clustered into
K clusters C
k
(k = 1, 2, , K). First, we clip N local
patches f
i
(w × h pixels, i = 1, 2, , N) as the training
examples from the target LR image f and generate vectors
4 EURASIP Journal on Advances in Signal Processing
x
i
(i = 1, 2, , N), whose elements are their raster scanned
intensities. Next, we map x
i
into the feature space to obtain
φ(x
i
) by using the nonlinear map φ whose kernel function is
the Gaussian kernel [18]. Furthermore, the proposed method
assigns f
i
to cluster C
k
minimizing the following normalized
distance:
E
k
i
=
φ
(
x
i
)
− a
k
2
R
k
2
. (3)
In the above equation, a
k
and R
k
are the center vector and
the radius of the hypersphere obtained from φ(x
k
j
)(j =
1, 2, , N
k
) by the SVDD, where φ(x
k
j
) represents φ(x
i
)
belonging to cluster C
k
. Furthermore, a
k
and R
k
are obtained
by solving the following optimization problem:
min
R
k
,a
k
,ξ
k
j
R
k
2
+ T
k
N
k
j=1
ξ
k
j
s.t. φ(x
k
j
) − a
k
2
≤ R
k
2
+ ξ
k
j
,
ξ
k
j
≥ 0
j = 1, 2, , N
k
,
(4)
where the parameter T
k
controls the trade-off between the
volume and errors, and ξ
k
j
is a slack variable. Note that for
each cluster, the radius R
k
is different since it depends on
the features of the belonging local patches. Thus, even if a
target object is far from the center a
k
but included in the
hypersphere of radius R
k
, it should be assigned to cluster C
k
.
This means simple use of the distance
φ(x
i
) − a
k
2
may not
be suitable for the criterion E
k
i
. Therefore, in our method, the
normalized distance
φ(x
i
) − a
k
2
/R
k
2
is utilized for E
k
i
.
In the proposed method, we utilize (3) as the criterion
representing how suitable the HR local patch f
i
is for cluster
C
k
. Therefore, we assign each HR training local patch f
i
to
cluster C
k
minimizing this criterion. The calculation of a
k
and R
k
is presented in the rest of this subsection.
The constraints in the optimization problem of (4)can
be rewritten as follows:
φ
x
k
j
2
− 2a
k
φ
x
k
j
+
a
k
2
− R
k
2
− ξ
k
j
≤ 0,
−ξ
k
j
≤ 0
j = 1, 2, , N
k
.
(5)
From the above constraints, the Lag range multipliers for
solving the optimization problem in (4)areprovidedbelow.
L
k
= R
k
2
+ T
k
N
k
j=1
ξ
k
j
−
N
k
j=1
α
k
j
R
k
2
+ ξ
k
j
−
φ
x
k
j
2
− 2a
k
φ
x
k
j
+
a
k
2
−
N
k
j=1
β
k
j
ξ
k
j
,
(6)
where
L
k
= L
R
k
, a
k
, ξ
k
, α
k
, β
k
. (7)
In order to solve the optimization problem, we need to
maximize the Lagrange multipliers L
k
with α
k
j
and β
k
j
( j =
1, 2, , N
k
) and minimize L
k
with R
k
, a
k
,andξ
k
j
. Note that
the derivatives of L
k
with respect to R
k
, a
k
,andξ
k
j
become
zero at the optimal solution, and
∂L
k
∂R
k
= 0,
∂L
k
∂a
k
= 0,
∂L
k
∂ξ
k
j
= 0,
(8)
are satisfied. Therefore, this provides the following equa-
tions:
N
k
j=1
α
k
j
= 1,
(9)
a
k
=
N
k
j=1
α
k
j
φ
x
k
j
, (10)
T
k
− α
k
j
− β
k
j
= 0.
(11)
Then, by substituting (9)–(11) into (6), the following dual
problem can be obtained:
max
α
k
j
N
k
j=1
α
k
j
κ
x
k
j
, x
k
j
−
N
k
i=1
N
k
j=1
α
k
i
α
k
j
κ
x
k
i
, x
k
j
s.t.
N
k
j=1
α
k
j
= 1, 0 ≤ α
k
j
≤ T
k
j = 1, 2, , N
k
,
(12)
where κ(
·, ·) is the Gaussian kernel function, and it satisfies
κ
x
k
i
, x
k
j
=
φ
x
k
i
φ
x
k
j
.
(13)
By solving the optimization problem shown in (12)with
respect to α
k
j
( j = 1, 2, , N
k
), R
k
2
is obtained as follows:
R
k
2
= κ
x
k
sv
, x
k
sv
−
2
N
k
j=1
α
k
j
κ
x
k
j
, x
k
sv
+
N
k
i=1
N
k
j=1
α
k
i
α
k
j
κ
x
k
i
, x
k
j
,
(14)
where x
sv
is a support vector whose α
k
j
satisfies 0 <α
k
j
<T
k
.
Furthermore, the center vector a
k
of the hypersphere can be
obtained from (10).
In this way, iterating the assignment based on (3), the
proposed method realizes the clustering of the training HR
EURASIP Journal on Advances in Signal Processing 5
(i) A target local patch g
target
is obtained to calculate the vector l.
(ii) The optimization problem in (15)issolvedby(23) for each cluster k (k
= 1, 2, , K).
(iii) The criterion E
k
in (24)iscalculatedforeachclusterk (k = 1, 2, , K).
(iv) According to the obtained criterion E
k
, the following steps are operated for each cluster.
(a) If E
k
<E
k
(k
={1, 2, , K | k
/
= k}), i.e., E
k
of cluster k becomes the
minimum value among all classes, k
opt
= k,andE
k
opt
and x
k
opt
are obtained.
(b) Otherwise, their results are discarded.
(v) From the obtained result
x
k
opt
, the following steps are operated.
(a) If a target pixel has not been reconstructed, the intensity within
x
k
opt
is output.
(b) If a target pixel has already been reconstructed by other local patches and E
k
opt
in (iv)
is smaller than their results, the intensity is renewed by the result in
x
k
opt
.
(c) Otherwise, the result in
x
k
opt
is discarded.
(vi) Local patches are clipped from
F in a raster scanning order, and procedures (i)–(v) are iterated.
Algorithm 1: Specific procedures of the high-frequency component estimation in the proposed method.
local patches f
i
to K clusters (it should be noted that
the initial clusters are simply provided by performing k-
means clustering.) Furthermore, by applying the SVDD to
each cluster, its hypersphere can be respec tively obtained.
This hypersphere represents the separating sphere which
can decide whether target patches are HR ones or not in
each cluster. Therefore, the proposed method utilizes this
hypersphere as a subspace of HR images in each cluster.
Note that the hypersphere of the SVDD is represented by its
center vector a
k
and radius R
k
, and these two can be defined
from only some support vectors x
k
sv
in each cluster C
k
.In
detail, α
k
j
whose x
k
j
is not the support vector becomes zero
by solving the optimization problem in (12). Then a
k
and R
k
can be represented by some training HR local patches of the
support vectors. Therefore, the hypersphere can also be rep-
resented by these t raining HR patches, and we can effectively
solve the problem in the conventional kernel PCA-based
approach.
3.2. SVDD-Based Estimation of High-Frequency Components.
In this subsection, we explain the SVDD-based method
for e stimating the missing high-frequency components in
F from the clustering results obtained in the previous
subsection. First, we clip a local patch g
target
(w × h pixels)
from
F and obtain a vector l whose elements are the raster
scanned intensities of g
target
. Furthermore, by using cluster
C
k
, the proposed method estimates the HR result x
k
of g
target
by solving the following optimization problem:
max
x
k
f
k
SVDD
x
k
s.t. Lx
k
= l,
(15)
where L is the matrix representing the low-pass filter. In
our method, a simple sinc filter with a hamming window is
utilized. Furthermore, f
k
SVDD
(x
k
) is obtained as
f
k
SVDD
x
k
=
R
k
2
−φ
x
k
−
a
k
2
.
(16)
Then, from the above equation, the optimization problem in
(15) can be rewritten as follows:
min
x
k
ρ
x
k
=
φ
x
k
−
a
k
2
s.t. Lx
k
= l.
(17)
As shown in the above equation, x
k
is estimated to minimize
the distance from the center vector a
k
of the hypersphere for
cluster C
k
in the feature space. Denoting the vector whose
elements are the high-frequency components estimated by
cluster C
k
as
h
k
, the optimal solution x
k
is written as
x
k
= l +
h
k
.
(18)
Then we find
h
k
minimizing the following equation under
the constraint in (17), and the optimal solution can be
obtained.
ρ
h
k
=
φ
l + h
k
−
a
k
2
= φ
l + h
k
φ
l + h
k
+ a
k
a
k
− 2φ
l + h
k
a
k
= 1+a
k
a
k
− 2φ
l + h
k
a
k
.
(19)
By using (10), the derivative of (19)withrespecttoh
k
is
obtained as follows:
∂
ρ
h
k
∂h
k
=−
N
k
j=1
4α
k
j
θ
k
l + h
k
− x
k
j
κ
l + h
k
, x
k
j
,
(20)
where θ
k
is a parameter of the Gaussian kernel. Furthermore,
at the extremum of
ρ,
∂
ρ
h
k
∂h
k
= 0
(21)
is satisfied, and the following equation can be derived:
h
k
=
N
k
j=1
α
k
j
κ
l + h
k
, x
k
j
x
k
j
N
k
j=1
α
k
j
κ
l + h
k
, x
k
j
−
l.
(22)
Therefore, by renewing h
k
t
in the following equation under
the constraint shown in (17), the proposed method enables
the calculation of the optimal result
h
k
.
h
k
t+1
=
N
k
j=1
α
k
j
κ
l + h
k
t
, x
k
j
x
k
j
N
k
j=1
α
k
j
κ
l + h
k
t
, x
k
j
−
l.
(23)
6 EURASIP Journal on Advances in Signal Processing
(a) (b) (c)
(d) (e) (f)
Figure 3: Subjective performance comparison between the proposed method and the conventional methods (The magnification factor was
set to four): (a) original HR image “Lena” (512
× 512 pixels), (b) LR image (128 × 128 pixels), (c) HR image estimated by the proposed
method, (d) HR image estimated by the interpolation using Lanczos filter, (e) HR image estimated by [10], (f) HR image estimated by [21].
Table 1: Image enlargement performance comparison (SSIM) of the proposed method and the conventional methods (magnification factor
= 4).
Test image LR Lanczos filter Reference [10] Referenc e [21] Proposed method
Lena 0.7114 0.8542 0.8168 0.8206 0.8530
Goldhill 0.5984 0.7488 0.7133 0.7426 0.7763
Peppers 0.7206 0.8449 0.8274 0.8044 0.8488
Boat 0.6560 0.7868 0.7500 0.7701 0.8003
Girl 0.7831 0.8979 0.8798 0.8809 0.9039
Mandrill 0.3900 0.5322 0.4907 0.5478 0.6008
Then the estimation result
h
k
of the high-frequency com-
ponents by cluster C
k
can be calculated, and the HR result
x
k
of g
target
is also obtained. The above estimation scheme is
similar to the preimage estimation algorithm from the high-
dimensional feature space in [27].
Generally, the center a
k
of the separating hypersphere
represents that of the probabilistic density for the HR patches
in cluster C
k
. Therefore, the proposed method estimates x
k
of g
target
in order that it minimizes the distance ρ(x
k
)from
the center a
k
. Furthermore, if we can classify g
target
into the
optimal cluster C
k
opt
, its high-frequency components can be
more accurately estimated by the optimal hypersphere. Thus,
we utilize the criterion in (3),anditisdefinedas
E
k
=
φ
x
k
−
a
k
2
R
k
2
,
(24)
and output
x
k
opt
(k
opt
= 1, 2, , K) minimizing this criterion
as the final result.
As described above, we can reconstruct the HR local
patch from g
target
. The proposed method clips local patches
g
target
(w × h pixels) at the same interval in a raster scanning
EURASIP Journal on Advances in Signal Processing 7
(a) (b) (c)
(d) (e) (f)
Figure 4: Zoomed portions of the results in Figure 3: (a) zoomed portion of Figure 3(a), (b) zoomed portion of Figure 3(b),(c)zoomed
portion of Figure 3(c), ( d) zoomed portion of Figure 3(d), (e) zoomed portion of Figure 3(e), and (f) zoomed portion of Figure 3(f).
orderfromtheblurredHRimage
F. Furthermore, each local
patch is reconstructed by the above schemes. Note that each
pixel has multiple estimation results if the clipping interval
is smaller than the size of the local patches. In this case, the
proposed method regards the result minimizing the criterion
in (24) as the final result. Then we can realize adaptive
example-based SR of the target LR image. Finally, we show
the specific procedures of the high-frequency component
estimation in Algorithm 1.
Note that in our method, we only focus on the resolution
enhancement of the target LR image. However, the target LR
images may be degraded by some blurring effects. If the blur
function is included in the degradation process, we have to
change the matrix L in (15) to the matrix including not only
the low-pass filter but also the blurring. Specifically, given the
matrix B representing the blurring, (15)iswrittenas
max
x
k
f
k
SVDD
x
k
s.t. LBx
k
= l,
(25)
where l corresponds to the vector of the target local patch
which is also corrupted by the blurring. Then, by solving the
above equation, the proposed method can reconstruct the
HR image from its LR image degraded by the blurring. It
should be noted that in order to realize this reconstruction,
we have to per form blur estimation, and it must be provided
by some other methods.
4. Experimental Results
The performance of the proposed method is verified in
this section. As shown in Figure 3(a), we used a test image
“Lena” of 512
× 512 pixels in size and 8 bits/pixel as an
HR image. In order to obtain its LR image, we subsampled
this image to 128
× 128 pixels by using a Lanczos filter
as shown in Figure 3(b) (in this figure, we simply enlarge
the LR image to the same size of the HR image.) Next,
the proposed method was applied to the LR target image
to estimate the HR image as shown in Figure 3(c), that is,
the magnification factor was set to four (in the subjective
evaluation, we set the magnification factor to four. This
is because it becomes difficult to identify the difference of
the performance between the proposed method and the
conventional methods in the figures if the magnification
factor is set to two. Thus, the quantitative evaluation of
the magnification factor being two is shown in Ta ble 2.)
In order to utilize the proposed method, we simply set its
parameters as follows: w
= 8, h = 8, K = 10, and θ
k
(k = 1, 2, , K)issetto10
−3
× the var i ance for x
i
− x
j
2
(i, j = 1, 2, , N). The parameters w and h were determined
8 EURASIP Journal on Advances in Signal Processing
(a) (b) (c)
(d) (e) (f)
Figure 5: Subjective performance comparison between the proposed method and the conventional methods (the magnification factor was
set to four): (a) original HR image “Goldhill” (512
× 512 pixels), (b) LR image (128 × 128 pixels), (c) HR image estimated by the proposed
method, ( d) HR image estimated by the interpolation using Lanczos filter, (e) HR image estimated by [10], and (f) HR image estimated by
[21].
based on other conventional methods. This means that the
proposed method set w and h to the values similar to those
of the conventional methods. Next, K should be determined
from the number of texture patterns contained within the
target image, but it cannot be easily determined. Thus, in
the proposed method, we assume that the number of the
texture patterns within the target image is less than 10,
and K is set to 10. It should be noted that for images
including many texture patterns, K must be set to a lager
value. Furthermore, θ
k
was roughly determined from some
preliminary experiments, but it was not always the optimal
value for all images. Therefore, in the proposed method, K
and θ
k
should be adaptively determined from the target LR
image. This will be addressed in the future work.
In the proposed method, the number of training patches,
N is one of the most important factors for the accurate
reconstruction of HR images. However, it is difficult to
determine the suitable value of N, and its optimal number
will change for each target image. We can guess that the
proposed method does not require tremendous number
of training examples since the SVDD has a characteristic
of generalization. However, if N istoosmallavalue,the
performance of the proposed method is not guaranteed, nat-
urally. As described above, since it is difficult to estimate the
suitable value of N, we present two approaches for increasing
the number of the training examples. In one approach,
we downsample the target LR image iteratively, and obtain
multiple smaller images to get more training patches. By
focusing on the self-similarities in general images, the
number of the training examples can be increased, effectively.
Furthermore, the other approach is the use of several other
LR images which are similar to the target LR image. If we can
obtain such LR images, the performance improvement of the
proposed method can be expected. This idea is related to the
reconstruction-based SR approach. In this approach, the HR
image is reconstructed from its multiple LR observations. It
should be noted that our method does not utilize unique
procedures in the reconstruction-based approach, such as
registration, and thus the total procedures are quite different.
However, the idea of the use of multiple LR observations
for improving the performance of SR is similar. Therefore,
if LR images similar to the target LR image can be retrieved
from a database, more accurate estimation of the HR image
becomes feasible. Note that in this experiment, we did not
use the above two approaches since training examples could
be sufficiently provided.
For comparison, we respectively show results obtained
by the interpolation method using the Lanczos filter, and the
EURASIP Journal on Advances in Signal Processing 9
(a) (b) (c)
(d) (e) (f)
Figure 6: Zoomed portions of the results in Figure 5: (a) zoomed portion of Figure 5(a), (b) zoomed portion of Figure 5(b),(c)zoomed
portion of Figure 5(c), ( d) zoomed portion of Figure 5(d), (e) zoomed portion of Figure 5(e), and (f) zoomed portion of Figure 5(f).
conventional methods [10, 21 ] in Figures 3(d)–3(f) (in this
experiment, we performed the enhancement of the results
obtained by our method and the conventional methods for
better evaluation. Specifically, the high-frequency compo-
nents were enhanced by the high-boost filter in the same way
as [21].) The conventional method in [10]isarepresentative
method of the example-based SR. Fur thermore, the method
in [21] is also a representative method which utilizes kernel
PCA for obtaining the prior on HR images to perform the
SR. Thus, in this experiment, we utilized these conventional
methods for the comparison of our method. Note that
the conventional methods need other training HR images
for estimating missing high-frequency components. In
this experiments, we obtain the training data by the same
schemes in the proposed method. Furthermore, as shown
in Figure 4, we show the zoomed portions of the results
obtained by the proposed method and the conventional
methods for b etter subjective evaluation. From the obtained
results, we can see that the proposed method preserves
the sharpness more successfully than do the conventional
methods. Furthermore, we also show the results of “Goldhill”
as shown in Figures 5 and 6, w here the magnification factor
was also set to four. Note that the proposed method performs
block-based procedures, and this causes some artifacts at
several areas, such as chin of Lena in Figure 3. Other
conventional methods also utilize the same procedures, and
they also suffer from such artifacts in several areas. Therefore,
for all methods adopting the block-based procedures, that
10 EURASIP Journal on Advances in Signal Processing
(a) (b) (c)
(d) (e) (f)
Figure 7: Subjective performance comparison between the proposed method and the conventional methods: (a) test image (1600 × 1200
pixels), (b) LR image (100
× 100 pixels) clipped from (a), (c) HR image estimated by the proposed method, (d) HR image estimated by the
interpolation using Lanczos filter, (e) HR image estimated by [10], and (f) HR image estimated by [21]. The obtained results are 400
× 400
pixels, that is, the mag nification factor is set to four.
is, not only the proposed method but also the conventional
methods, several deblocking filters should be used, or some
schemes including deblocking effects are necessary.
In order to quantitatively evaluate the performance of the
proposed method, we use six test images “Lena”, “Goldhill”,
“Peppers”, “Boat”, “Girl”, and “Mandrill” and performed the
same simulations as those for which results are shown in
Figures 3–6. It should be noted that the MSE (PSNR) and its
variants cannot accurately represent the visual image quality
[28, 29]. Therefore, in this experiment, we utilized the SSIM
index [30] which is a representative quality measure utilized
in many fields of image processing. Tables 2 and 1 show
the results of the SSIM index obtained by the proposed
method and the conventional methods, where Tabl e 2 is the
result of the magnification factor being two, and Table 1 is
the result of the magnification factor being four. It can be
seen that our method has achieved an improvement over the
conventional methods. Therefore, good performance of the
proposed method was verified by the exper iments.
We discuss the effectiveness of the proposed method.
In the KPCA-based method [21], eigenvectors, which span
the nonlinear eigenspace, cannot be directly obtained. Thus,
even if the dimension of the nonlinear subspace is reduced
to a small value, all training examples must be stored
for expressing this subspace, and problems of memory
consumption occur with increase in the number of the
training examples. On the other hand, since the SVDD
can also define its separating hypersphere from only some
support vectors, the proposed method can effectively solve
this problem. Specifically, the ratio of support vectors
utilized for representing the hypersphere of each cluster
is less than 30% of training examples. Furthermore, the
conventional method [21] is based on the assumption that
training examples are globally similar, that is, they should
represent a similar class of objects. Therefore, if a target LR
image contains several kinds of objects, the performance of
the conventional approach tends to be degraded. On the
other hand, the proposed method monitors the minimized
distances in the estimation process of the missing high-
frequency components to select the optimal hypersphere
utilized for target patches. This approach thus enables
adaptive reconstruction of HR images, and successful SR
becomes feasible. In addition, our method needs only the
target LR image, and we do not have to depend on any other
training HR images. Therefore, our method can realize single
image SR.
Finally, we show experimental results obtained by apply-
ing the proposed and conventional methods to an actual
EURASIP Journal on Advances in Signal Processing 11
(a) (b) (c)
(d) (e)
Figure 8: Zoomed portions of the results in Figure 7: (a) zoomed portion of Figure 7(b), (b) zoomed portion of Figure 7(c),(c)zoomed
portion of Figure 7(d), (d) zoomed portion of Figure 7(e), and (e) zoomed portion of Figure 7(f).
LR image captured from a commercially available camera
“Canon IXY DIGITAL 50”. It should be noted that the
experiments were performed under the same conditions
as those shown in the above. From the obtained results
shown in Figures 7 and 8, we can see that the proposed
method also realizes more successful reconstruction of
the HR images than those of the conventional methods.
Furthermore, the difference between the proposed method
and the conventional methods becomes more significant as
the amount of the high-frequency components in the target
images becomes larger.
5. Conclusions
An adaptive single image SR method using SVDD is
proposed in this paper. In the proposed method, training
HR examples are previously clustered, and the separating
hypersphere is obtained for each cluster by the SVDD. Note
that in our method, local patches in the target LR image
are utilized as training examples from the characteristic
of self-similarities. Then we can estimate missing high-
frequency components minimizing the distances from the
center of the hypersphere from only known low-frequency
components. Furthermore, the proposed method introduces
adaptive selection of the optimal hypersphere into the
estimation of the missing high-frequency components by
monitoring the minimized distances. This approach enables
adaptive estimation of high-frequency components for each
local patch within the target image. Therefore, successful
reconstruction of HR images can be realized by our SVDD-
based method.
Note that the results obtained by the proposed method
suffer from some artifacts in high frequency areas. Since our
method performs block-based procedures, some blocking
12 EURASIP Journal on Advances in Signal Processing
Table 2: Image enlargement performance comparison (SSIM) of the proposed method and the conventional methods (magnification factor
= 2).
Test image LR Lanczos filter Reference [10] Referenc e [21] Proposed method
Lena 0.8548 0.9358 0.9348 0.9356 0.9371
Goldhill 0.8010 0.8911 0.8872 0.8956 0.9170
Peppers 0.8822 0.9509 0.9514 0.9473 0.9522
Boat 0.8146 0.8935 0.8899 0.8965 0.9164
Girl 0.9072 0.9655 0.9646 0.9665 0.9641
Mandrill 0.6551 0.7582 0.7500 0.7720 0.8265
artifacts may occur in the regions of block boundaries.
Therefore, in future work, we should combine the proposed
method and some deblocking filters.
Acknowledgment
This research was partly supported by a Grant-in-Aid for
Scientific Research (B) 21300030, from the Japan Society for
the Promotion of Science (JSPS).
References
[1]S.C.Park,M.K.Park,andM.G.Kang,“Super-resolution
image reconstruction:a technical overview,” IEEE Signal Pro-
cessing Magazine, vol. 20, no. 3, pp. 21–36, 2003.
[2] R. Keys, “Cubic convolution interpolation for digital image
processing,” IEEE Transactions on Acoustics, Speech, and Signal
Processing, vol. 29, no. 6, pp. 1153–1160, 1981.
[3]A.V.OppenheimandR.W.Schafer,Discrete-Time Signal
Processing, Prentice Hall, Upper Saddle River, NJ, USA, 2nd
edition, 1999.
[4] S. Baker and T. Kanade, “Limits on super-resolution and how
to break them,” IEEE Transactions on Pattern Analysis and
Machine Intelligence, vol. 24, no. 9, pp. 1167–1183, 2002.
[5] S. Farsiu, D. Robinson, M. Elad, and P. Milanfar, “Advances
and challenges in super-resolution,” International Journal of
Imaging Systems and Technology, vol. 14, no. 2, pp. 47–57,
2004.
[6] J.D.vanOuwerkerk,“Imagesuper-resolutionsurvey,”Image
and Vision Computing, vol. 24, no. 10, pp. 1039–1052, 2006.
[7] C. V. Jiji, S. Chaudhuri, and P. Chatterjee, “Single frame
image super-resolution:should we process locally or globally?”
Multidimensional Systems and Signal Processing, vol. 18, no. 2-
3, pp. 123–152, 2007.
[8] A. Hertzmann, C. E. Jacobs, N. Oliver, B. Curless, and D.
H. Salesin, “Image analogies,” in Proceedings of the Computer
Graphics Annual Conference (SIGGRAPH ’01), pp. 327–340,
August 2001.
[9] W. T. Freeman, E. C. Pasztor, and O. T. Carmichael, “Learning
low-level vision,” International Journal of Computer Vision, vol.
40, no. 1, pp. 25–47, 2000.
[10] W. T. Freeman, T. R. Jones, and E. C. Pasztor, “Example-based
super-resolution,” IEEE Computer Graphics and Applications,
vol. 22, no. 2, pp. 56–65, 2002.
[11] T. A. Stephenson and T. Chen, “Adaptive markov random
fields for example-based super-resolution of faces,” EURASIP
Journal on Applied Sig nal Processing, vol. 2006, Article ID
31062, 11 pages, 2006.
[12] Q. Wang, X. Tang, and H. Shum, “Patch based blind image
super resolution,” in Proceedings of the IEEE International
Conference on Computer Vision (ICCV ’05), vol. 1, pp. 709–
716, 2005.
[13] X. Li, K. M. Lam, G. Qiu, L. Shen, and S. Wang, “An
efficient example-based approach for image super-resolution,”
in Proceedings of the IEEE International Conference Neural
Networks and Signal Processing (ICNNSP ’08), pp. 575–580,
June 2008.
[14] J. Sun, N. N. Zheng, H. Tao, and H. Y. Shum, “Image
hallucination with primal sketch priors,” in Proceedings of the
IEEE Computer Society Conference on Computer Vision and
Pattern Recognition (CVPR ’03), vol. 2, pp. 729–736, June 2003.
[15] C. V. Jiji, M. V. Joshi, and S. Chaudhuri, “Single-frame
image super-resolution using learned wavelet coefficients,”
International Journal of Imaging Systems and Technology, vol.
14, no. 3, pp. 105–112, 2004.
[16] C. V. Jiji and S. Chaudhuri, “Single-frame image super-
resolution through contourlet learning,” EUR ASIP Journal on
Applied Signal Processing, vol. 2006, Article ID 73767, 11 pages,
2006.
[17] X. Wang and X. Tang, “Hallucinating face by eigentransforma-
tion,” IEEE Transactions on Systems, Man and Cybernetics, Part
C, vol. 35, no. 3, pp. 425–434, 2005.
[18] B. Sch
¨
olkopf, A. Smola, and K. R. M
¨
uller, “Nonlinear principal
component analysis as a kernel eigen value problem,”
Neural
Computation, vol. 10, pp. 1299–1319, 1998.
[19] B. Sch
¨
olkopf, S. Mika, C. J. C . Burges et al., “Input space versus
feature space in kernel-based methods,” IEEE Transactions on
Neural Networks, vol. 10, no. 5, pp. 1000–1017, 1999.
[20] A. Chakrabarti, A. N. Rajagopalan, and R. Chellappa, “Super-
resolution of face images using kernel PCA-based prior,” IEEE
Transactions on Multimedia, vol. 9, no. 4, pp. 888–892, 2007.
[21] K. I. Kim, M. O. Franz, and B. Sch
¨
olkopf, “Iterative kernel
principal component analysis for image modeling,” IEEE
Transactions on Pattern Analysis and Machine Intelligence, vol.
27, no. 9, pp. 1351–1366, 2005.
[22] B. Sch
¨
olkopf and A. J. Smola, Learning with Kernels: Support
Vector Machines, Regularization, Optimization, and Beyond,
MIT Press, Cambridge, Mass, USA, 2002.
[23] D. M. J. Tax and R. P. W. Duin, “Support vector data
description,” Machine Learning, vol. 54, no. 1, pp. 45–66, 2004.
[24] P. M. Goebel and A. N. Belbachir, “Single image superres-
olution interpolation by wavelet support vector regression,”
in Proceedings of the Wavelets and Applications Semester and
Conference, 2006.
[25] K. Ni and T. Q. Nguyen, “Image superresolution using support
vector regression,” IEEE Transactions on Image Processing, vol.
16, no. 6, pp. 1596–1610, 2007.
EURASIP Journal on Advances in Signal Processing 13
[26] A. E. Jacquin, “Image coding based on a fractal theory of
iterated contractive i mage transformations,” IEEE Transactions
of Image Processing, vol. 1, no. 1, pp. 18–30, 1992.
[27] S. Mika, B. Sch
¨
olkopf, A. Smola, K. M
¨
uller, M. Scholz, and
G. R
¨
atsch, “Kernel PCA and denoising in feature spaces,” in
Advances in Neural Information Processing Systems II,Morgan
Kaufman, San Mateo, Calif, USA, 1998.
[28] I. Avcbas, B. Sankur, and K. Sayood, “Statistical evaluation of
image quality measures,” Journal of Electronic Imaging, vol. 11,
no. 2, pp. 206–223, 2002.
[29] C. Staelin, D. Greig, M. Fischer, and R. Maurer, Neural
Network Image Scaling Using Spatial Errors, HP Laboratories,
Haifa, Israel, 2003.
[30] Z. Wang, A. C. Bovik, H. R. Sheikh, and E. P. Simoncelli,
“Image quality assessment:from error visibility to structural
similarity,” IEEE Transactions on Image Processing, vol. 13, no.
4, pp. 600–612, 2004.