Báo cáo hóa học: " Observation of strong anisotropic forbidden transitions in (001) InGaAs/GaAs single-quantum well by reflectance-difference spectroscopy and its behavior under uniaxial strain" potx
Bạn đang xem bản rút gọn của tài liệu. Xem và tải ngay bản đầy đủ của tài liệu tại đây (402.84 KB, 10 trang )
NANO EXPRESS Open Access
Observation of strong anisotropic forbidden
transitions in (001) InGaAs/GaAs single-quantum
well by reflectance-difference spectroscopy and
its behavior under uniaxial strain
Jin-Ling Yu, Yong-Hai Chen
*
, Chen-Guang Tang, ChongYun Jiang, Xiao-Ling Ye
Abstract
The strong anisotropic forbidden transition has been observed in a series of InGaAs/GaAs single-quantum well with
well width ranging between 3 nm and 7 nm at 80 K. Numerical calculations within the envelope function
framework have been performed to analyze the origin of the optical anisotropic forbidden transition. It is found
that the optical anisotropy of this transition can be mainly attributed to indium segregation effect. The effect of
uniaxial strain on in-plane optical anisotropy (IPOA) is also investigated. The IPOA of the forbidden transition
changes little with strain, while that of the allowed transition shows a linear dependence on strain.
PACS 78.66.Fd, 78.20.Bh, 78.20.Fm
Introduction
It is well known that in-plane optical anisotropy (IPOA)
can be introduced in a (001)-grown zinc-blende quantum
well (QW) when the symmetry is reduced from D
2d
to
C
2υ
[1-6]. There are two kinds of symmetry reduction
effect (SRE), one is bulk SRE, and the other is interface
SRE [2,4]. The bulk SRE can be introduced by electric
field, compositional variation across the QW and uniaxial
strain [7-10]. The IPOA induced by uniaxial strain in
GaAs/Al
x
Ga
1-x
As QWs has been reported by Shen [10],
Rau [8] and Tang [11]. However, as far as we know, this
effect in In
x
Ga
1-x
As/GaAs QW has never been reported.
The interface SRE, which origins from C
2υ
symmetry of
a (001) zinc-b lende i nterf ace, can be introduced by spe-
cial interface chemical bonds, segregation effect and the
anisotropic interface structures [2,3,6]. It was found that
the interface-induced IPOA was very strong in the QWs
sharing no-common-atom, while the IPOA in QWs shar-
ing common atoms such as GaAs/AlGaAs was too weak
to be observed by c onventional polarized spectroscopy
[2,4,10]. Fortunately, the weak IPOA in the AlGaAs/
GaAs and InGaAs/GaAs QWs can be w ell observed by
the reflectance-difference spectroscopy (RDS) [2,4,6].
Wang et al. has st udied forb idden transi tions in In
x
Ga
1-
x
As/GaAs by photoreflec tance (PR) and att ributed the
forbidden transition to the built-in electric field [12].
Chen et al. [1] and Ye et al. [6] observed anis otropic for-
bidden transition i n In
x
Ga
1-x
As/GaAs by RDS. Chen
ascribed the anisotropic forbidden transition to the inter-
play of interface C
2ν
symmetry and built-in electric field,
while Ye attri buted it to both the built-in electric field
and segregation effect. In this study, we observed strong
anisotropic forbidden transitions in a series of In
x
Ga
1-
x
As/GaAs single-quantum well (SQW) with well width
ranging b etween 3 nm a nd 7 nm at 80 K. Numerical cal-
culation within the envelope function framework have
been performed to analyze the origin of the optical aniso-
tropic forbidden transition. Detailed theory-experiment
comparisons show that the anisotropic forbidden transi-
tion can be mainly attributed to indium (In) se gregation
effect. Besides, the effect of uniaxial strain on in-plane
optical anisotr opy (IPOA) is also investigated. It is found
that, the IPOA of the forbidden transition nearly does
not change with strain, while that of the allowed transi-
tion shows a linear dependence on strain. Finally, an
* Correspondence:
Key Laboratory of Semiconductor Materials Science, Institute of
Semiconductors, Chinese Academy of Sciences, P.O. Box 912, Beijing 100083,
People’s Republic of China
Yu et al. Nanoscale Research Letters 2011, 6:210
/>© 2011 Yu et al; licensee Springer. This is an Open Access article distributed under the terms of the Creative Commons Attribution
License ( y/2.0), which permits unrestricted use, distribution, and reproduction in any medium,
provided the original work is properly cited.
interpretation of t he IPOA by perturbation theory is
given out.
Samples and experiments
AseriesofIn
0
.
2
Ga
0
.
8
As/GaAs SQW with different well
widths were grown on (001) semi-insulating Ga As by
molecular beam epitaxy. The SQW was sandwiched
between two thick GaAs layers. The nominal well
widths of the three samples were 3, 5, and 7 nm, respec-
tively. All epilayers were intentionally undoped. The
setup of our RDS, described in Ref. [13], is almost the
same as Aspnes et al. [14], except the position of the
monochromator. The relative refle ctance difference
between [110] and [1
10] directions, defined by Δr/r =2
(r
110
- r
110
)/(r
[110]
+ r
[110]
), was measured by RDS at 80
K. Here r
[110]
(r
[110]
) is the reflective index in the [110]
([1
10]) direction. We also did the reflectance measure-
ments, and thus obtained the ΔR/R spectra. Here R is
the r eflectivity of the sample and ΔR is the reflectivity
difference between samples with and without QW layer.
In order to study the effect of u niaxial strain on the
IPOA, we cleaved the sampl e with well width 5 nm into
a25×4mm
2
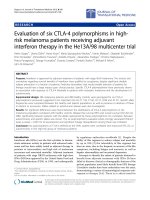
strip. Uniaxial strai n was introduced by a
stress device as shown in Figure 1 which is the same as
the one used by Papadimitriou and Richter [15]. When
the length-to-width ratio is greater than 3, the strip
behaves like a bend rod, and the apparatus produces
only two nonzero strain components:
x’x’
(tensile)
z’z’
and (comp ressive). Here x’ and y’ ar e along the cleavage
axis [110] and [1
10] as shown in Figure 1. T ransformed
to the principal axis [100] and [010], the nonzero strain
components are
xx
,
yy
,
zz
and
xy
[4], and only
xy
will
introduce IPO A. The maximum strain component
xy
at
the center of the strip is given by [16]
ε
xy
=
ε
x
x
2
=
3hJ
0
4a
2
.
Here J
0
is the deformation at the strip center, h is the
thickness and 2a is the l ength of the strip. The relative
reflectance difference between the [110] and [1
10] direc-
tions at the center of the s trip (3 × 4 mm
2
) is measured
by RDS at room temperature.
Results and discussion
Experimental results
Figure 2 shows the real part of the RD and Δ R/R spectra
of the three samples obtained at 80 K. In the ΔR/R spec-
tra, we can observe the transitions of 1e1hh (the first
conduction to the first valence subband of heavy hole),
1e1lh and 2e2hh, and what’s more, the intensity of the
transition 1e1hh is much larger than that of the 1e1lh.
However, in the RD spectra, besides the allowed transi-
tions 1e1hh, 1e1lh, 2e2hh and 1eh*, we can also observe
the forbidden transition 1e2hh. Here h * represents c on-
tinuous hole states. The energy positions of the transi-
tions 1e1hh (1e1lh) are marked by solid (dotted) lines.
And the positions of 1e2hh, 1eh* and 2e2hh are indi-
cated by upward, green downward and b lack down ward
arrows, respectively. The transitions 1e1hh and 1e1lh
show peak-like lineshape (negative or positive), while
the forbidden transitions 1e2hh of the samples with well
width 5 and 7 nm present a smoothed-step-like line-
shape. This phenomenon may be attributed to the
Figure 1 Schematic drawing of the uniaxial strain apparatus.
Yu et al. Nanoscale Research Letters 2011, 6:210
/>Page 2 of 10
coupling of heavy and light holes when the in-plane
wave vector is nonzero [1].Forthesamplewithwell
width 3 nm, it is difficult to clearly distinguish the cor-
responding energy positions of the transitions 1e2hh,
1e1lh and leh*, because they are too close to each other.
Even so, we can still observe that, the intensity of the
IPOA of 1e1lh increases obviously compared to that of
1e1hh. Surprising ly, the forbidde n transition 1 e2hh are
comparable to the allowed transition in RD spectra,
while it almost cannot be observed in ΔR/R spectra.
Figure 3 shows the imaginary part of RD spectra of
the sample with 5 nm well width under diffe rent strain.
Although the signal-to-noise ratio at room temperate is
not as good as that at 80 K, thr ee structures can still be
Figure 2 Real part of RD spectra and ΔR/R spectra of In
0.2
Ga
0.8
As/GaAs single-quantum well with nominal well width 3, 5, and 7 nm,
respectively. The spectra are measured at 80 K. The vertical lines indicate the energy positions of the transitions 1e1hh (solid) and 1e1lh
(dotted). And the vertical arrows indicate the positions of 1e2hh (upward arrows), leh* (downward arrows), and 2e2hh (downward arrows). Here
h* represents continuous hole states.
Yu et al. Nanoscale Research Letters 2011, 6:210
/>Page 3 of 10
clearly observed in the vicinity of 1.30, 1.34 and 1.36 eV,
which can be assigned to the transitions of 1e1hh,
1e2hh and 1e1lh, respectively. Figure 4a shows us the
RD intensity of the transition 1e1hh, 1e2hh and 1e1lh
vs. str ain, after subtracting the RD contribution under
zero strain. It can be seen that, as the strain increases,
the RD intensity of the allowed transition 1e1hh and
1e1lh are enhanced, while that of the forbidden transi-
tion 1e2hh does not show apparent change. Besides, in
contrast to the transition 1e2hh and 1e1lh, the sign of
the a nisotropic transition 1e1hh changes as the strain
increases. In addiction, slight redshifts can be introduced
by the strain for all transitions, as shown in Figure 4b.
The energy shift caused by J
0
= 0.07 (i.e.,
xy
=7e
0
=2.3
×10
-4
) is less than 9 meV.
Models and calculation results
It is well known that, IPOA in (001)-oriented QWs
mainly comes from mixing between heavy and light
holes [2,3,17]. However, it is demonstrated that the
spin-orbit coupling has significant effects on the band
structure especially for highly strained quantum wells
[18]. The strain will couple the heavy-hole (hh) bands,
light-hole (lh) bands with spin-orbit split-off (SO) band
[18]. Therefore, taking into ac count the coupling
between hh, lh and SO band, we u se 6 band K·Pthe-
ory which is described in Ref. [ 18], and treat the hole-
mixing induced by the strain
xy
, electric field and t he
two interface as perturbation [4]. The perturbation
Hamiltonian H’ can be written as [18]
H
=
⎛
⎜
⎜
⎜
⎜
⎜
⎜
⎝
00iR 00iR
000iR Q 0
−iR
†
0000Q
0 −iR
†
00−iR
†
0
0 Q 0 iR 00
−iR
†
0 Q 000
⎞
⎟
⎟
⎟
⎟
⎟
⎟
⎠
(1)
Figure 3 RD spectra of 5 nm-In
0.2
Ga
0.8
As/GaAs QW under different strain
xy
in unit of e
0
= 3.23 × 10
-5
. The spectra are measured at room
temperature and shifted v e rtically for clarity. The obliq ue lines indica te the energy positions of the transitions 1e1hh, 1e2hh, and 1e1lh in the RD spectra.
Yu et al. Nanoscale Research Letters 2011, 6:210
/>Page 4 of 10
with [2,4]
R(z)=
Dd
14
F + Dε
xy
+
P
1
l
1
exp(−
z − w/2
l
1
)Θ(z − w/2)
−
P
2
l
2
exp(−
z + w/2
l
2
)Θ(z + w/2)
,
(2)
and [18]
Q = −
b
2
(ε
xx
+ ε
yy
− 2ε
zz
)
(3)
for the basis |3/2, 3/2 >,|3/2, 1/2 >, |3/2, -1/2 >,|3/2,
-3/2 >, |1/2, 1/2 >,and|1/ 2, -1/2 >.Hereb and D are
the Bir-Pikus deformation potentials, F is the electric
field along the z direction, d
14
is the piezoelectric con-
stant,
ij
denotes the symmetric strain tensor, P
1
(P
2
)is
the lower (upper) interface potential parameter describ-
ing the effect of C
2ν
interface symmetry [2], l
1
(l
2
)isthe
In segregation length in the lower (upper) interface, and
z =±w/2 is the location of the interfaces of QW. The
interface potential parameter P
1
and P
2
are equal for a
Figure 4 Strain dependence of RD intensity and energies of 1e1hh, 1e2hh and 1e1lh. (a) RD intensit y of the t ransitions 1e1hh (square s),
1e2hh (circles) and 1e1lh (triangles) vs. strain after subtracting the RD contribution under zero strain. The solid lines are the linear fitting of the
experimental data. (b) The transition energies vs. strain. The solid lines in (b) are calculated from the envelope function theory (1e
0
= 3.23 × 10
-5
)
Yu et al. Nanoscale Research Letters 2011, 6:210
/>Page 5 of 10
symmetric QW, and anisotropic interface roughness will
make them unequal [4]. According to the model sug-
gested in Ref. [19] , we assume that the segregation
lengths on the two interfaces are equal, i.e., l
1
= l
2
.
In order to estimate the value of built-in electric fi eld,
we perform photoreflectance measurements. However,
no Franz-Keldysh oscillations presents, which can be
attributed to the fact that the layers are all intentionally
undoped and the residual doping is very low. Thus, the
residual electric field is weak enough to be neglected.
Based on the Luttinger 6 × 6 hole Hamiltonian [18]
and the hole-mixing Hamiltonian described in Equation
1, the energies of ne-mlh/hh transition and transition
probability can be calculated. Then using a Lorentzian
function, as described in Equation 4, we can simulate
anisotropic transition spectroscopy ΔM and average
transition spectroscopy M.
M(or ΔM)=
n,m
1
π
0.5Γ
(E − E
nm
)
2
+(0.5Γ )
2
× P
nm
,
(4)
here Γ is the linewidth of the transition, and E
nm
(P
nm
)
is the transition energy (probability) between neand
mlh or between neandmhh. In the calculation, the
adopted Luttinger parameters are: g
1
= 6.85, g
2
=1.9,g
3
=2.93forGaAs,andg
1
= 21.0, g
2
=8.3,g
3
=9.2for
InAs. The band-offset is taken as Qc = 0.64 [20], and
the strain-free In
x
Ga
1-x
As band gap at 80 and 300 K are
taken f rom Refs. [20] and [21], respectively. The other
band parameters are got from Ref. [22]. The anisotropic
transition probability ΔM is proportional to Δr/r. There-
fore, we can compare the theoretical calculated Δ M
with experimental data Δr/r, and thus to find out the
reason responsible for t he observed strong anisotropic
forbidden transitions. It is noteworthy that even under
zero uniaxial strain, there will still be r esidual anisotro-
pic strain exists, which may be due to a preferred distri-
bution of In atoms [23]. In the following, we will discuss
the interface potential, segregation and anisotropic strain
effect separately.
We should first estimate the value of interface poten-
tial parameter, denoted as P
0
. So far, there are four the-
oretical models esti mating the value of P
0
: boundary
conditions (BC) model by I vchenko [17], perturbed
interface potential model (called “H
BF
“) by Krebs [3],
averaged hybrid en ergy (AHE) difference of interfaces
model and lattice mismatch model by Chen [24]. Given
that BC model is equivalent to H
BF
model, we need to
consider only one of them [24]. Thus using H
BF
,AHE
and lattice mismatch model and then adding them up,
we obtain the value of P
0
is about 600 meV Å.
If there is only anisotropic interface structures in the
interface, i.e., l =0,
xy
= 0, we can adopt P
1
= P
0
,and
fit P
2
to the experimental data. The fitting results are
showninFigure5a.TheP
2
value adopted is 775 meV
Å. It can be seen that, only the allow ed transition pre-
sents. Therefore, the observed anisotropic forbidden
transition cannot be attributed to anisotropic interface
structures.
If there is only anisotropic strain effect in the QW
(i.e., P
1
= P
2
= P
0
, l = 0 ), only one free parameter
xy
can be fitted to the experimental data. The fitting result
is shown in Figure 5b. The
xy
value we adopt is 0. 003 ×
xx
= -4.24 × 10
-5
. Again, there is no forbidden transi-
tion presents. Therefore, the observed anisotropic for-
bidden transition cannot be attributed to anisotropic
strain effect.
If there is only atomic segregation effect (i.e., P
1
= P
2
= P
0
,
xy
= 0), one can fit free parameter l to the experi-
mental data. The fitting result is shown in Figure 5c.
The fitted segregation length l is 1.8 nm, which is i n
reasonable agreement with that reported in Ref. [19].
Apparently, the segregation effect will lead to a strong
IPOA for the forbidden transition 1e2hh, but do not
change its average transition probability, which is still
very small. Bes ides, for the sample with well width 3
nm, a strong IPOA is also present for the t ransition
1e1lh. Therefore, the observed anisotropic forbidden
transition is closely related to In atomic segregation
effect.
From Figure 5c, we can see that, if there is only segre-
gation effect, the sign of the transition 1e1hh is negative,
which is not consistent with the experiment. Therefore,
the re must be some other effect existing, such as aniso-
tropic interface structures or anisotropic strain effect.
When we take both the anisotropic s train and segrega-
tion effect into account, the calculated results are not
consistent with the experimental data. However, the
results obtained by both the anisotropic interface struc-
ture and the segregation effect are in reasonable agree-
ment with the experiment, as shown in Figure 5d. In
the calculation, we adopt interface parameter P
1
= 595
meV Å, P
2
= 775 meV Å, and the segregation length l =
1.8 nm. The obtained interface potential difference ΔP/
P
0
is about 30%, which is much larger than that
obtained in GaAs/Al
x
Ga
1-x
As QW (about 6%) [4 ]. The
reason may be that lattice mismatch will enhance the
interface asymmetry of the QWs.
Using the parameters obtained above, we can well sti-
mulate the IPOA of all the transitions under different
uniaxial strain, as shown in Figure 6. The cal culated
transition ene rgies are also well consistent with e xperi-
ments, which is shown in Figure 4b.
Interpretation of IPOA by perturbation theory
The IPOA-intensity ratio of 1e1lh and 1e1hh transitions is
much stronger for the sample with 3 nm well width com-
pared to that of the other samples. This phenomenon may
Yu et al. Nanoscale Research Letters 2011, 6:210
/>Page 6 of 10
Figure 5 Calculated anisotropic transition probability ΔM and average transition probability M of In
x
Ga
1-x
As/GaAs QW with well width
3, 5 and 7 nm, respectively. The optical anisotropy is induced by (a) anisotropic interface structures, (b) anisotropic strain effect, (c) In
segregation effect and (d) both anisotropic interface structures and In segregation effect. The vertical lines indicate the energy positions of the
transitions 1e1hh (solid) and 1e1lh (dotted). And the vertical arrows indicate the positions of transitions 1e2hh (upward arrows), leh* (downward
arrows), and 2e2hh (downward arrows).
Yu et al. Nanoscale Research Letters 2011, 6:210
/>Page 7 of 10
be undefirstood in the following way. According to pertur-
bation theory, the anisotropic transition probability ΔM of
1e1lh can be expressed as [1,2]
1E|1H1H|R(z)|1L1L|1E
E
1L
− E
1H
+
1E|2H2H|R(z)|1L1L|1E
E
1L
− E
2H
.
(5)
Here 〈1E|nH〉 is the overlap integral between the first
electron and the nth heavy-hole states. 〈1H|R(z)|1L〉 is
the hole-mixing strength between 1H and 1L. E
1L
- E
nH
is the energy separation between 1L and nH. I t can bee
seen that, ΔM is directly proportional to the coupling
strength of holes and inversely proportional to their
energy separation. For the three samples, there is little
difference in the term R(z). However, E
1L
-E
2H
of the
sample with 3 nm well width is s maller than that of the
other samples, which results in much stronger IPOA.
The appearance of the forbidden transition and its
behavior under uniaxial s train can be interpreted in a
similar way. According to perturbation theory, the
anisotropic transition probability ΔM of 1e2hh can be
expressed as [1,2]
1E|1L1L|R(z)|2H2H|1E
E
2H
− E
1L
+
1E|2H2H|R(z)|SOSO|1E
E
2H
− E
SO
.
(6)
Here 〈1E|nH〉 and 〈nH|1E〉 (〈SO|1E〉) a re the overlap
integrals bet ween the discussed e lectron and hole (SO)
states. 〈1L|R(z)|2H〉 is the hole-mixing strength between
1L and 2H,and〈2H|R (z )|SO 〉 is the coupling strength
between 2H and SO band. E
2H
- E
SO
is the ener gy
separation between 2H and SO. Since E
2H
- E
SO
≫ E
2H
-E
1L
, the coupling between 1L and 2H dominates.
When there is no segregation effect, 〈2H|1E〉 = 0 and no
optical anisotropy exists. However, when segregation
emerges, the symmetric square well changes into an
asymmetric well, which will change the parities of the
subband wave functions. Besides, it will also couples the
1L and the 2H subbands, and as a result, the perturbed
2H subband wave function now contains a small portion
Figure 6 Calculated anisotropic transition probability ΔM of In
x
Ga
1-x
As/GaAs QW under different strain
xy
in unit of e
0
=3.23×10
-5
.
The oblique lines indicate the energy positions of the transitions 1e1hh, 1e2hh, and 1e1lh in the ΔM spectra.
Yu et al. Nanoscale Research Letters 2011, 6:210
/>Page 8 of 10
of the unperturbed |1L〉 one. Thus, 〈2H|1E〉 ≠ 0, and its
value is proportional to the segregation effect. The strain
component
xy
, being an even function of space, only
couples the sub-ban ds with same parity, such as 1H and
1L. Then, the contribution of
xy
to the numerator of
the first term in Equation 6 can be written as
1E|1LDε
xy
1L|2H2H|1E,
(7)
in which the first integral is nearly a constant, and
〈 1L|2H〉〈2H|1E〉 is mainly determined by the segrega-
tion effect and interface potential. Therefore, for the for-
bidden transition 1e2hh, the change of IPOA induced by
a wea k uniaxial strain (in the order of 10
-5
)willbetoo
weak to be observed in experiment. However, for the
allowed transitions, such as 1e1hh, the strain will also
couple 1H and 1L, and will remarkably change the
IPOA. From Figure 3 we can see that the RD intensity
of transition 1e1lh does n ot show significant change as
the strain increases. The reason may be that the light-
hole band configuration is weak type I for the current
alloy composition [20], which result in the change of the
potential has little influence on its wave function.
Conclusion
We have observed strong anisotropic forbidden transi-
tion in a series of In
0
.
2
Ga
0
.
8
As/GaAs SQW with well
width ranging between 3 nm and 7 nm at 80 K. Using a
6 band K · P theory, we have calculated the optical ani-
sotropy induced by interface composition profile due to
In segregation, anisotropic interface structures and ani-
sotropic strain. It is found that the observed anisotropic
forbidden transition can be mainly attributed to the In
segregation effect. Besides, the effect of uniaxial strain
on IPOA is also investigated. It is found that the IPOA
of the forbidden transition changes little with strain,
while that of the allowed t ransition shows a linear
dependence on strain. Finally, an interpretation of IPOA
by perturbation theory is also given out.
Abbreviations
AHE: averaged hybrid energy; BC: boundary conditions; In: indium; IPOA: in-
plane optical anisotropy; SQW: single-quantum well; SRE: symmetry
reduction effect; PR: photoreflectance; QW: quantum well; RDS: reflectance-
difference spectroscopy.
Acknowledgements
This study was supported by the 973 program (2006CB604908,
2006CB921607), and the National Natural Science Foundation of China
(60625402, 60990313).
Authors’ contributions
JLY performed the statistical analysis, carried out the calculations and drafted
the manuscript. YHC conceived of the study, and participated in its design
and coordination. CGT carried out the experiments. CYJ participated in the
revision of the manuscript and discussed analysis. XLY participated in the
design of the study. All authors read and approved the final manuscript.
Competing interests
The authors declare that they have no competing interests.
Received: 27 July 2010 Accepted: 10 March 2011
Published: 10 March 2011
References
1. Chen YH, Yang Z, Wang ZG, Bo X, Liang JB: Quantum-well anisotropic
forbidden transitions induced by a common-atom interface potential.
Phys Rev B 1999, 60:1783.
2. Chen YH, Ye XL, Wang JZ, Wang ZG, Yang Z: Interface-related in-plane
optical anisotropy in GaAs/Al
x
Ga
1-x
As single-quantum-well structures
studied by reflectance difference spectroscopy. Phys Rev B 2002,
66:195321.
3. Krebs O, Voisin P: Giant optical anisotropy of semiconductor
heterostructures with no common atom and the quantum-confined
pockels effect. Phys Rev Lett 1996, 77:1829.
4. Tang CG, Chen YH, Xu B, Ye XL, Wang ZG: Well-width dependence of in-
plane optical anisotropy in (001) GaAs/AlGaAs quantum wells induced
by in-plane uniaxial strain and interface asymmetry. J Appl Phys 2009,
105:103108.
5. Voon L: In-plane birefringence of asymmetric (001) quantum wells. Appl
Phys Lett 1997, 70:2446.
6. Ye XL, Chen YH, Xu B, Wang ZG: Detection of indium segregation effects
in In-GaAs/GaAs quantum wells using reflectance-difference
spectrometry. Mater Sci Eng B 2002, 91:62.
7. Kwok SH, Grahn HT, Ploog K, Merlin R: Giant electropleochroism in GaAs-
(Al, Ga)As as heterostructures - the quantum-well pockels effect. Phys
Rev Lett 1992, 69:973.
8. Rau G, Glanfield AR, Klipstein PC, Johnson NF, Smith GW: Optical
properties of GaAs/Al
1-x
Ga
x
As quantum wells subjected to large in-plane
uniaxial stress. Phys Rev B 1999, 60 :1900.
9. Zhu B-F, Chang Y-C: Inversion asymmetry, hole mixing, and enhanced
Pockels effect in quantum wells and superlattices. Phys Rev B 1994,
50:11932.
10. Shen H, Wraback M, Pamulapati J, Newman PG, Dutta M, Lu Y, Kuo HC:
Optical anisotropy in GaAs/Al
x
Ga
1-x
As multiple-quantum wells under
thermally-induced uni-axial strain. Phys Rev B 1993, 47:13933.
11. Tang CG, Chen YH, Ye XL, Wang ZG, Zhang WF: Strain-induced in-plane
optical anisotropy in (001) GaAs/AlGaAs superlattice studied by
reflectance difference spectroscopy. J Appl Phys 2006, 100:113122.
12. Wang DP, Chen CT, Kuan H, Shei SC, Su YK: Study on symmetry forbidden
transitions in an In
x
Ga
1-x
As/GaAs single-quantum-well by temperature-
dependence. J Appl Phys 1995, 77:6500.
13. Chen YH, Ye XL, Xu B, Wang ZG: Strong in-plane optical anisotropy of
asymmetric (001) quantum wells. J Appl Phys 2006, 99:096102.
14. Aspnes DE, Harbison JP, Studna AA, Florez LT: Application of reflectance
difference spectroscopy to molecular-beam epitaxy growth of GaAs and
AlAs. J Vac Sci Technol A 1988, 6:1327.
15. Papadimitriou D, Richter W: Highly sensitive strain detection in silicon by
reflectance anisotropy spectroscopy. Phys Rev B 2005, 72:07512.
16. Liarokapis E, Papadimitriou D, Rumberg J, Richter W: Raman and RAS
measurements on uniaxially strained thin semiconductor layers. Phys
Status Solidi B 1999, 211:309.
17. Ivchenko EL, Kaminski AY, Rossler U: Heavy-light hole mixing at zinc-
blende (001) interfaces under normal incidence. Phys Rev B 1996, 54:5852.
18. Chao CY-P, Chuang SL: Spin-orbit-coupling effects on the valence-band
structure of strained semiconductor quantum wells. Phys Rev B 1992,
46:4110.
19. Muraki K, Fukatsu S, Shiraki Y, Ito R: Surface segregation of In atoms
during molecular-beam epitaxy and its influence on the energy-levels in
InGaAs/GaAs quantum-wells. Appl Phys Lett 1992, 61:557.
20. Leymarie J, Monier C, Vasson A, Vasson AM, Leroux M, Courboules B,
Grandjean N, Deparis C, Massies J: Optical investigations in (In, Ga)As/
GaAs quantum-wells grown by metalorganic molecular-beam epitaxy.
Phys Rev B 1995, 51:13274.
21. Arent DJ, Deneffe K, Vanhoof C, Deboeck J, Borghs G: Strain effects and
band offsets in GaAs/InGaAs strained layered quantum structures. J Appl
Phys 1989, 66:1739.
22. Vurgaftman I, Meyer JR, Ram-Mohan LR: Band parameters for III-V
compound semiconductors and their alloys. J Appl Phys 2001, 89:5815.
Yu et al. Nanoscale Research Letters 2011, 6:210
/>Page 9 of 10
23. Yu JL, Chen YH, Ye XL, Jiang CY, Jia CH: In-plane optical anisotropy in
GaAsN/GaAs single-quantum well investigated by reflectance-difference
spectroscopy. J Appl Phys 2010, 108:013516.
24. Chen YH, Wang ZG, Yang ZY: A new interface anisotropic potential of
zinc-blende semiconductor interface induced by lattice mismatch. Chin
Phys Lett 1999, 16:56.
doi:10.1186/1556-276X-6-210
Cite this article as: Yu et al.: Observation of strong anisotropic
forbidden transitions in (001) InGaAs/GaAs single-quantum well by
reflectance-difference spectroscopy and its behavior under uniaxial
strain. Nanoscale Research Letters 2011 6:210.
Submit your manuscript to a
journal and benefi t from:
7 Convenient online submission
7 Rigorous peer review
7 Immediate publication on acceptance
7 Open access: articles freely available online
7 High visibility within the fi eld
7 Retaining the copyright to your article
Submit your next manuscript at 7 springeropen.com
Yu et al. Nanoscale Research Letters 2011, 6:210
/>Page 10 of 10