Báo cáo hóa học: " Research Article Evaluating IEEE 802.15.4 for Cyber-Physical Systems" potx
Bạn đang xem bản rút gọn của tài liệu. Xem và tải ngay bản đầy đủ của tài liệu tại đây (1.22 MB, 14 trang )
Hindawi Publishing Corporation
EURASIP Journal on Wireless Communications and Networking
Volume 2011, Article ID 596397, 14 pages
doi:10.1155/2011/596397
Research Article
Evaluating IEEE 802.15.4 for Cyber-Physical Systems
Feng Xia,
1
Alexey Vinel,
2, 3
Ruixia Gao,
1
Linqiang Wang,
1
and Tie Qiu
1
1
School of Software, Dalian University of Technology, Dalian 116620, China
2
Department of Communication Engineering, Tampere University of Technology, Tampere 33720, Finland
3
Telecommunication Technologies and Computer Networks Group, SPIIRAS, St. Petersburg 199178, Russia
Correspondence should be addressed to Feng Xia,
Received 1 December 2010; Accepted 11 February 2011
Academic Editor: Boris Bellalta
Copyright © 2011 Feng Xia et al. This is an open access article distributed under the Creative Commons Attribution License, which
permits unrestricted use, distribution, and reproduction in any medium, provided the original work is properly cited.
With rapid advancements in sensing, networking, and computing technologies, recent years have witnessed the emergence of
cyber-physical systems (CPS) in a broad range of application domains. CPS is a new class of engineered systems that features
the integration of computation, communications, and control. In contrast to general-purpose computing systems, many cyber-
physical applications are safety critical. These applications impose considerable requirements on quality of service (QoS) of the
employed networking infrastruture. Since IEEE 802.15.4 has been widely considered as a suitable protocol for CPS over wireless
sensor and actuator networks, it is of vital importance to evaluate its performance extensively. Serving for this purpose, this paper
will analyze the performance of IEEE 802.15.4 standard operating in different modes respectively. Extensive simulations have been
conducted to examine how network QoS will be impacted by some critical parameters. The results are presented and analyzed,
which provide some useful insights for network parameter configuration and optimization for CPS design.
1. Introduction
There is a revolutionary transformation from stand-alone
embedded systems to networked cyber-physical systems
(CPS) that bridge the virtual world of computing and
communications and the real world [1–3]. Cyber-physical
systems are tight integrations of computation, networking,
and physical objects, in which embedded devices are net-
worked to sense, monitor, and control the physical world.
CPS is r apidly penetrating every aspect of our lives and plays
an increasingly important role. This new class of engineered
systems promises to transform the way we interact with
the physical world just as the internet tr a nsformed how
we interact with one another. Before this vision becomes
a reality, however, a large number of challenges have to
be addressed, including, for example, resource constraints,
platform heterogeneity, dynamic network topology, and
mixed traffic[4]. High-confidence wireless communication
protocol design in the context of CPS is among those issues
that deserve extensive research efforts.
The IEEE 802.15.4 protocol [5] is a low-rate, low-
cost, and low-power communication protocol for wireless
interconnection of fixed and/or portable devices. Currently
it has become one of the most popular communication
standards used in the field of wireless sensor networks
(WSNs). On the other hand, cyber-physical systems are
generally built upon wireless sensor and actuator networks
(WSANs), which is an extension of WSNs. In this context,
WSANs are generally responsible for information exchange
(i.e., data transfer), serving as a bridge between the cyber
and the physical worlds. As a consequence, the IEEE 802.15.4
protocol will be utilized in many cyber-physical systems
and applications of today and tomorrow. Despite the wide
popularity of IEEE 802.15.4 networks, their applicability to
CPS needs to be validated. This is because IEEE 802.15.4 was
not designed for networks that can provide quality of service
(QoS) guarantees, while the performance of cyber-physical
applications often depend highly on the QoS of underlying
networks. Therefore, it becomes necessary and important to
evaluate the performance of IEEE 802.15.4 protocol in the
context of CPS, which forms the focus of this paper.
IEEE 802.15.4 supports two basic kinds of networking
topologies relevant to CPS applications: star and peer-to-
peer. Since most CPS applications involve monitoring tasks
and reporting towards a central sink, here we focus on a one-
hop star network. All the nodes are set to be in each other’s
2 EURASIP Journal on Wireless Communications and Networking
radio range. Consequently, there are no hidden nodes. IEEE
802.15.4 medium access control (MAC) adopts carrier sense
multiple access with collision avoidance (CSMA/CA) as the
channel access mechanism. In an IEEE 802.15.4-based one-
hop star network, the network QoS in terms of, for example,
packet loss rate and latency depends on the number of nodes
competing for channel access and their packet generation
rates as well as the configuration of MAC parameters in
the nodes. The IEEE 802.15.4 specification suggests default
values for different MAC parameters. However, as demon-
strated later in this paper, the default configuration may not
necessarily yield the best QoS in all situations with different
trafficload.Infact,itisverydifficult, if not impossible, to
determine a single IEEE 802.15.4 MAC configuration that
always results in the optimal performance, which will be
supported by our results.
Inthispaper,wewillevaluatetheperformanceofIEEE
802.15.4 protocol in both beacon-enabled and nonbeacon-
enabled modes, respectively. We consider a star network
of several nodes collecting data and transmitting them to
a central sink node. The network QoS is characterized by
several metrics, including effective data rate, packet loss
rate, and average end-to-end delay. These met rics will be
examined with respect to different MAC parameter settings.
We contribute to better understanding of the IEEE 802.15.4
standard in the context of CPS by presenting a set of results
of simulation experiments using OMNe T++, which is a
popular open-source simulation platform especially suitable
for simulation of communication networks.
The remainder of this paper is organized as follows.
Section 2 gives an overview of related work in the literature.
In Section 3 we discuss the major features of CPS and their
requirements on QoS from a networking perspective. In
Section 4, we introduce briefly the IEEE 802.15.4 standard.
This is followed by a description of simulation settings
including simulation scenario and parameter settings, and
a definition of performance metr ics in Section 5. Sections
6 and 7 present and analyze the simulation results. Finally,
Section 8 concludes the paper.
2. Related Work
CPS has been attracting rapidly growing attention from
academia, industry, and the government worldwide. A
number of conferences, workshops, and summits on CPS
have been held during the past several years, gathering
researchers, practitioners, and governors from all around the
world to discuss the challenges and opportunities brought
by CPS. The renowned CPS Week was launched in 2008
and is held annually. Many world-leading IT companies such
as Microsoft, IBM, National Instruments, NEC Labs, and
Honeywell have started research and development initiatives
closely related to CPS. Although there have been a lot of
research results in related fields including embedded com-
puting systems, ubiquitous computing, and wireless sensor
networks, CPS is a relatively new area with a large number of
open problems [1]. In particular, we pay special attention to
performance evaluation of one of the most popular wireless
communication protocols (i.e., IEEE 802.15.4) in the context
of CPS.
Since the release of IEEE 802.15.4 in 2003 and the
emergence of the first products on the market, there have
been many analytical and simulation studies in the literature,
trying to characterize the performance of the IEEE 802.15.4
standard [6, 7]. However, most of these studies mainly focus
on IEEE 802.15.4 in either the beacon-enabled mode or
the nonbeacon-enabled mode. For example, Lu et al. [8]
conducted performance evaluation of IEEE 802.15.4 using
the NS-2 network simulator, focusing on its beacon-enabled
mode for a star-topology network. Pollin et al. [9]provided
an analytical Markov model that predicts the performance
and detailed behavior of the IEEE 802.15.4 slotted CSMA/CA
mechanism. Jung et al. [10] enhanced Markov chain models
of slotted CSMA/CA IEEE 802.15.4 MAC to account for
unsaturated traffic conditions. Huang et al. [11]andRenet
al. [12] focused on analyzing beacon-enabled IEEE 802.15.4
network by setting two system parameters, that is, Beacon
Order and Superframe Order. In [13] Buratti established
a flexible mathematical model for beacon-enabled IEEE
802.15.4 MAC protocol in order to study beacon-enabled
802.15.4 networks organized in different topologies.
On the other hand, many works on IEEE 802.15.4 are
based on nonbeacon-enabled mode [14 , 15]. In [16], for
example, Latr
´
e et al. studied the perfor mance of the non-
beaconed IEEE 802.15.4 standard in a scenario containing
one sender and one receiver. In [17], Rohm et al. analyzed
via simulations the impact of different configurable MAC
parameters on the performance of beaconless IEEE 802.15.4
networks under different trafficloads.In[18], Rohm et
al. measured the performance of beaconless IEEE 802.15.4
networks with various system parameters under different
traffic load conditions. Buratti and Verdone [19]providedan
analytical model for nonbeacon-enabled IEEE 802.15.4 MAC
protocol in WSN, which allows evaluation of the statistical
distribution of traffic generated by nodes.
In addition, many researchers have studied IEEE 802.15.4
for special application environments [20, 21]. In [22],
Chen et al. analyzed the performance of beacon-enabled
IEEE 802.15.4 for industrial applications in a star network
in OMNeT++. The effects of varying the payload size,
sampling, and transmitting cycles in an IEEE 802.15.4-based
star network that consists of ECG monitoring sensors are
analyzed in [23]. Li et al. [24] studied the applicability
of IEEE 802.15.4 over a wireless body area network by
evaluating its performance. In [25], Liu et al. paid attention
to study the feasibility of adapting IEEE 802.15.4 protocol
for aerospace wireless sensor networks. By analyzing the
IEEE 802.15.4 standard in a simulation environment, Chen
et al. [26
] modified IEEE 802.15.4 protocol for real-time
applications in industrial automation. Mehta et al. [27]
proposed an analytical model to understand and characterize
the performance of GTS traffic in IEEE 802.15.4 networks
for emergency response. In [28], Zen et al. analyzed the
performance of IEEE 802.15.4 to evaluate the suitability of
the protocol in mobile sensor networking.
In this paper, we extend our previous work [29]. There
are two key contributions. First, we comprehensively study
EURASIP Journal on Wireless Communications and Networking 3
the performance of IEEE 802.15.4 protocol in both beacon-
enabled and nonbeacon-enabled modes based on a one-hop
star network, using the OMNeT++ simulator. We select end-
to-end delay, effective data rate, and packet loss rate as the
network QoS metrics and analyze how they will be affected
by several important protocol parameters. Second, we make
an in-depth analysis of the results to provide insights for
adapting IEEE 802.15.4 for CPS. By analyzing the results, we
can configure and optimize the parameters of IEEE 802.15.4
for CPS.
3. QoS Requirements of CPS
As mentioned previously, CPS is a new class of systems
that tightly integrate computation, networking, and physical
objects. They feature by nature the convergence of comput-
ing, communications, and control (i.e., 3C). In a feedback
manner, the cyber world and the physical world exchange
information and effect on each other, thus forming a closed-
loop system. The basic goal of CPS is to sense, monitor,
and control physical environments/objects effectively and
efficiently.
A typical CPS mainly consists of the following compo-
nents: physical objects, sensors, actuators, communication
networks, and computing devices (e.g., controllers). Various
sensors and actuators will be geographically distributed and
directly coupled with physical objects. Sensors collect the
state information of physical objects and send it to certain
computing nodes through the communication networks.
The network could possibly be a combination of multiple
networks of different types, for example, wired and wireless
networks. It is responsible for transferring data reliably
and in real-time. Relatively complex decision-making algo-
rithms will be generally executed on computing devices,
which generate control commands based on information
collected by sensors. In practice, these computations could
be completed in a distributed or centralized manner. The
control commands will then be sent to actuators, also
via the networks if needed, and be performed by the
appropriate actuators. In this way, CPS facilitates interplay
of the cyber and physical systems, that is, control of physical
environments.
As we can see, cyber-physical systems in general are built
on WSANs, though the networks within a real-world CPS
could potentially be much more complex and heterogeneous.
Particularly, when the scale of a CPS becomes very large,
WSAN is a natural choice for interconnection of a large
number of sensor, computing, and actuator nodes due to
the celebrated benefits of wireless networking (as compared
to wired counterparts). The use of WSAN distinguishes
CPS from traditional embedded systems and wireless sensor
networks. From a networking viewpoint, some widely-
recognized characteristics of CPS can be outlined as follows.
(1) Network Complexity. Due to various reasons, such
as different node distances, diverse node platforms
and operating conditions, multiple communication
networks of different types could be employed in
one single CPS. Different communication protocols/
standards may coexist. The network of a typical CPS
is often large in scale because of the large number of
distributed nodes in the systems.
(2) Resource Constraints.InCPS,cybercapabilitiesare
embedded into physical objects/nodes. These embed-
ded devices are always limited in computing speed,
energy, memory, and network bandwidth, and s o
forth. For example, for an IEEE 802.15.4 network, the
bandwidth is limited to 250 kbps.
(3) Hybrid Traffic and Massive Data. In a large-scale CPS,
diverse applications may need to share the same
network, causing mixed traffic. The large number
of sensor and computing nodes generate a huge
volume of data of various types. In particular, in
order to sense the state of physical world correctly
and accurately, a CPS usually needs to collect a mass
of data by using diverse sensors. This data must be
processed and transmitted properly.
(4) Uncertainty. In CPS there are many factors that
could potentially cause uncertainty with various
attributes, including, for example, sensor measure-
ment error, computational model error, software
defect, environmental noise, unreliability of wireless
communications, and changes in network topology
(due to, e.g., node failure or mobility).
CPS can be applied in a wide range of domains.
Potential applications of CPS include assisted living, inte-
grated medical systems, safe and efficient transportation,
automated traffic control, advanced automotive systems,
autonomous search and rescue, energy conservation, energy
efficient buildings, environmental control, factory automa-
tion, home automation, critical infrastructure control, dis-
tributed autonomous robotics, defense, and so forth. Ubiq-
uitous applications and services that could significantly
improve the quality of our daily lives will be enabled by
CPS, wh ich will make applications more effective and more
efficient. However, the success of these applications heavily
relies on the QoS provided by the employed networks.
Therefore, WSANs for CPS have to deliver massive data
within hybrid traffic in a proper manner with the presence of
network complexity, resource constraints, and uncertainty.
Particularly, in most CPS applications, the network QoS
needs to satisfy the requirements on several nonfunctional
properties, that is, real-time, reliability, and resource effi-
ciency [4, 30, 31]. Based on this observation, in this paper
we focus our attention on examining the capability of IEEE
802.15.4 in guaranteeing QoS in terms of these properties.
4. IEEE 802.15.4 Standard
In this section we give a brief introduction to the IEEE
802.15.4 protocol specification for the sake of integralit y.
More details of the standard can be found in [5]. The
specification defines the physical (PHY) and MAC layer.
The PHY layer is defined for operation in three different
unlicensed ISM frequency bands (i.e., the 2.4 GHz band,
the 915 MHz band, and the 868 MHz band) that include
totally 27 communication channels. An overview of their
modulation parameters is shown in Ta ble 1.
4 EURASIP Journal on Wireless Communications and Networking
Table 1: IEEE 802.15.4 frequency bands.
Frequency (MHz) Frequency band (MHz) Data rate (kbps) Modulation scheme Operating regi on
868 868–868.6 20 BPSK Europe
915 902–928 40 BPSK North America
2400 2400–2483.5 250 O-QPSK Worldwide
There are two different kinds of devices defined in IEEE
802.15.4: full function device (FFD) and reduced function
device (RFD). An FFD can act as an ordinary device or a PAN
coordinator. But RFD can only serve as a device supporting
simple operations. An FFD can communicate with both
RFDs and other FFDs while an RFD can only communicate
with FFDs.
IEEE 802.15.4 supports a star topology or a peer-to-
peer topology. In star networks, all the communications
are between end devices and the sink node which is also
called PAN coordinator. The PAN coordinator manages
the whole network, including distributing addresses to the
devices and managing new devices that join in. In the
peer-to-peer network, the devices can communicate with
any other devices which are within their signal radiation
ranges. A specific type of peer-to-peer networks is cluster tree
networks. In this case, most of the devices are FFD. RFD can
only communicate with one FFD sometime.
4.1. Superframe Structure. The IEEE 802.15.4 standard allows
two kinds of network configuration modes.
(1) Beacon-Enabled Mode: a PAN coordinator period-
ically generates beacon frames after every Beacon
Interval (BI) in order to identify its PAN to syn-
chronize with associated nodes and to describe the
superframe structure.
(2) Nonbeacon-Enabled Mode: all nodes can send their
data by using an unslotted CSMA/CA mechanism,
which does not provide any time guarantees to deliver
data frames.
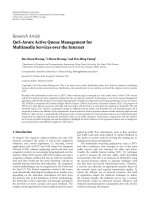
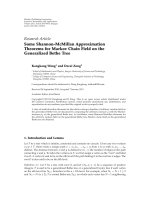
Superframe structure is only used in the beacon-enabled
mode. The PAN coordinator uses it to synchronize associated
nodes. A superframe is always bounded by two consecutive
beacons and may consist of an active period and an optional
inactive period, as shown in Figure 1. All communications
must take place during the active part. In the inactive part,
devices can be powered down/off to conserve energy.
The active part of the superframe is divided into 16
equally-sized slots and consists of 3 parts: a beacon, a
contention access period (CAP), and an optional contention-
free period (CFP). The beacon will b e transmitted at the
start of slot 0 without the use of CSMA/CA, and the CAP
will commence immediately after the beacon and complete
before the beginning of CFP on a superframe slot boundary.
In the CAP, slotted CSMA/CA is used as channel access
mechanism. The CFP, if present, follows immediately after
the CAP and extends to the end of the active portion of
the superframe. In the CFP, CSMA/CA mechanism is not
Inactive
CFPCAP
0
8
1 2 3 4 5 6 7 9 10 11 13 1412 15
Beacon interval
Superframe duration
GTS
(Active)
Beacon BeaconGTS
Figure 1: Superframe structure.
used. Time slots are assigned by the coordinator for special
applications such as low-latency applications or applications
requiring specific data bandwidth. Devices which have been
assigned specific time slots can transmit packets in this
period. The specific time slots are called guaranteed time
slots (GTSs). GTS can be activated by the request sent
from a node to the PAN coordinator. Upon the reception
of this request, the PAN coordinator checks whether there
are sufficient resources available for the requested node to
allocate requested time slot. A maximum of 7 GTSs can
be allocated in one superframe. A GTS may occupy more
than one slot period. Each device transmitting in a GTS will
ensure that its transac tion is complete before the time of the
next GTS or the end of the CFP. The allocation of the GTS
cannot reduce the length of the CAP to less than 440 symbols
(aMinCAPLength).
The superframe structure is described by two parameters:
beacon order (BO) and superframe order (SO). Both
parameters can be positive integers between 0 and 14. The
values of BO and SO are used to calculate the length of the
superframe (i.e., beacon interval, BI) and its active period
(i.e., superframe duration, SD), respectively, as defined in the
following:
BI
= aBaseSuperframeDuration × 2
BO
,
SD
= aBaseSuperframeDuration × 2
SO
,
Duty Cycle
=
SD
BI
= 2
SO−BO
,
(1)
where aBaseSuperframeDuration, a constant, describes the
number of symbols forming a superframe when SO is equal
to 0. The BO and SO must satisfy the relationship 0
≤ SO ≤
BO = 14. According to the IEEE 802.15.4 standard, the
EURASIP Journal on Wireless Communications and Networking 5
Transmitter 1
Transmitter 2
Transmitter 3
Transmitter 4
Transmitter 5
Transmitter 6
Transmitter 7
Transmitter 8
Receiver
50 m
Figure 2: Simulated network topology.
superframe will not be active anymore if SO = 15. Moreover,
if BO
= 15, the superframe will not exist and the nonbeacon-
enabled mode will be used. We use Duty Cycle to show the
relationship between BI and SD.
4.2. CSMA/CA Mechanism. In IEEE 802.15.4 standard, the
channel access mechanism is often div ided into slotted
CSMA/CA for the beaconed-enabled mode and unslotted
CSMA/CA for the nonbeaconed-enabled mode, depending
on network configurations. In both cases, the CSMA/CA
algorithm is implemented based on backoff periods, where
one backoff period will be equal to a constant, that is,
aUnitBackoffPeriod (20 symbols). If slotted CSMA/CA is
used, transmissions will be synchronized with the beacon,
and hence the backoff starts at the beginning of the next
backoff period. The first backoff period of each superframe
starts with the transmission of the beacon, and the backoff
will resume at the start of the next superframe if it has not
been completed at the end of the CAP. In contrast, in the
case of unslotted CSMA/CA, the backoff starts immediately.
In the CSMA/CA algorithm each device, in the network has
three variables: NB, CW, and BE.
(i) NB stands for the number of backoffs. It is initialized
to 0 before every new transmission. Its maximum
value is 4.
(ii) CW means contention window and just exists in
slotted CSMA/CA. It defines the number of backoff
periods that need to be clear of channel activity
before the transmission can start. It is initialized to 2
before each transmission attempt and reset to 2 each
time the channel is accessed to be busy.
(iii) BE is the backoff exponent. The backoff time is
chosen randomly from [0, 2
BE
− 1] units of time. The
default minimum value (MinBE) is 3. The maximum
value (MaxBE) is just 5, which prevents backoff delay
time from becoming too long to affect the overall
performance.
Each time a device needs to transmit data frames or
MAC commands, it shall compute a backoff delay based on a
random number of backoff period and performs CCA (clear
channel assessment) before accessing to the channel. If the
channel is busy, both NB and BE are incremented by 1, and
CW is reset to 2. The device needs to wait for another random
period and repeat the whole process. If the channel is sensed
to be idle, CW is decreased by 1. And then if CW is equal to
0, the device can start to transmit its data on the boundary of
next backoff period. Otherwise the device needs to wait for
another random period and repeat from CCA.
5. Simulation Settings
In this section we describe the configuration and settings of
our simulation model in OMNeT++, including simulation
scenario and parameter settings, and definition of perfor-
mance met rics.
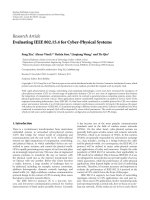
As mentioned previously, compared to peer-to-peer net-
works, star networks could be preferable for CPS applications
and yield smaller delays because the communication in star
networks occurs only between devices and a single central
controller while any device in the peer-to-peer networks can
arbitrarily communicate with each other as long as they are
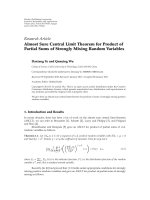
withinacommoncommunicationrange.Inthispaperwe
focus on a one-hop star network, as shown in Figure 2.It
consists of a number of transmitters and a central receiver.
The transmitters are uniformly distributed around a 50-
meter radius circle while the receiver is placed at the centre
of the circle. The transmission range of every node is 176 m.
Therefore we can easily learn that all the nodes are set to be in
each other’s radio ra nge. Hence, there are no hidden nodes.
The transmitters can be taken as devices such as sensors
communicating to the central coordinator. The number of
transmitters will change with scenarios in nonbeacon mode.
All transmitters periodically generate a packet addressed to
the receiver. In the PHY layer, we use the 2.4 GHz range with
a bandwidth of 250 kbps.
We select some important parameters, which may have
significant influence on the p erformance of IEEE 802.15.4,
as variable parameters, including MSDU (MAC service data
unit) size, packet generation interval, MaxNB, MinBE, and
MaxFrameRetries in nonbeacon mode, and MaxNB, BO, and
SO in beacon-enabled mode. They will be introduced with
scenarios in the next two sections. Some important fixed
parameters and default values of variable parameters are
listed in Table 2.
As mentioned in Section 3, the performance of network
protocols for CPS needs to be real-time, reliable, and
resource efficient. In order to meet these requirements, we
select end-to-end delay, effective data rate, and packet loss
rate as QoS metrics.
(i) End-to-End Delay: it is a crucial metric to evaluate
the real-time performance of networks. It refers
to the average time difference between the points
when a packet is generated at the network device
(transmitter) and when the packet is received by the
network coordinator (receiver).
6 EURASIP Journal on Wireless Communications and Networking
Table 2: Parameter settings.
Parameter Value
Carrier frequency 2.4 GHz
Transmitter power 1 mW
Carrier sense sensitivity
−85 dBm
Transmission range 176 m
Bit rate 250 Kbps
Traffictype exponential
N umber of packets sent by every
device (in nonbeacon enabled
mode)
5000
Run time (in beacon-enabled
mode)
1000 s
MaxBE 5
MinBE 3 (default)
MaxNB 4 (default)
MaxFrameRetries 3 (default)
MAC payload size (MSDU size)
60 Bytes
(default)
Packet generation interval (in
nonbeacon enabled mode)
0.025 s (default)
Packet generation interval (in
beacon-enabled mode)
0.05 s
Superfame order (SO)(in
beacon-enabled mode)
6 (default)
Beacon order (BO) (in
beacon-enabled mode)
7 (default)
Number of devices (in
beacon-enabled mode)
8
(ii) Effective Data Rate: it is an important metric to
evaluate the link bandwidth utilization which reflects
the resource efficiency as well as dependability of
networks. It is defined as below:
R
effData
=
N
susspacket
× L
MSDU
T
end
− T
start
,(2)
where N
susspacket
is the total number of usable data
packets which are received successfully by coordina-
tor from all devices in the simulation time. L
MSDU
is
the MSDU length of the data frame. T
end
− T
start
is the
total time of the transmission from the beginning to
the end.
(iii) Packet Loss Rate: it indicates the performance of
reliability, thus being an important metric. It is
the ratio of the number of packets dropped by the
network to the total number of packets generated at
all devices.
From the above definitions, we can find that the effective
data rate is closely related with the packet loss rate. Higher
packet loss rate leads to lower effective data rate for the
same number of transmitters. Hence, in the next section we
sometimes analyze them together.
6. IEEE 802.15.4 in Nonbeacon-Enabled Mode
In the previous section, we have described the common
settings for our simulations. This section will analyze the
impact of five impact factors (i.e., MSDU size, packet
generation interval, MaxNB, MinBE, and MaxFrameRetries)
on the performance of IEEE 802.15.4 networks in terms
of the above mentioned metrics, respectively. During the
process of simulation, when a specific parameter is examined
as the impact factor, other parameters take the default values.
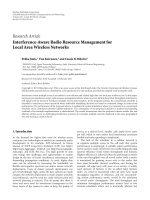
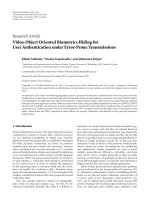
6.1. Impact of MSDU Size. MSDU size is the payload size of
MAClayeranditsmaximumis128bytes.Figure 3 shows its
influence on the performance metrics for different number
of transmitters.
Figure 3(a) depicts the measured effective data rate,
which increases with MSDU size for the same number of
transmitters. This is because the effect of overhead was
reduced, leading to a raise of data efficiency. We can also find
that for a given MSDU size, when the number of transmitters
increases, the effective data rate first increases and then
decreases. This effect can be explained as follows. As the
number of transmitters increases, more packets are sent in
the same times, which cause the first increase of effective
data rate. But too many packets will lead to packet collision
and some conflicting packets are dropped. This is why the
effective data rate decreases later.
Figure 3(b) shows the measured packet loss rate. For the
same MSDU size, the packet loss rate in denser network is
higher. One reason may be that in denser sensor networks,
more transmitters compete to access the channel. Conse-
quently, the probability of packet collision becomes higher.
For a certain number of transmitters, we can observe that
larger MSDU sizes lead to higher packet loss rates.
Figure 3(c) shows the measured end-to-end delay. The
curve trend in the figure is similar with that in Figure 3(b).
From the above analysis of packet loss rate, we know
that more transmitters and larger MSDU sizes increase the
probability of packet collision. This can increase times of
backoff and retransmission which are a considerable factor
for longer delay. Therefore, the delay grows as the increase
of the number of transmitters and MSDU size as shown in
Figure 3(c).
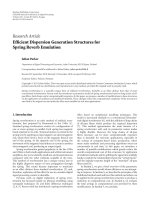
6.2. Impact of Packet Generation Interval. All transmitters
periodically generate a packet addressed to the receiver. The
time interval between two packets’ generation is referred
to as packet generation interval. It is apparent the packet
generation interval is inversely proportional to trafficload.
The result is shown in Figure 4.
Figure 4(a) shows the measured effective data rate. When
the packet generation interval is less than 0.1 s, as the number
of transmitters increases, the effective data rate first grows
and then decreases. The reason for this phenomenon is that
as the number of transmitters increases, more packets are
sent in the same time and traffic load increases; but overly-
heavy traffic load leads to higher possibility of collision which
causes the decrease of the effective data rate. On the other
hand, when the interval is larger than 0.1 s, although the
EURASIP Journal on Wireless Communications and Networking 7
0
2 4 6 8 1012141618
0
20
40
60
80
100
120
140
Effective data rate (kbps)
Number of transmitters
(a) Effective data rate
Packet loss rate
024681012141618
Number of transmitters
0
0.1
0.2
0.3
0.4
0.5
0.6
0.7
0.8
0.9
1
(b) Packet loss rate
0
2 4 6 8 1012141618
Number of transmitters
MSDU
= 20 btyes
MSDU
= 40 btyes
MSDU = 60 btyes
MSDU
= 80 btyes
MSDU
= 102 btyes
0
1
2
3
4
5
6
End-to-end delay (s)
(c) End-to-end delay
Figure 3: QoS with different MSDU sizes.
0
10
20
30
40
50
60
70
80
90
Effective data rate (kbps)
024681012141618
Number of transmitters
(a) Effective data rate
0246810121416
18
Number of transmitters
0
0.1
0.2
0.3
0.4
0.5
0.6
0.7
0.8
0.9
1
Packet loss rate
(b) Packet loss rate
0
2 4 6 8 1012141618
Number of transmitters
Packet generation interval
= 0.01 s
Packet generation interval = 0.025 s
Packet generation interval
= 0.05 s
Packet generation interval
= 0.1 s
Packet generation interval
= 1s
Packet generation interval
= 10 s
0
1
2
3
4
5
End-to-end delay (s)
(c) End-to-end delay
Figure 4: QoS with different packet generation intervals.
8 EURASIP Journal on Wireless Communications and Networking
number of transmitters increases, the trafficloadisstillvery
low. This is the reason why the effective data rate always keeps
increasing as the number of transmitters increases.
Figure 4(b) shows the measured packet loss rate, which
is lower when the packet generation interval is larger than
0.1 s. This is because larger packet generation intervals imply
lighter traffic load and hence few collisions happen. On
the other hand, when the packet generation interval is
less than 0.1 s, we can find that for a given small packet
generation interval, the packet loss rate increases with the
number of transmitters. In the meantime, for a certain
number of transmitters, the packet loss rate increases as
the interval decreases. This could be explained that smaller
packet generation intervals mean heavier trafficloadwhich
increases the probability of packet collision.
Figure 4(c) shows the measured end to end delay. We
can see that when the packet generation interval is less than
1 s, the end-to-end delay grows significantly with increasing
number of transmitters. The reason for this is that for
smaller packet generation intervals, the trafficloadgrows
significantly as the number of transmitters increases. As a
result, the competition of channel access is fierce and more
backoffs and retransmissions are needed. On the other hand,
when the packet generation interval is 1 s or 10 s, the end-to-
end delay is close to zero and changes hardly as the number
of transmitters increases.
6.3. Impact of MaxNB. MaxNB, as the name suggests, is the
maximum number of CSMA backoffs. Its default value is 4.
We vary it from 0 to 5. The result is given in Figure 5.Wecan
find that the default value of MaxNB is not the best select ion.
Figure 5(a) shows the measured effective data rate, which
grows for less (e.g., 4) transmitters as the value of MaxNB
increase. However, when the number of tr ansmitters reaches
a certain threshold, the situation becomes opposite, as
shown in the figure. In Figure 5(b), for the same number of
transmitters, contrary to the effective date rate in Figure 5(a),
the packet loss rate decreases for less transmitters with the
increase of MaxNB. But when the number of transmitters
reaches a certain threshold, the situation becomes opposite.
Figure 5(c) shows the measured end-to-end delay, which
is close to 0 for less (e.g., 2 or 4) transmitters as shown in
the figure. This is due to the fact that for less transmitters,
the channel is often idle and few collisions happen. On the
other hand, for more transmitters, the delay grows with
increasing MaxNB. This is because with increased number of
transmitters, more times of backoffs will appear, which then
lead to longer end-to-end delay.
6.4. Impact of MinBE. MinBE is the initial value of BE at the
first backoff. Its default value is 3. We vary it from 1 to 5. The
result is shown in Figure 6.
Figure 6(a) shows the measured effective data rate. We
can observe that for the same number of transmitters,
the effective data rate grows slowly as MinBE increases.
Figure 6(b) shows the measured packet loss rate, which
decreases with the increase of MinBE and the number of
transmitters. The reason for this may be that larger MinBE
012345
30
40
50
60
70
80
90
Effective data rate (kbps)
MaxNB
(a) Effective data rate
0
0.2
0.4
0.6
0.8
Packet loss rate
012345
MaxNB
(b) Packet loss rate
012345
MaxNB
Number of transmitters
= 2
Number of transmitters = 4
Number of transmitters
= 8
Number of transmitters
= 12
Number of transmitters
= 16
0
1
2
3
4
5
6
End-to-end delay (s)
(c) End-to-end delay
Figure 5: QoS with different MaxNB values.
EURASIP Journal on Wireless Communications and Networking 9
values imply larger backoff time, which cause the possibility
of detecting an idle channel to increase. As a result, with the
increase of MinBE, the effective data rate increases and the
packet loss rate decrease for the same number of t ransmitters.
Figure 6(c) shows the measured end-to-end delay. At the
same number of transmitters, the end-to-end delay grows
with the increase of MinBE.
6.5. Impact of MaxFrameRetries. MaxFrameRetries refers to
the maximum times of retransmission. If the retransmission
times of a packet exceed the MaxFrameRetries value, it will
be discarded. We vary MaxFrameRetries from 0 to 5. Figure 7
shows the results.
Figure 7(a) shows the measured effective data rate in
this context. For a given larger number of transmitters, the
effective data rate decreases slightly with the increase of
MaxframeRetries while it increases for less tr a nsmitters. In
Figure 7(b), for the same number of transmitters the curve
trend of packet loss rate is opposite to that of effective data
rate in Figure 7(a). The reason behind this is similar to
that of the MaxNB analysis for Figure 5. Figure 7(c) shows
the measured end-to-end delay. We can learn that for less
transmitters, the channel is often idle. Consequently, most of
the frames can be transmitted successfully for the first time.
As a result, the delay is close to 0. However, as the number of
transmitters increases, the network load becomes heavier and
the possibility of collision increases. Many packets need to be
retransmitted for more times. This leads to the fact that end-
to-end delay grows with the increase of MaxFrameRetries for
the more transmitters.
To summarize the performance analysis in this section,
in a network containing fewer transmitters, it is possible
to improve its QoS by applying larger MSDU sizes and
shorter packet generation intervals with tolerable delay. The
MaxNB, MinBE, and MaxFrameRetries have less effect on
sparse networks. On the other hand, in a dense network,
with the same number of transmitters, the MSDU size and
the packet generation interval are the main factors that
influence the network QoS. Although MaxNB, MinBE, and
MaxFrameRetries have less impact, it is possible to select
appropriate values for them so that the performance of IEEE
802.15.4 can be improved, especially for reducing the mean
end-to-end delay.
7. IEEE 802.15.4 in Beacon-Enabled Mode
In this section, we analyze the performance of IEEE 802.15.4
in beacon-enabled mode. We will examine how MaxNB, SO,
and BO affect the network QoS with IEEE 802.15.4 standard
in this context.
7.1. Impact of MaxNB. Here we examine the impact of
MaxNB with different (BO, SO) values, with a duty cycle
always equal to 50%. In this set of experiments, we vary
MaxNB from 0 t o 5.
Figure 8(a) shows the measured effective data rate. Under
the same duty cycle, it is clear that larger (BO, SO) values
lead to larger effective data rates. This is because with smaller
(BO, SO) values, beacons are transmitted more frequently.
12345
30
40
50
60
70
80
90
Effective data rate (kbps)
MinBE
(a) Effective data rate
12345
MinBE
0
0.1
0.2
0.3
0.4
0.5
0.6
0.7
0.8
0.9
1
Packet loss rate
(b) Packet loss rate
Number of transmitters = 2
Number of transmitters
= 4
Number of transmitters
= 8
Number of transmitters
= 12
Number of transmitters
= 16
12345
MinBE
0
1
2
3
4
5
End-to-end delay (s)
(c) End-to-end delay
Figure 6: QoS with different MinBE values.
10 EURASIP Journal on Wireless Communications and Networking
30
40
50
60
70
80
90
Effective data rate (kbps)
MaxFrameRetries
123450
(a) Effective data rate
MaxFrameRetries
12345
0
0
0.1
0.2
0.3
0.4
0.5
0.6
0.7
0.8
0.9
Packet loss rate
(b) Packet loss rate
Number of transmitters = 2
Number of transmitters = 4
Number of transmitters
= 8
Number of transmitters
= 12
Number of transmitters
= 16
MaxFrameRetries
123450
0
1
2
3
4
5
End-to-end delay (s)
(c) End-to-end delay
Figure 7: QoS with different MaxFrameRetries values.
0
100
200
300
400
500
600
700
800
900
MaxNB
123450
Effective data rate (bytes/s)
(a) Effective data rate
MaxNB
123450
0.6
0.7
0.8
0.9
1
Packet loss rate
(b) Packet loss rate
BO = 1, SO = 0
BO
= 5, SO = 4
BO
= 9, SO = 8
BO
= 13, SO = 12
MaxNB
123450
0
0.01
0.02
0.03
0.04
0.05
0.06
0.07
0.08
0.09
End-to-end delay (s)
(c) End-to-end delay
Figure 8: QoS with different MaxNB values in beacon-enabled
mode.
EURASIP Journal on Wireless Communications and Networking 11
12345
6
SO
0
200
400
600
800
1000
1200
Effective data rate (bytes/s)
(a) Effective data rate
1
2345
6
0
0.1
0.2
0.3
0.4
0.5
0.6
0.7
0.8
0.9
1
Packet loss rate
SO
(b) Packet loss rate
123456
0
1
2
3
4
End-to-end delay (s)
SO
Packet generation interval
= 0.01 s
Packet generation interval
= 0.05 s
Packet generation interval
= 0.1 s
Packet generation interval
= 0.5 s
Packet generation interval
= 1s
(c) End-to-end delay
Figure 9: QoS with different SO values.
7.1 6.1 5.1 4.1 3.1 2.1
0
100
200
300
400
500
600
700
800
900
(BO, SO)
Effective data rate (bytes/s)
(a) Effective data rate
7.1 6.1 5.1 4.1 3.1 2.1
(BO, SO)
0
0.2
0.4
0.6
0.8
1
Packet loss rate
(b) Packet loss rate
Packet generation interval= 0.01 s
Packet generation interval
= 0.05 s
Packet generation interval = 0.1 s
Packet generation interval
= 0.5 s
Packet generation interval
= 1s
7.1 6.1 5.1 4.1 3.1 2.1
(BO, SO)
0
1
2
3
4
End-to-end delay (s)
(c) End-to-end delay
Figure 10: QoS with different BO values.
12 EURASIP Journal on Wireless Communications and Networking
CCA deference is also more frequent in the case of lower
SO values, which leads to more collisions at the start of
each superframe. On the other hand, as the MaxNB value
increases, the effective data rate increases gradually. This is
due to larger MaxNB values that lead to higher probability of
successful packet transmission.
Figure 8(b) depicts the measured packet loss rate. We
observe that with the same BO value, a larger MaxNB can
lead to a lower packet loss rate. On the other hand, w ith
the same MaxNB, a smaller BO yields a higher packet loss
rate. The reason for this phenomenon is that a larger MaxNB
means a larger number of CSMA backoffs, resulting in more
packets that can be transmitted successfully. In addition, a
lower BO implies that beacons become more frequent. This
is because the probability of packet collision becomes higher
at the beginning of a new superframe.
Figure 8(c) demonstrates the measured end-to-end delay.
We can observe that with the same (BO, SO), the end-to-end
delay increases with the value of MaxNB. This is because a
larger MaxNB value implies a longer backoff time, w hich in
turn may cause longer end-to-end delay. It can also be seen
that for the same value of MaxNB, samller average delay can
be obtained with larger (BO, SO) values. This is mainly due
to the less packet collisions and retransmissions, which has
been explained previously.
7.2. Impact of SO. As mentioned in Section 4, SO decides the
length of superframe duration. In this subsection, we study
its influence on network performance. The value of BO is set
to7.WevarySOfrom1to6.
Figures 9(a) and 9(c) show the measured effective data
rate and end-to-end delay, respectively. For the same packet
generation interval, a larger SO with the same BO achieves a
higher effective data rate and a lower end-to-end delay. This
is because a larger SO implies a longer active period with a
higher duty cycle. As a result, the network has a better ability
to transmit packets within current superframe, and hence
less packets w ill experience a long sleeping delay.
Figure 9(b) depicts the measured packet loss rate. It can
be seen that with the same packet interval, a larger SO, which
implies a higher dut y cycle, yields a lower packet loss rate.
When the packet interval is 0.01 s, the packet loss rate is
almost 100% all the time. The reason behind this is that
with a larger SO, more packets can be transmitted within
the current superframe. On the other hand, with the same
SO, the packet loss rate decreases as the packet generation
interval increases.
7.3. Impact of BO. In this subsect ion, we examine the influ-
ence of BO on network performance. The value of BO con-
trols the length of superframe (i.e., beacon interval). First,
we fix the value of SO to 1. Then we examine network per-
formance with different BO values. We vary BO from 7 to 2.
Figure 10(a) shows the measured effective data rate. We
can find that as the value of BO decreases, effective data
rate grows gradually. This is mainly because the smaller BO
resulting in higher duty cycle can achieve larger bandw idth,
which implies larger effective data rates.
Figure 10(b) gives the measured packet loss rate. It has
been shown that for the same packet generation interval,
a higher BO leads to a smaller packet loss rate. This is
because under the same tr affic load, the smaller BO resulting
in larger duty cycle enables the network to transmit more
packets. For the same BO, when the traffic load decreases, the
packet loss rate descends from top (nearly 100%) to a very
small value. This effect can be explained as follows: a smaller
packet generation interval implies a higher trafficloadand
hence more packets need to be retransmitted as a result of
collisions.
Figure 10(c) presents the measured end-to-end delay.
It is clear that higher delays are experienced for larger
BO values with the same packet generation interval. The
reason is that a larger BO causes a longer inactive period,
in which case buffered packets may potentially experience
a longer sleeping delay. For the same BO, the increase in
packet generation interval results in decreased average delay.
This is easy to understand since heavier trafficloadsas
a consequence of smaller packet generation intervals may
cause more collisions and retransmissions.
To summarize this section, we extensively discussed a
number of QoS measures of IEEE 802.15.4 standard in
beacon-enabled mode. The results demonstrate the impact
of MaxNB, BO, and SO on the performance of the standard.
By analyzing the results, we can learn that in order to get low
latency and high effective data rate, we should increase the
value of SO and decrease the value of BO as much as possible.
We should select a suitable value for MaxNB, according to
the requirements of the target CPS applications. In addition,
the results indicate that we should configure and optimize
the protocol parameters by taking into account the practical
application environments when designing CPS.
8. Conclusions
In this paper, we have presented a comprehensive per-
formance evaluation of IEEE 802.15.4 standard in two
different modes in the context of CPS. Considering general
requirements of CPS applications, several network QoS
metrics including effective data rate, packet loss rate, and
end-to-end delay have been examined. We analyze them with
respect to some important and variable protocol parameters.
The analysis of simulation results provides some insights
for configuring and optimizing the IEEE 802.15.4 protocol
for CPS applications. A key finding is that the default
configuration specified in the standard may not yield the best
QoS in all cases. Consequently, some protocol parameters
should adapt to the environments, while taking into account
the CPS application requirements.
In future work, we will examine how to extend/modify
IEEE 802.15.4 to make it more suitable for CPS applications.
Self-adaptive and autonomous approaches will be our focus.
Acknowledgments
This work was partially supported by the National Natural
Science Foundation of China under Grant no. 60903153, the
Fundamental Research Funds for the Central Universities
EURASIP Journal on Wireless Communications and Networking 13
(DUT10ZD110), Russian Foundation for B asic Research
(Project no. 10-08-01071-a) and the SRF for ROCS, SEM,
China.
References
[1] R. Rajkumar, I. Lee, L. Sha, and J. Stankovic, “Cyber-physical
systems: the next computing revolution,” in Proceedings of the
47th Annual Design Automation Conference (DAC ’10),pp.
731–736, Anaheim, Calif, USA, June 2010.
[2] R. Poovendran, “Cyber-physical systems: close encounters
between two parallel worlds,” Proceedings of the IEEE, vol. 98,
no. 8, pp. 1363–1366, 2010.
[3] “Cyber-Physical Systems Summit Report,” April 2008,
/>[4] F. Xia, L. Ma, J. Dong, and Y. Sun, “Network QoS management
in cyber-physical systems,” in Proceedings of the International
Conference on Embedded Software and Systems (ICESS ’08),pp.
302–307, IEEE, Chengdu, China, July 2008.
[5] “IEEE 802.15.4-2006. Part 15.4: Wireless Medium Access
Control (MAC) and Physical Layer (PHY) Specifications for
Low-Rate Wireless Personal Area Networks (WPANs),” 2006.
[6] W. Feng, L. Dou, and Z. Yuping, “Analysis and compare of
slotted and unslotted CSMA in IEEE 802.15.4,” in Proceedings
of the 5th International Conference on Wireless Communica-
tions, Networking and Mobile Computing (WiCOM ’09),pp.
3659–3663, September 2009.
[7] J. Zheng and M. J. Lee, “Will IEEE 802.15.4 make ubiquitous
networking a reality? A discussion on a potential low power,
low bit rate standard,” IEEE Communications Magazine, vol.
42, no. 6, pp. 23–29, 2004.
[8] G. Lu, B. Krishnamachari, and C. S. R aghavendra, “Perfor-
mance evaluation of the IEEE 802.15.4 MAC for low-rate
low-powerwirelessnetworks,”inProceedings of the 23rd IEEE
International Performance, Computing, and Communications
Conference (IPCCC ’04), pp. 701–706, Phoenix, Ariz, USA,
April 2004.
[9] S. Pollin, M. Ergen, S. C. Ergen et al., “Performance analysis
of slotted carrier sense IEEE 802.15.4 medium access layer,”
IEEE Transactions on Wireless Communications,vol.7,no.9,
pp. 3359–3371, 2008.
[10]C.Y.Jung,H.Y.Hwang,D.K.Sung,andG.U.Hwang,
“Enhanced Markov chain model and throughput analysis of
the slotted CSMA/CA for IEEE 802.15.4 under unsaturated
traffic conditions,” IEEE Transactions on Vehicular Technology,
vol. 58, no. 1, pp. 473–478, 2009.
[11] Y. K. Huang, A. C. Pang, and H. N. Hung, “A comprehensive
analysis of low-power operation for beacon-enabled IEEE
802.15.4 wireless networks,” IEEE Transactions on Wireless
Communications, vol. 8, no. 11, pp. 5601–5611, 2009.
[12] S. Ren, K. M. M. Aung, and J. S. Park, “A probe for the
performance of low-rate wireless personal area networks,” in
International Conference on Intelligent Computing (ICIC ’06),
vol. 344 of Lecture Notes in Control and Information Sciences,
pp. 158–164, Kunming, China, August 2006.
[13] C. Buratti, “Performance analysis of IEEE 802.15.4 beacon-
enabled mode,” IEEE Transactions on Vehicular Technology,
vol. 59, no. 4, pp. 2031–2045, 2010.
[14] T. O. Kim, J. S. Park, H. J. Chong, K. J. Kim, and B. D. Choi,
“Performance analysis of IEEE 802.15.4 non-beacon mode
with the unslotted CSMA/CA,” IEEE Communications Letters,
vol. 12, no. 4, pp. 238–240, 2008.
[15] C. Buratti and R. Verdone, “A mathematical model for
performance analysis of IEEE 802.15.4 non-beacon enabled
mode,” in Proceedings of the 14th European Wireless Conference
(EW ’08), pp. 1–7, June 2008.
[16] B. Latr
´
e, P. De Mil, I. Moerman, B. Dhoedt, P. Demeester,
and N. van Dierdonck, “Throughput and delay analysis of
unslotted IEEE 802.15.4,” Journal of Networks,vol.1,no.1,pp.
20–28, 2006.
[17] D. Rohm, M. Goyal, H. Hosseini, A. Divjak, and Y. Bashir, “A
simulation based analysis of the impact of IEEE 802.15.4 MAC
parameters on the performance under different trafficloads,”
Mobile Information Systems, vol. 5, no. 1, pp. 81–99, 2009.
[18] D. Rohm, M. Goyal, H. Hosseini, A. Divjak, and Y. Bashir,
“Configuring beaconless IEEE 802.15.4 networks under dif-
ferent traffic loads,” in Proceedings of the IEEE 23rd Interna-
tional Conference on Advanced Information Networking and
Applications (AINA ’09), pp. 921–928, University of Bradford,
Bradford, UK, May 2009.
[19] C. Buratti and R. Verdone, “Performance analysis of IEEE
802.15.4 non beacon-enabled mode,” IEEE Transactions on
Vehicular Technology, vol. 58, no. 7, pp. 3480–3493, 2009.
[20] E. Callaway, P. Gorday, L. Hester et al., “Home networking
with IEEE 802.15.4: a developing standard for low-rate wire-
less personal area networks,” IEEE Communications Magazine,
vol. 40, no. 8, pp. 70–77, 2002.
[21] N. Salles, N. Krommenacker, and V. Lecuire, “Performance
study of IEEE 802.15.4 for industrial maintenance applica-
tions,” in Proceedings of the IEEE International Conference on
Industrial Technology (ICIT ’08), pp. 1–6, Chengdu, China,
April 2008.
[22] F. Chen, N. Wang, R. German, and F. Dressler, “Simulation
study of IEEE 802.15.4 LR-WPAN for industrial applications,”
Wireless Communications and Mobile Computing, vol. 10, no.
5, pp. 609–621, 2010.
[23] X. Liang and I. Balasingham, “Performance analysis of the
IEEE 802.15.4 based ECG monitoring network,” in Proceedings
of the 7th IASTED International Conferences on Wireless and
Optical Communications, pp. 99–104, Montreal, Canada, May-
June 2007.
[24] C. Li, H. B. Li, and R. Kohno, “Performance evaluation of IEEE
802.15.4 for wireless body area network (WBAN),” in Proceed-
ings of the IEEE International Conference on Communications
Workshops (ICC ’09), pp. 1–5, June 2009.
[25] J. Liu, I. Demirkiran, T. Yang, and A. Helfrick, “Feasibility
study of IEEE 802.15.4 for aerospace wireless sensor net-
works,” in Proceedings of the 28th Digital Avionics Systems
Conference: Modernization of Avionics and ATM-Perspectives
from the Air and Ground (DASC ’09), pp. 1.B.31–1.B.310,
Orlando, Fla, USA, October 2009.
[26]F.Chen,T.Talanis,R.German,andF.Dressler,“Real-time
enabled IEEE 802.15.4 sensor networks in industrial automa-
tion,” in Proceedings of the IEEE International Symposium
on Industrial Embedded Systems (SIES ’09), pp. 136–139,
Lausanne, Switzerland, July 2009.
[27] A. Mehta, G. Bhatti, Z. Sahinoglu, R. Viswanathan, and
J. Zhang, “Performance analysis of beacon-enabled IEEE
802.15.4 MAC for emergency response applications,” in
Proceedings of the 3rd International Conference on Advanced
Networks and Telecommunication Systems, pp. 151–153, New
Delhi, India, December 2009.
[28] K. Zen, D. Habibi, A. Rassau, and I. Ahmad, “Performance
evaluation of IEEE 802.15.4 for mobile sensor networks,” in
Proceedings of the 5th IEEE and IFIP International Conference
on Wireless and Optical Communications Networks (WOCN
’08), pp. 1–5, Surabaya, India, May 2008.
14 EURASIP Journal on Wireless Communications and Networking
[29] R. Gao, F. Xia, L. Wang, T. Qiu, and A. V. Vinel, “Performance
analysis of non-beaconed IEEE 802.15.4 for high-confidence
wireless communications,” in Baltic Conference on Future
Internet Communications (BCFIC ’11), pp. 83–89, IEEE, Riga,
Latvia, February 2011.
[30] F. Xia, “QoS challenges and opportunities in wireless sen-
sor/actuator networks,” Sensors, vol. 8, no. 2, pp. 1099–1110,
2008.
[31] F. Xia, Y. C. Tian, Y. Li, and Y. Sun, “Wireless sensor/actuator
network design for mobile control applications,” Sensors, vol.
7, no. 10, pp. 2157–2173, 2007.