Báo cáo hóa học: " Memory properties and charge effect study in Si nanocrystals by scanning capacitance microscopy and spectroscopy" docx
Bạn đang xem bản rút gọn của tài liệu. Xem và tải ngay bản đầy đủ của tài liệu tại đây (729.02 KB, 5 trang )
NANO EXPRESS Open Access
Memory properties and charge effect study in Si
nanocrystals by scanning capacitance microscopy
and spectroscopy
Zhen Lin
1*
, Georges Bremond
1†
, Franck Bassani
2†
Abstract
In this letter, isolated Si nanocrystal has been formed by dewetting process with a thin silicon dioxide layer on top.
Scanning capacitance microscopy and spectroscopy were used to study the memory properties and charge effect
in the Si nanocrystal in ambient temperature. The retention time of trapped charges injected by different direct
current (DC) bias were evaluated and compared. By ramp process, strong hysteresis window was observed. The DC
spectra curve shift direction and distance was observed differently for quantitative measurements. Holes or
electrons can be separately injected into these Si-ncs and the capacitance changes caused by these trapped
charges can be easily detected by scanning capacitance microscopy/spectroscopy at the nanometer scale. This
study is very useful for nanocrystal charge trap memory application.
Recently, the self-assembled silicon nanocrystals (Si-ncs)
that are formed within ultrathin SiO
2
layer are consid-
ered to be a promising replacement of this conventional
floating gate [1,2]. These isolated Si-ncs embedded in
between a tunnel and a top dielectric layer serve as the
charge storage nodes and exhibit many physical proper-
ties even at room temperature such as Coulomb block-
ade [3], single-electron transfer [4] and quantiza tion
charges effect [5] which differ from bulk crystals. It can
reduce the problem of charge loss encountered in con-
ventional memories, cause thinner injection oxides and
hence smaller operating voltages, better endurance and
faster write/erase speeds. So, the characterisation and
understanding of its charging mechanism in such nanos-
tructure is of prime importance.
Although the conventional I-V and C-V characteriza-
tion methods for memory application pr ovide a vast
amount of macro information, these methods lack the
ability of discriminating structural and material proper-
ties on a nanometer scale. Since atomic force micro-
scopy (AFM) was invented by Binning and Rohrer in
IBM, 1982 (Nobel Prize awards in 1986), it has become
a powerful high-spatial-resolution tool for nanoscale
semiconductor analysis or characterization comparing to
several conventional methods for such as x-ray, nuclear,
electron and ion beam, optical and infrared and chemi-
cal technique. It can provide simultaneous topography
and various physical feature images with some addi-
tional electrical applications such as scanning capaci-
tance microscopy (SCM) [6,7], electrostatic force
microscopy (EFM) [8], scanning resistance microscopy
[9] and Kelvin probe force microscopy [10]. In amount
of these techniques, SCM became one of the most use-
ful methods for the capacitance chara cterization of
semicond uctor as its non-destructi ve detection of varies
electrical properties with high resolution such as dopant
profiling variation [11], silicon p-n junction [12] and
carrier injection [13], etc.
In this letter, scanning capaci tance microscopy and
spectroscopy (SCS) were used to study the memory
properties and charge effect of the Si-ncs materials in
ambient temperature.
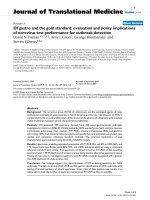
Figure 1 shows the formatio n of these isolated Si-ncs.
First, a 4-nm-thick thermal oxide was grown as the tun-
nelling oxide on an amorphous Si substrate. Subse-
quently, Si layer was deposited by molecular beam
epitaxy over a very thin SiO
2
layer, 5 nm in thickness, at
ambient temperature and was thermally anne aled at
* Correspondence:
† Contributed equally
1
Institut des Nanotechnologies de Lyon, UMR 5270, Institut National des
Sciences Appliquées de Lyon, Université de Lyon, Bât. Blaise Pascal, 20,
avenue Albert Einstein - 69621 Villeurbanne Cedex, France
Full list of author information is available at the end of the article
Lin et al. Nanoscale Research Letters 2011, 6:163
/>© 2011 Lin et al; licensee Springer. This is an Open Ac cess article distributed under the ter ms of the Cr eative Commons Attribution
License (http://creativ ecommons.org/licenses/by/2.0), which permits unrestricted use, distribution, and reproduction in any medium,
provided the original work is properly cited.
750°C for 20 min under ultrahigh vacuum. The dewet-
ting process leads to the formation of isolated Si nano-
crystals having an average density of 4 × 10
10
cm
-2
.
Veeco Digital Instruments 3100 Dimensions AFM
employing a Nanoscope V controller was used to con-
duct SCM and SCS measurements. The conductive tip
that was selected was commercial Arrow-EFM PtIr coat-
ing tip. It has an average tip radius of less than 10 nm,
cantilever spring constant: 2.8 N/m and resonance fre-
quency:75kHz.SCMimagesweretakenwithafixed
bias frequency of 50 kHz, SCM lock-in phase of 90°and
capacitance sensor frequency of 910 MHz. The ampli-
tude of direct current (DC)/direct voltage signal is
strongly dependent on the modulation voltages and the
magnitude of capacitance variation is generally a non-
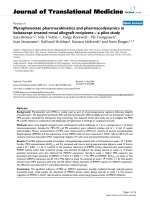
linear function of the carrier concentration. Figure 2
shows the topography and SCM image. The contrast
between Si-nc and the oxide layer was clear in SCM
image which indicates that the Si-nc has different capa-
citance from the oxide layer.
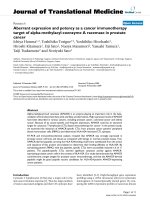
In order to investigate the effects of DC bias and alter-
nating current (AC) bias to the SCM signal, the slows-
can was disabled and a typical line scan was perform ed.
In Figure 3a, the VAC bias was fixed to 2,500 mV. The
SCM image and signal variation with DC bias is shown
in Figure 3a. Different DC bias during the scan can
cause different SCM signal. The best signal/no ise ratio
and highest contrast occurred when -1 or 0.5 V was
applie d, which is the same as Ge nanocrystals. Too high
DC bias amplitude, such as up to 2 V, will make the
SCM signal disappeared. Figure 3b i llustrates this varia-
tion in function to the DC bias. The higher the DC bias
amplitude, the stronger SCM signal intensity was. How-
ever, the lower the contrast between the Si-ncs and
dielectric layer was. Positive or negative modulation cor-
responds to different SCM phase. The best resolution
and the best signal to noise ratio which correspond to
the highest contrast between Si-ncs and dielectric layer
in the image was obtained near -0.5 and 0.5 V with t he
scan rate of 0.5 Hz.
AC bias was also investigated by fixing the DC bias to
0.5 V which is one of the best DC bias as we mentioned
above. The SCM line scan image with different AC bias
anditsvariationwasshowninFigure4.Thecontrast
between the Si-ncs and dielectric layer changed with AC
bias. The higher the AC bias, the stronger the SCM sig-
nal intensity was. However, too high AC voltage can
induce charge injection in the sample which will create
parasitic capacitance and high noise. Here, 2 V AC bias
was fixed during the scan.
Charge injection was done by separately applying (0.5,
1.0, 2.0, and 3.0 V) to the tip during the contact SCM
scan. Then DC bias was set back to -0.5 V which wa s
the best as we chose for our signal. As the SCM signal
is dependent on the quantity of injected charges, it was
monitored for charge retention time study. The non-
Figure 1 The formation of isolated Si-ncs.
Figure 2 Si nanocrystal images. (a) Topography (b) SCM data image.
Lin et al. Nanoscale Research Letters 2011, 6:163
/>Page 2 of 5
linear function between the retention time and the DC
bias is shown in Figure 5. The higher the DC bias (char-
ging voltage) was, the longer i ts discharge time was,
which means more carriers were injected into the Si-nc.
Holes are much easier to be injected than electrons as
the retention time of positive charging was longer than
the negative charging with respect to the same DC char-
ging intensity. When charge injection was done by more
than 7 V, the charging process can’t be detected in sev-
eral minutes. This indicates that the charges were
trapped by the Si-nc which made the retention time
much longer.
Ramp processes between -2 and +2 V were done by
SCS separately on and outside an isolated Si-nc without
charge injection. Strong hysteresis window was observed
on the isolated Si-nc. But outside the dot, this effect was
tooweak(seeinFigure6).Furthermore,SCSwasused
to quantitatively investigate trapped charge effect inside
the isolated Si-nc. From the SCS signals, the curve shift
direction and distance were observed differently by
applying a DC bias of -10 or +10 V to the tip during
charging (see in Figure 7). There is a shift of 0.91 V by
+10-V charge while -0.74 V shift by -10-V charge. This
relates to the fact that different type of carriers can be
injected into these Si-ncs and the capacitance changes
caused by these trapped charges can be easily detected
by SCM at the nanometer scale. It also verified the pre-
vious conclusion that holes are much easier to be
injected and trapped than electrons.
In this letter, Si-ncs were formed on top of a ther-
mally grown silicon dioxide layer. SCM and SCS were
used to study the memory properties and charge effect
on the Si-ncs in ambient temperature. Applying DC bias
to the conductive tip, charges were injected into the
Si-ncs which was recorded by the SCM images. The
Figure 3 SCM image (a) and signal (b) versus different DC bias.
Figure 4 SCM image (a) and signal (b) versus different AC bias.
Figure 5 Charge and discharge with different DC bias .
Lin et al. Nanoscale Research Letters 2011, 6:163
/>Page 3 of 5
Figure 6 Ramp process for hysteresis window by SCS.
Figure 7 SCS curve shift after charge injection by +10 and -10 V.
Lin et al. Nanoscale Research Letters 2011, 6:163
/>Page 4 of 5
retention time o f these trapped charges injected by dif-
ferent DC bias were evaluated and compared. By ramp
process, strong hysteresis window was observed from
the SCS signal. Furthermore, the SCS curve shift d irec-
tion and distance were observed differently for quantita-
tive measurements. This relates to the fact that holes or
electrons can be separately injected into these Si-ncs
and the capacitance changes caused by these trapped
charges could be e asily detected by SCM/S CS at the
nanometer scale.
Acknowledgements
Thanks X.Y. Ma for her helpful suggestions and Armel Descamps-Mandine
from the CLYM platform facilities for his help and fruitful discussions on AFM
measurements.
Author details
1
Institut des Nanotechnologies de Lyon, UMR 5270, Institut National des
Sciences Appliquées de Lyon, Université de Lyon, Bât. Blaise Pascal, 20,
avenue Albert Einstein - 69621 Villeurbanne Cedex, France
2
Institut Matériaux
Microélectronique Nano sciences de Provence, UMR CNRS 6242, Avenue
Escadrille Normandie-Niemen-Case 142, F-13397 Marseille Cedex 20, France
Authors’ contributions
ZL carried out the SCM and SCS experiment, studied these results and
drafted the manuscript. GB participate the study of experiment results and
manuscript writing. FB conducted the sample fabrication and the discussion.
All authors read and approved the final manuscript.
Competing interests
The authors declare that they have no competing interests.
Received: 19 September 2010 Accepted: 22 February 2011
Published: 22 February 2011
References
1. Blauwe JD: Nanocrystal nonvolatile memory devices. IEEE Transaction on
Nanotechnology 2002, 1:72-77.
2. Tiwari S, Rana F, Chan K, Hanafi H, Wei C, Buchanan D: Volatile and non-
volatile memories in silicon with nano-crystal storage. IEEE Int Electron
Devices Meeting Tech Dig 1995, 521-524.
3. Gacem K, EI Hdiy A, Troyon M, Berbezier I, Szkutnik PD, Karmous A,
Ronda A: Memory and Coulomb blockade effects in germanium
nanocrystals embedded in amorphous silicon on silicon dioxide. J Appl
Phys 2007, 102:093704.
4. Howell SW, Janes DB: Time evolution studies of the electrostatic surface
potential of low-temperature-grown GaAs using electrostatic force
microscopy. J Appl Phys 2005, 97:043703.
5. Thirstrup C, Sakurai M, Stokbro K, Aono M: Visible light emission from
atomic scale patterns fabricated by the scanning tunneling microscope.
Phys Rev Lett 1999, 82:1241.
6. Matey JR, Blanc J: Scanning capacitance microscopy. Journal of Applied
Physics 1985, 57(5):1437-1444.
7. Barrett RC, Quate CF: Charge Storage in a Nitride-Oxide-Silicon Medium
by Scanning Capacitance Microscopy. J Appl Phys 1991, 70:2725.
8. Lambert J, Guthmann C, Saint-Jean M: Relationship between charge
distribution and its image by electrostatic force microscopy. J Appl Phys
2003, 93:5369.
9. Shafai C, Thomson DJ, Simard-Normandin M, Mattiusi G, Scanlon PJ:
Delineation of semiconductor doping by scanning resistance
microscopy. Appl Phys Lelt 1994, 64.
10. Henning AK, Hochwitz T, Slinkman J, Never J, Hoffman S, Kaszuba P,
Daghlin C: Two-dimensional surface dopant profiling in silicon using
scanning Kelvin probe microscopy. J Appl Phys 1995, 77:1888.
11. Huang Y, Williams CC, Slinkman J: Quantitative two-dimensional dopant
profile measurement and inverse modeling by scanning capacitance
microscopy. Appl Phys Lett 1995, 66:344.
12. Kopanski JJ, Marchiando JF, Lowney JR: Scanning capacitance microscopy
measurements and modeling: Progress towards dopant profiling of
silicon. J Vac Sci Technol B 1996, 14(l):242.
13. Hong JW, Shin SM, Kang CJ, Kuk Y, Khim ZG, Park , Sang-Il : Local charge
trapping and detection of trapped charge by scanning capacitance
microscope in the SiO
2
/Si system. Applied Physics Letters 1999, 75(12):1760.
doi:10.1186/1556-276X-6-163
Cite this article as: Lin et al.: Memory properties and charge effect
study in Si nanocrystals by scanning capacitance microscopy and
spectroscopy. Nanoscale Research Letters 2011 6:163.
Submit your manuscript to a
journal and benefi t from:
7 Convenient online submission
7 Rigorous peer review
7 Immediate publication on acceptance
7 Open access: articles freely available online
7 High visibility within the fi eld
7 Retaining the copyright to your article
Submit your next manuscript at 7 springeropen.com
Lin et al. Nanoscale Research Letters 2011, 6:163
/>Page 5 of 5