Báo cáo hóa học: " Research Article Location-Based Self-Adaptive Routing Algorithm for Wireless Sensor Networks in Home Automation" doc
Bạn đang xem bản rút gọn của tài liệu. Xem và tải ngay bản đầy đủ của tài liệu tại đây (743.95 KB, 15 trang )
Hindawi Publishing Corporation
EURASIP Journal on Embedded Systems
Volume 2011, Article ID 484690, 15 pages
doi:10.1155/2011/484690
Research Article
Location-Based Self-Adaptive Routing Algorithm for
Wireless Sensor Networks in Home Automation
Xiao Hui Li,
1
Seung Ho Hong,
2
and Kang Ling Fang
1
1
College of Information Science and Engineering, Engineering Research Center of Metallurgical Automation and
Measurement Technology, Ministry of Education, Wuhan University of Science and Technology, Wuhan 430081, China
2
Department of Electronics, Information and System Engineering, Ubiquitous Sensor Network Research Center,
Hanyang University, Ansan 426-791, Republic of Korea
Correspondence should be addressed to Seung Ho Hong,
Received 28 June 2010; Revised 10 October 2010; Accepted 17 January 2011
Academic Editor: Peter Palensky
Copyright © 2011 Xiao Hui Li et al. This is an open access article distributed under the Creative Commons Attribution License,
which permits unrestricted use, distribution, and reproduction in any medium, provided the original work is properly cited.
The use of wireless sensor networks in home automation (WSNHA) is attractive due to their characteristics of self-organization,
high sensing fidelity, low cost, and potential for rapid deployment. Although the AODVjr routing algorithm in IEEE
802.15.4/ZigBee and other routing algorithms have been designed for wireless sensor networks, not all are suitable for WSNHA.
In this paper, we propose a location-based self-adaptive routing algorithm for WSNHA called WSNHA-LBAR. It confines route
discovery flooding to a cylindrical request zone, which reduces the routing overhead and decreases broadcast storm problems in
the MAC layer. It also automatically adjusts the size of the request zone using a self-adaptive algorithm based on Bayes’ theorem.
This makes WSNHA-LBAR more adaptable to the changes of the network state and easier to implement. Simulation results show
improved network reliability as well as reduced routing overhead.
1. Introduction
Home automation (HA) systems are increasingly used to
increase the safety and comfort of residents and pro-
vide distributed control over heating, ventilation, and air
conditioning (HVAC), and lighting to save energy cost.
Consequently, the home-automation industry has grown
remarkably over the last few decades and is still evolving
rapidly. Researchers and engineers are increasingly looking
at novel technologies to lower the total installation and
maintenance cost of HA systems. Wireless technology is a
key driver in reaching those goals due to no cost for cabling,
easy deployment, good scalability, and easy integration with
mobile user devices.
The low-power wireless sensor network (WSN) is a
promising network technology that has recently emerged in
HA systems. WSNs generally consist of a number of small
sensor nodes with sensing, data processing, and wireless
communications capabilities [1]. These sensor nodes are
inexpensive and have a battery lifetime of several years on at
a low-duty cycle. They are suitable for home network settings
where smart sensor nodes and actuators may be hidden
in appliances such as vacuum cleaners, microwave ovens,
refrigerators, and home entertainment devices. These sensor
nodes inside devices in the home can interact with each
other. They allow residents to manage devices in their homes
more easily, both locally and remotely. Therefore, interest has
grown in wireless sensor network technology in the field of
home automation [2]. We refer to the combination of HA
and WSN as wireless sensor networks in home automation
(WSNHA).
The most popular standard for WSNHA is the IEEE
802.15.4/ZigBee/HA public application profile, among which
IEEE 802.15.4/ZigBee provides general purpose, easy-to-use,
and self-organizing wireless communi-cation for low cost,
at a low data rate, with low complexity, and using low-
power embedded devices [3–5]. The HA public application
profile provides standard interfaces and device definitions
to allow easy interoperability among ZigBee HA devices
produced by various manufacturers of ZigBee HA products.
While IEEE 802.15.4 defines the physical (PHY) layer and
the medium access control (MAC) layer, ZigBee defines the
2 EURASIP Journal on Embedded Systems
layers above. IEEE 802.15.4 is considered mainly for sensor
networks. Considering the low cost and easy realization in
WSN, MAC 802.15.4 reduces the complexity, resulting in a
simpler algorithm, but it does not have adequate technology
to guarantee reliable transmission in the case of high traffic
and high mobility [3–5].TheZigBeenetworklayersupports
AODVjr routing, a variation of ad hoc on-demand distance-
vector (AODV) routing [6]. On-demand routing protocol is
event-driven, and it searches for a route from the source to
the destination only when data packets must be sent. When
no data packets are transmitted, the nodes remain silent
and eventually enter a sleep status. This type of on-demand
routing protocol is most suitable for WSNHA because,
unlike proactive routing protocols, it does not maintain a
real-time routing table for all nodes. On-demand routing
protocols have a lower routing overhead and node storage
requirement than do proactive routing protocols. This is
the key motivation for ZigBee to adopt AODVjr as the
default routing algorithm. A flooding technique is often
used for route discovery in on-demand routing protocols.
AODVjr [7] also performs route discovery by flooding route
request packets (RREQs) to the entire wireless network to
guarantee route discovery in the case of HA link instability.
However, flooding packets can lead to excessive drain on
limited battery power and reduce the packet delivery ratio in
WSNHA because MAC 802.15.4 cannot afford heavy routing
overhead, which can easily cause a broadcast storm when
contention and collision occur in the MAC layer.
In order to save energy and reduce the routing overhead
and packet average delay and to ensure reliable data trans-
mission, in this paper we present a new routing algorithm
for WSNHA, namely, WSNHA-LBAR (location-based self-
adaptive routing for WSNHA). Instead of using flooding
technology to search blindly for the route across the entire
network, the proposed routing algorithm makes full use
of location information of the sensor nodes in WSNHA
to confine the flooding route searching space to a smaller
estimated cylindrical zone and automatically adjust the
radius of the cylindrical zone based on Bayes’ theorem.
Having a smaller route searching space results in lower
routing overhead and reduces broadcast storm in the MAC
layer.
The remainder of this paper is structured as follows.
Section 2 describes related work, which includes the analysis
of the WSNHA characteristics and a survey of the routing
protocols for WSNHA. Section 3 highlights the motiva-
tion for the current work. Section 4 describes the routing
algorithm of the WSNHA-LBAR. Section 5 shows how the
performance of WSNHA-LBAR was evaluated by simulation.
Section 6 presents the conclusions.
2. Related Works
Many routing, power management, and data dissemination
protocols have been specially designed for WSNs, where
energy awareness is a central design issue. The focus, how-
ever, has been on routing protocols tailored to applications
and network architectures. It is therefore necessary for
routing designers to meet the requirements of WSNHA
systems. This section compares the existing categories of
WSN routing protocols based on the characteristics of
WSNHA.
2.1. WSNHA Characteristics. HA is now a mature technol-
ogy, and many articles describe the characteristics of these
systems [2, 8]. In general, WSNHA devices can be divided
into three categories: sensors, actuators, and controllers.
Sensors distributed throughout a house collect physical data
such as temperature, humidity, motion, and light level. Actu-
ators are attached to the objects the system controls, such
as lamps, refrigerators, and air-conditioners. HA control
functions are usually embedded in the actuators. Actuator
nodes generally have fixed locations and are powered by a
main electricity supply. Controllers are used to control and
query the home automation settings. In addition, mobile
userinterfacedevicessuchasPDAsandsmartphones
are able to access the network for control or monitoring
purposes. These handheld devices are usually highly mobile
and only communicate sporadically.
Some battery-powered sensor nodes do not easily accom-
modate battery recharging or frequent battery replacement.
This necessitates that the routing algorithm considers energy
efficiency. Due to their low cost, sensor nodes usually have
limited memory, which requires that the routing algorithm
is simple and has low information storage requirements.
WSNHA coverage is generally small, and the sensor node
distribution depends on the house structure and the
application, requiring a routing algorithm that can self-
adapt to the node distribution. Link instability can be an
issue because signal propagation inside a room encounters
greater reflection, diffraction, and dispersion than does that
outdoors, especially when the occupants are at home. This
requires that the routing algorithm be able to self-adapt to
link instability.
Using wireless sensor networks in home automation is
prevalent and cost effective. A routing algorithm for WSNHA
must meet these requirements to achieve reliability and
energy efficiency in data packet delivery.
2.2. Comparisons of Routing Protocols for WSNs. In general,
WSN routing protocols can be classified as flat-based rout-
ing, hierarchical-based routing, or location-based routing,
depending on the network structure [9, 10]. Flat-based
routing has low storage requirements and a simple algorithm,
and it uses flooding as its main routing technology [9,
10]. Typical common flat-based routing protocols include
directed diffusion [11], SPIN [12], rumor routing [13], and
GBR [14]. Flooding technology results in considerable delay
and needless energy consumption, as data are forwarded to
every sensor.
Cluster-based routing is an efficient way to reduce energy
consumption and extend the network lifetime within a
cluster. The number of messages transmitted to the base
station is reduced by data aggregation and fusion. Cluster-
based routing is mainly implemented as two-layer routing:
one layer is used to select cluster heads, and the other
EURASIP Journal on Embedded Systems 3
layer is used for routing. High-energy nodes in cluster-
based routing can be used to process and send information,
whereas low-energy nodes can be used to perform sensing in
close proximity to the target. Typical common cluster-based
routing protocols include LEACH [15], PEGASIS [16], TEEN
[17], and TTDD [18]. The clustering algorithm is based on a
distributed algorithm, which incurs extra overhead and is not
particularly easy to implement in WSNHA. WSNHA does
not require the level of complexity of the cluster formation
algorithm.
Location-based routing protocols are less complicated
and easier to implement than cluster-based routing protocols
and more energy efficient than flat-based routing protocols
due to reduced flooding. WSNHA systems are generally
small, and most of the nodes are static. Obtaining location
information can be easily implemented in WSNHA. The
availability of small, low-power global positioning system
receivers for calculating relative coordinates makes it possible
to apply location-based routing algorithms in WSNHA. The
location information of all the sensor nodes in WSNHA can
be stored. This makes location-based routing most suitable
for WSNHA. Location-based routing makes full use of
location information to reduce energy consumption. Typical
common location-based routing protocols include GAF [19]
andGEAR[20].
2.3. Location-Based Routing. In WSNHA, building an effi-
cient and reliable routing algorithm is a very challenging
task due to the limited resources and link instability. We can
group location-based routing into three types according to
location information usage [21, 22]. The first is the localized
routing algorithm in which each node only uses the location
of itself, its neighboring nodes, and the destination to
forward the packets to the next hop. Typical localized routing
protocols include GPSR [23], GEAR [20], and GOAFR [24].
The main component in this type of routing is simple greedy
forwarding in which the packet should make progress at each
step along the path. Each node forwards the packet to a
neighbor closer to the destination than itself, until ultimately
the packet reaches the destination. Greedy forwarding easily
causes the nodes to end up at a local minimum. In other
words, if nodes have consistent location information, greedy
forwarding is guaranteed to be loop-free.
The second type of location-based routing is the grid-
based routing algorithm, which divides the network into
many smaller grids based on the location information of the
nodes. All the nodes in the same grid only send the data
packet to their grid leader. Grid leaders are responsible for
routing data packets by grids. Typical grid-based routing
protocols include GAF [19]andGRID[25]. Grid-based
routing algorithms are suitable for large and dense networks
due to the reduction of routing complexity. However,
dividing the network into grids for small systems such as
WSNHAislessconstructive.
The third type is the location-aided routing algorithm,
which uses the location information of nodes for route
discovery and limits the route discovery flooding to a
geographic area around the destination. Typical location-
aided routing protocols include LAR [26], DREAM [27], and
LBM [28]. AODVjr in ZigBee also uses flooding for route
discovery. So this location-aided routing scheme is promising
for the improvement of AODVjr.
3. Motivation for Current Work
Although IEEE 802.15.4/ZigBee, which supports AODVjr as
the default routing algorithm, is the popular standard for
WSNHA, WSNHA presents certain challenges related to its
practical design and implementation. Due to the nonuni-
form node distribution and link instability in WSNHA,
flooding RREQ in AODVjr leads to a high possibility of
broadcast storm and collision in MAC 802.15.4, a low packet
delivery ratio, and high energy consumption. Therefore, it is
desirable to improve the performance of AODVjr as well as
to ensure reliable data transmission in WSNHA.
The development of localization work made location-
based routing possible. We can make full use of the location
information of nodes for route discovery of AODVjr and
limit the route discovery flooding to a smaller zone around
the destination, a strategy referred to as location-aided
routing (the smaller zone is named the “request zone” in this
paper). However, two problems remain to be overcome. The
first is the definition and calculation of the request zone; the
second is self-adaptation of the request zone.
3.1. Definition and Calculation of the Request Zone. LAR [26],
DREAM [27], and LBM [28] represent three request zone
shapes: rectangle, bar, and fan, respectively. However, LAR
and DREAM are designed for Ad Hoc networks, and so the
request zones in LAR and DREAM are calculated using the
mobile nodes’ velocity [26, 27]. The request zone in LBM
is not designed for limiting the route discovery flooding,
but for data packet transmission [28]. Most of the nodes
in WSNHA are static, so the shape of the request zone can
derive from the definition in LAR, DREAM, and LBM, but
the calculation of the request zone should be appropriate to
the task.
3.2. Self-Adaptation of the Request Zone. In general, the
smaller the space to be searched is, the smaller the routing
overhead and broadcast storm will be. However, too small
request zone can lead to no or unstable routing in the request
zone, even though a stable route exists outside the request
zone. We call this “holes in the request zone.” If the request
zone has holes, route discovery is likely to be done multiple
times, which in turn increases the routing overhead and
the route setup time. Expanding the request zone to the
entire network when route discovery fails rapidly degrades
performance and loses the benefits of an algorithm based on
a confined request zone. In addition, expanding the request
zone can lead to broadcast storm on the MAC layer and a
decrease in the packet delivery ratio. In order for the routing
algorithm to meet a relatively high packet delivery ratio while
minimizing the size of request zone, which also minimizes
the routing overhead, the sensor nodes need to automatically
adjust the size of the request zone according to the network
state.
4 EURASIP Journal on Embedded Systems
Input: RREQ, X
0
Result: how to deal with RREQ
Establish a reverse link to the node from which it
received RREQ
If RREQ received before then
discard RREQ;
else
if RREQ.destination
==X
0
then
respond with RREP using the reverse link;
else
if RREQ.destination is the X
0
’s neighbor then
forward RREQ to RREQ.destination;
else
if X
0
∈ Rzone then
if X
0
is static then broadcast RREQ;
else
discard RREQ;
end
end
end
end
Algorithm 1: recvRREQ.
This paper focuses on the above problems to develop
a routing algorithm that can meet WSNHA requirements
while minimizing the routing overhead.
4. Routing Algorithm
In AODVjr routing, when a source node S has data to send to
a destination node D but has no existing route to the desti-
nation, it initiates a route discovery process by broadcasting
a route request packet (RREQ). An intermediate node, upon
receiving the RREQ for the first time, will rebroadcast the
RREQ again if it does not know a route to D. When the
RREQ reaches a node that has a route to D (which may be
the destination node D itself), a route reply packet (RREP)
is sent back to S. When S receives the RREP, it inserts the
routing information about D into its routing table and uses
this routing information to send data to D.
Instead of blindly searching for the route in the entire
network, WSNHA-LBAR uses the location information of
the sensor nodes to confine the flooding route searching
space to a smaller estimated request zone (Rzone), which
represents the route-searched zone.
4.1. Location-Based Route Discovery. When the Rzone is
defined, the addresses of the source node and the destination
node are stored in the RREQ. Each intermediate node X
0
receives an RREQ and then executes the recvRREQ algorithm
of WSNHA-LBAR to forward the RREQ as Algorithm 1
shows.
In recvRREQ algorithm, the static nodes located in the
Rzone are responsible for rebroadcasting an RREQ, but
the static nodes outside the Rzone are not responsible for
rebroadcasting a RREQ. If a mobile node receives an RREQ
and it is not the destination node, it discards the RREQ
directly because a route that uses the mobile node as its
intermediate node is not stable.
In WSNHA-LBAR, careful choice of the proper Rzone
can reduce the number of broadcast RREQs and save
bandwidth and energy. So the definition of the Rzone
directly influences the performance of WSNHA-LBAR.
Because WSNHA is intended for coverage of a small area, a
rectangular Rzone does not reduce the routing overhead. If
the source and destination nodes are located at the edges of
WSNHA, a rectangular Rzone is easily degraded to flooding
in the entire network [29]. A fan-shaped Rzone is too
narrow for WSNHA and does not include enough nodes to
find a route, and it therefore easily leads to the failure of
route discovery [29]. In the following, we will introduce the
definition of the Rzone and judge whether the sensor nodes
are located in the Rzone.
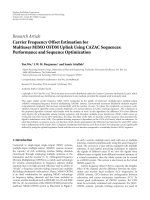
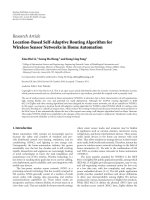
In Figure 1, consider node S that needs to find a route
to D. If no valid path to D exists in the routing table of S, S
initiates route discovery to find one. Before route discovery,
S can establish an Rzone between S and D. A sphere with S
as its center and radius r describes the transmission range
of the radio signal; the transmission range of every node is
assumed to be the same. The Rzone is a cylindrical zone,
shown as the red dotted line in Figure 1, where it is assumed
that the coordinates of X
0
, S,andD are (x
0
, y
0
, z
0
), (x
s
, y
s
, z
s
)
and (x
d
, y
d
, z
d
), respectively. The distance between X
0
and the
line SD is h. The condition for determining whether X
0
is
located in the Rzone is 0
≤ h ≤ r.
The calculation of h proceeds as follows. Suppose that the
equation of a straight line L(S, D)is
A
1
x + B
1
y + C
1
z + D
1
= 0,
A
2
x + B
2
y + C
2
z + D
2
= 0,
(1)
where A
1
, B
1
, C
1
, D
1
, A
2
, B
2
, C
2
,andD
2
are constants that
can be computed from the coordinates of S and D:
A
1
= 1, A
2
= 1,
B
1
=−
x
d
− x
s
y
d
− y
s
+1
, B
2
=−1,
C
1
=
y
d
− y
s
z
d
− z
s
, C
2
=
y
d
− y
s
z
d
− z
s
−
x
d
− x
s
z
d
− z
s
,
D
1
=−B
1
y
s
− x
s
− C
1
z
s
, D
2
=−C
2
z
s
− x
s
− y
s
.
(2)
We can defin e
T
1
= A
1
x
0
+ B
1
y
0
+ C
1
z
0
+ D
1
,
T
2
= A
2
x
0
+ B
2
y
0
+ C
2
z
0
+ D
2
,
(3)
EURASIP Journal on Embedded Systems 5
Y
(x
0
, y
0
, z
0
)
X
0
S
r
(x
s
, y
s
, z
s
)
Z
(x
d
, y
d
, z
d
)
D
X
Nodes in WSNHA
h
Figure 1: Request zone in WSNHA-LBAR.
and h can be expressed as
h
=
T
1
n
2
− T
2
n
1
n
1
×
n
2
,
(4)
where vector
n
i
= (A
i
, B
i
, C
i
), i = 1, 2, and × is the vector
cross product.
4.2. Self-Adaptation of the Request Zone. Two cases may lead
to a low packet delivery ratio in WSNHA-LBAR. The first
is when no route from S to D is available in the current
cylindrical Rzone. In this case, we need to increase the radius
of the cylindrical Rzone. The second case involves a heavy
collision in the MAC layer, which leads to failure of data
packet transmission. In this case, we decrease the radius of
the Rzone, as a smaller route-searching space reduces the
chance of collision problems in MAC 802.15.4. Furthermore,
source-destination pairing in WSNHA is random. If we
define the same radius of the Rzone for every source-
destination pair, the performance of location-based route
discovery cannot reach the optimum because different
source-destination pairs maybe subject to different network
problems (such as link instability, environment disturbance,
and heavy collision in the MAC layer). It is very difficult for
the engineer to define the proper radius of the Rzone for
every source-destination pair. We proposed a self-adaptive
algorithm for the request zone based on Bayes’ theorem,
which lets the nodes automatically adjust the radius of the
Rzone by self-learning.
To realize the automatic adjustment of the radius of the
Rzone by self-learning, we need to solve the following two
problems.
(i) What kind of information/knowledge the sensor
node can learn from route finding?
(ii) How to make full use of the knowledge (the sensor
node have learnt) to automatically adjust the radius
of cylinder zone?
We can view the number of retransmissions of RREQs
as knowledge, which the sensor nodes can learn because
the source node will retransmit RREQ when the source
node does not receive the RREP. Retransmission of the
RREQ implies that the current radius of the Rzone is
improper and should be modified. So, we can view successful
transmission as receiving an RREP when flooding RREQ in
the current Rzone. In a similar way, we can view unsuccessful
transmission as not receiving an RREP when flooding RREQ
in the current Rzone. The self-learning of the sensor node
occurs as it counts the number of successful and unsuccessful
transmissions and calculates the probability of successful
transmission for different Rzone radii. The sensor node
chooses the Rzone radius that corresponds to the highest
probability of receiving an RREP.
The above self-learning process can be realized by Bayes’
theorem.
4.2.1. Bayes’ Theorem. Bayes’ theorem [30] shows the way
in which conditional probability depends on its inverse. The
theorem expresses the posterior probability of a hypothesis
A in terms of the prior probabilities of A and B and the
probability of B given A. It implies that evidence has a
stronger confirming effect if it was more unlikely before
being observed. Bayes’ theorem relates the conditional and
marginal probabilities of events A and B, and it is expressed
as
P
(
A
| B
)
=
P
(
B | A
)
P
(
A
)
P
(
B | A
)
P
(
A
)
+ P
B | A
P
A
,
(5)
where
A is the complementary event of A,andP(A) is the
prior probability or marginal probability of A. It is “prior” in
the sense that it does not take into account any information
about B. P(A
| B) is the conditional probability of A,givenB.
It is also called the posterior probability because it is derived
from or depends upon the specified value of B. P(B
| A)
is the conditional probability of B given A. P(B) is also the
prior probability or marginal probability of B.Intuitively,
Bayes’ theorem describes the way in which one’s beliefs about
observing “A” are updated by having observed “B”. It implies
that evidence has a stronger confirming effect if it was more
unlikely before being observed. Bayes’ theorem is one of the
most important theories in machine learning. Derived from
conditional probabilities, we can rewrite Bayes’ theorem as
P
(
A
| B
)
=
P
(
A ∩ B
)
P
(
A ∩ B
)
+ P
A ∩ B
.
(6)
4.2.2. Mapping Relationships between Bayes’ Theorem and
Self-Adaptation of the Request Zone. Let P(A) be the prior
probability of successful transmission and let P(
A) be the
prior probability of unsuccessful transmission. P(R
| A)
is the conditional probability that the radius of cylindrical
Rzone is R when we have successful transmission. P(A
∩ R)
is the probability that the radius of cylindrical Rzone is R
and route discovery is successful. P(
A ∩ R) is the probability
that the radius of cylindrical Rzone is R and route discovery
6 EURASIP Journal on Embedded Systems
Table 1: The main datastructures: tables and counters.
Table name Function Field name Description
Failure
Records the number of
unsuccessful transmission under
the condition of the different R
R Represents the possible radius of cylindrical Rzone
Count
Represents the total number of unsuccessful transmission
under the condition of the corresponding R
Success
Records the number of successful
transmission under the
condition of the different R
R Represents the possible radius of cylindrical Rzone
Count
Represents the total number of unsuccessful transmission
under the condition of the corresponding R
R Represents the possible radius of cylindrical Rzone
Probability
Records the probability of
successful transmission under
the condition of the different R
Probability
Represents the probability of successful transmission under
the condition of the corresponding R
Tr y
Represents whether the value of the corresponding R is tested
or not. If the R is tried but the sensor node does not receive
the RREP, this field of the corresponding R is set to 1;
otherwise it is set to 0
Counter name
Function
Failure sum
Represents the total number of unsuccessful transmission
Success sum
Represents the total number of successful transmission
is unsuccessful. The conditional probability of successful
transmission when the radius of the Rzone is R is given by
P
(
A
| R
)
=
P
(
A ∩ R
)
P
(
A ∩ R
)
+ P
A ∩ R
.
(7)
4.2.3. Realization of Self-Adaptation of the Request Zone
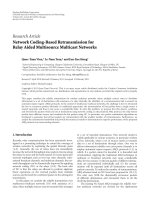
Data Structures for Realization. We create three tables and
two counters for the realization of self-adaptation of cylin-
drical Rzone based on Bayes’ theorem. The functions and
descriptions of these data structures are given in Ta bl e 1 .
Here, failure, success, failure
sum,andsuccess sum are used
to calculate the prior probability, and probability is used to
store the posterior probability.
Before we described the detailed computation, we gave
the following nomenclature.
(i) failure (R
i
).count: it denotes the total number of
unsuccessful transmissions when the radius of cylindrical
Rzone is R
i
, which can be found in table f ailure.
(ii) failure (R
i
).count: it denotes the total number of
successful transmissions when the radius of cylindrical
Rzone is R
i
, which can be found in table success.
The detailed computation is as follows. P(
A∩R)iscalcu-
lated from
P
A ∩ R
i
=
failure
(
R
i
)
.count
failure sum
,
(8)
where f ailure(R
i
).count is the total number of unsuccessful
transmissions when R
= R
i
, which can be found in table
f ailure. P(A
∩ R) is calculated from
P
(
A
∩ R
i
)
=
success
(
R
i
)
.count
success sum
,
(9)
where success(R
i
).count is the total number of successful
transmissions when R
= R
i
, which can be found in table
success.
Ta bl e probability is used to store the value of P(A
| R
i
),
which can be calculated by (7), (8), and (9). P(A
| R
i
) is the
conditional probability of successful transmission when the
radius of the cylindrical Rzone is R
i
. P(A | R
i
) is calculated
from
P
(
A
| R
i
)
=
P
(
A ∩ R
i
)
P
(
A ∩ R
i
)
+ P
A ∩ R
i
.
(10)
A schematic diagram detailing the calculation is shown
in Figure 2.
Algorithms for Realization. We modify the location-based
routing to realize self-adaptation of the cylindrical Rzone.
Two functions must be modified: the sendRREQfunction
and the recvRREP function.
Before we analyzed these two revised functions, we gave
the following nomenclature.
(i) req
cnt: it denotes the number of RREQ retransmis-
sion.
optimal
region: it denotes the optimal R.
(ii) max: it denotes the max probability.
probability(R
i
).probability: it denotes the probability of
successful transmission when the radius of cylindrical Rzone
is R
i
, which can be found in table probability.
(iii) probability(R
i
).tr y: it denotes whether the value of
R
i
is tested or not when the radius of cylindrical Rzone is R
i
,
which can be found in table probability. When the sensor
node sends RREQ for rout finding but it did not receive
RREP, it will use another value as the radius of cylindrical
Rzone to retransmit RREQ. In order to avoid using the same
value as the last time, we marked field try of the used value
as “1”. Once the sensor node receives RREP, the sensor node
will reset field try of all the possible radius value to “0”.
(iv) pre
region: it denotes the last time radius of the
cylindrical Rzone.
EURASIP Journal on Embedded Systems 7
Prior probability
Failure
R Count
R
0
0
··· ···
R
1
0
Failure sum
Success
R Count
R
0
0
R
1
0
··· ···
Success sum
P(A ∩ R
i
)
=
failure record(R
i
).count
failure sum
P(A
∩ R
i
)
=
success record(R
i
).count
success sum
Bayes’
theorem
Bayes’
theorem
Posterior probability
Probability
Probability
R
R
0
R
1
···
Tr y
0
0
···
P(A | R
i
) =
P(A ∩ R
i
)
P(A ∩ R
i
)+P(A ∩ R
i
)
Figure 2: Realization of Bayes calculation.
Firstly, we analyze sendRREQ. Before the sensor node
broadcasts an RREQ for route finding, it must choose
the optimal R according to the table probability. Initially,
probability is empty, and the sensor node does not know
which R is the optimum value; so we set the transmission
radius of the sensor node as the initial radius of Rzone, which
means that the initial value of R equals to the maximum
range of transmission of a sender node. Later, as long as the
sensor node does not receive an RREP, it will retransmit an
RREQ. In other words, the last time radius of the cylindrical
Rzone is invalid for route finding. Before the retransmission
of an RREQ, the sensor node must update field count of
corresponding pre
region in table failure and update field
probability and try of corresponding pre
region in table
probability. So the sensor node sets the field count of the
previous R to add 1 in table failure, and at the same time, the
sensor node increases the f ailure
sum by 1. Then, the sensor
node uses (10) to recalculate the table probability and set try
for the previous R to1inprobability. When it retransmits
an RREQ, it can choose the R whose probability is highest
or one that has not been previously used (the field “try” is
initially set to 0, representing the fact that this value of R
has not been used, and it is reset to 1 when this R value is
used). This algorithm is shown in Algorithm 2, where the
pre
region represents the previous R,andreq cnt represents
the number of RREQ retransmissions.
Second, we analyze the function recvRREP. This algo-
rithm is shown in Algorithm 3. When the sensor node
successfully receives an RREP, it needs to record this suc-
cessful transmission using current radius value and modify
its success table. Because the current radius value has already
been recorded by pre
region, so the sensor node adds 1 to
pre
region in table success, and at the same time, the sensor
node also increases successs
sum by 1. Then, the sensor node
uses (10) to recalculate table probability and sets try for all R
valuesto0intableprobability.
Parameters in the Algorithm. In this algorithm, we dynam-
ically create the tables to calculate the probability of suc-
cessful transmission under the condition of the different R.
Dynamic creation of those tables depends on two parameters
search
step, which represents the grain size about the change
of the Rzone, and R
ini
, which represents the initial radius
of the Rzone. It is hard to judge that the failure of RREQ
transmission is due to either the collision in MAC layer
or the disconnection in Rzone; so we adopt R
ini
as the
center and try the decrease and increase of R
ini
by the equal
probability. Assume that the longest distance of the house
is L
max
. Using these two parameters, the above three tables
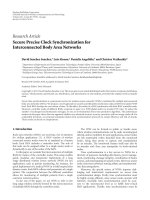
can be dynamically created. We create the values of R in the
following order:
R
ini
,
R
ini
− search step,
R
ini
+ search step,
.
.
.
R
ini
− i × search step,
R
ini
+ i × search step,
.
.
.
(11)
where R
ini
− i × search step > 0andR
ini
+ i × search step <
L
max
. Figure 4 showed the structures of three tables when
R
ini
= 10 and search step = 2.
Generally, we choose the transmission region of the
sensor node as the initial radius. These two parameters
can be decided by the engineer. If search
step is increased
(or decreased), the variation of the Rzone is increased (or
decreased), the accuracy of the adjustment is decreased (or
increased), and the size of the three tables is decreased (or
increased). The size of table depends on the search
step and
the area of the house. Because the coverage of WSNHA is
not big, the storage of those tables does not consume much
memory.
5. Performance Evaluation
In order to evaluate the performance characteristics of
the WSNHA-LBAR protocol, we developed the simulation
8 EURASIP Journal on Embedded Systems
Input: failure, success, probability, failure sum
Input: success
sum, pre region, req cnt
/ initialize the max probability to 0 /
max
= 0;
optimal region = 0;
/ First time to send RREQ /
if req
cnt == 0 then
/ Choose the optimal R /
foreach R
i
in probability do
if (probability(R
i
).try! = 1)
&&(probability(R
i
).probability > max) then
max = probability(R
i
).probability;
optimal
region = probability(R
i
).R;
end
/ Table probability is empty /
if max
== 0 then
foreach R
i
in probability do
if (probability(R
i
).try! = 1)
&&(probability(R
i
).probability == 0) then
optimal
region = probability(R
i
).R;
break;
end
end
/ Retransmit RREQ /
else
/ Update table probability and failure /
foreach R
i
in probability do
if probability(R
i
).R == pre region then
probability(R
i
).try = 1;
end
foreach R
i
in failure do
if failure(R
i
).R == pre region then
failure(R
i
).count ++;
end
failure
sum ++;
/ Recalculate the probability /
foreach R
i
in probability do
Probability(R
i
).probability
=
success(R
i
).count
success sum
success(R
i
).count
success sum
+
f ailure(R
i
).count
f ailure sum
end
/ Choose the new optimal R /
foreach R
i
in probability do
if (probability(R
i
).try! = 1)
&&(probability(R
i
).probability > max) then
max = probability(R
i
).probability;
optimal
region = probability(R
i
).R;
end
if maxprobability
== 0 then
foreach R
i
in probability do
if (probability(R
i
).try! = 1)
&&(probability(R
i
).probability == 0) then
optimal
region = probability(R
i
).R;
break;
end
end
end
RREQ.region = optimal
region;
pre
region = optimal region;
send RREQ;
Algorithm 2: sendRREQ.
Input: failure, success, probability, failure sum
Input: success
sum, pre region, req cnt, RREP
/ If RREP for me, update table success /
foreach R
i
in success do
if (success(R
i
).R == pre region) then
success(R
i
).count ++;
end
success
sum ++;
/ Recalculate the probability /
foreach R
i
in probability do
probability(R
i
).probability
=
success(R
i
).count
success sum
success(R
i
).count
success sum
+
f ailure(R
i
).count
f ailure sum
probability(R
i
).try = 0;
end
free RREP;
Algorithm 3: recvRREP.
R
R
ini
R
ini
− search step
R
ini
+searchstep
R
ini
− 2 × search step
R
ini
+2× search step
···
R
ini
= 10
Search
step = 2
Failure Success Probability
R Count R Count R Probability Try
10
···
···
···
···
···
···
···
···
8
12
6
14
4
16
2
8
12
6
14
4
16
2
10
···
···
···
···
···
···
···
···
10
8
12
6
14
4
16
2
···
···
···
···
···
···
···
···
···
···
···
···
···
···
···
···
Figure 3: Dynamic creation of the tables.
model using the NS2 simulation tool [31]. Our goal in
conducting this evaluation study is to find the advantages of
WSNHA-LBAR by comparing the performance of WSNHA-
LBAR with other wireless routing protocols. As we know,
the popular standard for WSN application is the ZigBee
specification. The network layer of ZigBee supports AODVjr
routing. So in evaluation study, we used NS2 to compare the
EURASIP Journal on Embedded Systems 9
performance of WSNHA-LBAR and AODVjr. In addition,
in order to find advantages of self-adaptation scheme
in WSNHA-LBAR, we also compare the performance of
WSNHA-LBAR and LAR in which the cylindrical zone is
used as the request zone.
5.1. Performance Measurement. We cho os e four met ri cs f or
analyzing the performance of WSNHA-LBAR and AODVjr.
5.1.1. Packet Delivery Ratio. This is the ratio of the number
of data packets received to the number originally sent. This
metric indicates the reliability of the routing protocol.
5.1.2. Routing Overhead. This is the number of routing
command packets. This metric reflects how much bandwidth
is occupied by the routing command packets.
5.1.3. Average Packet Delay. This is the average one-way
latency for successfully transmitting a packet from the source
to the destination. It reflects the response time of the routing
protocol.
5.1.4. Residual Energy Ratio. This is the ratio of the residual
energy to the initial energy in the network. It reflects the
energy efficiency in the network.
5.2. Simulation Parameters. Apart from the routing algo-
rithm, there are many factors which can influence the final
simulation results such as the number of static nodes and
mobile nodes, the velocity of the mobile nodes, and the rate
of sending packets in application layer. In order to make the
simulation environment close to the HA, we consider the
following four parameters.
5.2.1. The Number of Mobile Nodes. Generally, there are
small number of mobile nodes in WSNHA application; so we
do not need to focus on highly mobile nodes. On the other
hand, the MAC lay of WSNHA is MAC 802.15.4 [32]which
is not suitable for high-mobility network [3–5, 33].
5.2.2. Transmission Range. The transmission range is deter-
mined by the characteristics of wireless channel in WSNHA
environment and the parameters of the development board
we used in HA.
5.2.3. The Rate of Sending Packets. The MAC lay of WSNHA
is MAC802.15.4. It has the characteristic of low data
throughput application, low power, and low cost. In general,
MAC 802.15.4 maintains a high packet delivery ratio for
application traffic up to 1 packet per second(pps), but the
value decreases quickly as traffic load increases [34–36].
5.2.4. The Size of Packet. On the one hand, application
packet size is not very big in most WSNHA applications.
On the other hand, application packet size depends on
the specification of IEEE802.15.4 since its maximal MAC
frame size is 102 bytes. In addition, we must consider
Table 2: Parameters used in simulation.
Parameter
Val ue
MAC protocol
IEEE 802.15.4
Radio propagation model
Two-ray ground reflection model
Initial energy of the node
3 Joules
Transmitting power of the
node
0.031 Watts
Receiving power of the
node
0.035 Watts
Sleeping consumption
power of the node
0.000712 Watts
Signal propagation radius
10 meters
Tr affictype
Constant Bit Rate (CBR)
Packet size
70 Bytes
Data interval
1second
Velocity of the mobile node
0.5 meter per second
Simulation time
1000 second
R
ini
10 meters
search
step
2meters
the application overhead in application layer and routing
overhead in network layer; so in most NS2 simulation,
application packet size belongs to the range of 35 bytes to
90 bytes.
In summary, we use the simulation parameters shown in
Ta bl e 2 to design the simulation scenarios according to the
specific application scenarios in WSNHA.
5.3. Design of Simulation Scenarios. We designed five groups
of simulation scenarios according to the HA application.
In each group, the basic simulation parameters shown in
Ta bl e 2 are the same.
5.3.1. The First Group of Simulation Scenarios. In this group
simulation scenarios, we fixed the network workload, the
number of the mobile nodes, and sensor field size in all sim-
ulation scenarios and study the performance measurements
as a function of amount of sensor nodes.
Considering that there are few mobile nodes in WSNHA,
the number of mobile nodes was limited to 2 in this group
of simulation scenarios. Three source/destination pairs were
randomly selected from the sensors deployed in a 50m by
50 m square sensor field. As the size of sensor field was not
changed, we gradually increased the number of nodes in the
network. The number of sensor nodes was increased from
100 to 200 nodes with an increment interval of 50 nodes.
5.3.2. The Second Group of Simulation Scenarios. In this
group of simulation scenarios, we fixed the number of
sensor nodes, the number of mobile nodes, and sensor field
size in all simulation scenarios and study the performance
measurements as a function of the network workload.
The sensor field in this group of simulation scenarios is
50
× 50m containing 100 nodes. The number of mobile
nodes was limited to 2. The number of source/destination
10 EURASIP Journal on Embedded Systems
pairs was increased from 1 to 4 with an increment interval of
1pair.
5.3.3. The Third Group of Simulation Scenarios. In this group
simulation scenarios, we fixed the number of sensor nodes,
the network load, and sensor field size in all simulation
scenarios and study the performance measurements as a
function of the number of mobile nodes.
The sensor field in this group of simulation scenar-
iosis50
× 50 m containing 100 nodes. The number of
source/destionation pairs was limited to 3. The number of
mobile nodes was increased from 1 to 4 with an increment
interval of 1 mobile node.
5.3.4. The Fourth Group of Simulation Scenarios. In this
group of simulation scenarios, we fixed the network work-
load and network density in all simulation scenarios and
study the performance measurements as a function of sensor
nodes number and sensor field size. In other words, we
analyzed the performance of AODVjr, LAR, and WSNHA-
LBAR in different network coverage. We design this kind of
simulation scenarios because the macroscopic connectivity
of a sensor field is a function of the average density. If we
had kept the sensor field area constant but increased network
size, we might have observed performance effects not only
due to the larger number of nodes but also due to increased
connectivity.
In order to approximately keep the average density of
the sensor nodes constant, we designed three simulation
scenarios with sensor field dimensions of 20
× 20, 50 ×
50, and 80 × 80 m, containing 16, 100, and 256 nodes,
respectively. In all simulation scenarios, the number of
mobile nodes was limited to 2, and 3 source/destination pairs
were randomly selected from the sensors deployed in the
sensor fields.
5.3.5. The Fifth Group of Simulation Scenarios. The fifth
group of simulation scenarios came from the operational
testbed in our HA model. According to the specific applica-
tion scenarios in this HA model, we design three simulation
scenarios with sensor field dimensions of 16
× 6, 16 × 9, and
16
× 12 m, containing 20, 30, and 40 nodes, respectively. In
all simulation scenarios, the number of mobile nodes was
limited to 1, and 1 source/destination pair was randomly
selected from the sensors deployed in the sensor fields.
5.4. Simulation Results and Analysis
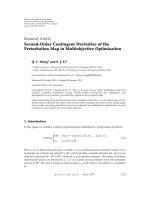
5.4.1. The First Group of Simulation Results. Figure 4 shows
packet delivery ratios achieved using WSNHA-LBAR, LAR
and AODVjr in three scenarios for the first group of
simulations. The packet delivery ratios of the three routing
algorithms decreased as the number of nodes increased,
because this leads to heavy contention in the MAC layer.
The packet delivery ratios of the WSNHA-LBAR and LAR
were higher than those of AODVjr in all scenarios because
the cylindrical Rzone reduced the routing overhead, which
in turn reduced the burden on the MAC layer. The packet
60
64
68
72
76
80
84
88
92
96
100
Packet delivery ratio (%)
Scenario 1 Scenario 2 Scenario 3
The number of nodes
WSNHA-LBAR
LAR
AODVjr
Figure 4: Comparison of packet delivery ratio by using WSNHA-
LBAR, LAR, and AODVjr in Scenario 1 with 100 nodes, Scenario 2
with 150 nodes, and Scenario 3 with 200 nodes.
delivery ratio of the WSNHA-LBAR was higher than that of
LAR in all scenarios because WSNHA-LBAR is a self-learning
algorithm which lets the sensor node automatically get the
optimal R by learning the number of the retransmission.
WSNHA-LBAR is more flexible than LAR.
Ta bl e 3 lists the measurement results of the four per-
formance metrics for WSNHA-LBAR, LAR, and AODVjr
in different scenarios. The performance for overhead of
WSNHA-LBAR and LAR was better than that of AODVjr
when WSNHA-LBAR and LAR maintained a high packet
delivery ratio. However, the performance for packetaverage
delay of LAR and AODVjr was better than that of WSNHA-
LBAR because automatic self-learning in WSNHA-LBAR
is exchanged by the decrease of performance for packet
average delay. The performance for overhead of WSNHA-
LBAR and LAR is very close, and the performance for
residual energ y ratio of three routing algorithms is very
close.
5.4.2. The Second Simulation. Figure 5 shows packet delivery
ratios achieved using WSNHA-LBAR, LAR, and AODVjr
in three scenarios for the second group of simulations.
The packet delivery ratios of the three routing algo-
rithms decreased as the number of source/destination pairs
increased, because increasing source/destination communi-
cation leads to heavy traffic and collision in the MAC layer.
The packet delivery ratios of the WSNHA-LBAR and LAR
were higher than those of AODVjr in all scenarios because
the cylindrical Rzone reduced the routing overhead, which
in turn reduced the burden on the MAC layer. The packet
delivery ratio of the WSNHA-LBAR was higher than that
EURASIP Journal on Embedded Systems 11
Table 3: Performance comparison in different scenarios: WSNHA-
LBAR (abbreviated by LBAR) versus LAR versus AODVjr.
Packet
delivery
ratio (%)
Residual
energy
ratio (%)
Routing
over-
head
Packet
average
delay (s)
Scenario 1
LBAR 93.16 81.14 2855 0.056528
LAR 90.20 81.67 2817 0.037353
AODVjr 87.75 81.47 3068 0.032544
Scenario 2
LBAR 87.91 82.02 2794 0.088583
LAR 86.87 81.73 2911 0.056940
AODVjr 82.01 82.37 3172 0.098966
Scenario 3
LBAR 86.53 82.30 2931 0.122545
LAR 81.59 83.00 3042 0.086083
AODVjr 71.31 83.51 3922 0.243504
60
64
68
72
76
80
84
88
92
96
100
Packet delivery ratio (%)
Scenario 1
Scenario 2 Scenario 3
Scenario 4
The number of source/destination pair
WSNHA-LBAR
LAR
AODVjr
Figure 5: Comparison of packet delivery ratio by using WSNHA-
LBAR, LAR, and AODVjr in Scenario 1 with 1 pair of
source/destionation, Scenario 2 with 2 pair of source/destination,
Scenario 3 with 3 pairs of source/destination, and Scenario 4 with 4
pairs of source/destination.
of LAR in all scenarios because WSNHA-LBAR is a self-
adaptive and it can decrease the flooding of the Rzone when
traffic is heavy.
Ta bl e 4 lists the measurement results of the four per-
formance metrics for WSNHA-LBAR, LAR, and AODVjr
in different scenarios. The performances for overhead of
WSNHA-LBAR and LAR was better than that of AODVjr
when WSNHA-LBAR and LAR maintained a high packet
delivery ratio. However, the performance for packet average
delay of LAR and AODVjr was better than that of WSNHA-
LBAR because automatic self-learning in WSNHA-LBAR is
exchanged by the decrease of performance for packet aver-
agedelay. The performance for overhead of WSNHA-LBAR
Table 4: Performance comparison in different scenarios: WSNHA-
LBAR (abbreviated by LBAR) versus LAR versus AODVjr.
Packet
delivery
ratio (%)
Residual
energy
ratio (%)
Routing
over-
head
Packet
average
delay (s)
Scenario 1
LBAR 98.82 90.23 1046 0.045630
LAR 98.75 90.20 1050 0.042391
AODVjr 94.26 90.36 1097 0.227145
Scenario 2
LBAR 95.65 84.43 1984 0.050955
LAR 95.37 84.56 1982 0.028148
AODVjr 90.13 84.53 2116 0.030712
Scenario 3
LBAR 93.16 81.14 2855 0.056528
LAR 90.20 81.67 2817 0.037353
AODVjr 87.75 81.47 3068 0.032544
Scenario 4
LBAR 91.13 77.92 3647 0.053301
LAR 89.94 78.07 3721 0.040214
AODVjr 85.15 77.61 3952 0.033034
and LAR is very close, and the performance for residual
energy ratio of three routing algorithms is very close.
5.4.3. The Third Simulation. Figure 6 shows packet delivery
ratios achieved using WSNHA-LBAR, LAR, and AODVjr in
three scenarios for the third group of simulations. MAC
802.15.4 is not designed for a mobile network, and it cannot
guarantee reliable transmission when the network topology
is frequently changed. The packet delivery ratios of the three
routing algorithms decrease as the number of mobile nodes
increases. However, the packet delivery ratio of WSNHA-
LBAR was higher than that of LAR and AODVjr because
WSNHA-LBAR is self-adaptive and it can automatically
adjust the Rzone when the network topology changes.
Ta bl e 5 lists the measurement results of the four per-
formance metrics for WSNHA-LBAR, LAR, and AODVjr
in different scenarios. The performance for overhead of
WSNHA-LBAR and LAR was better than that of AODVjr
when WSNHA-LBAR and LAR maintained a high packet
delivery ratio. However, the performance for packet average
delay of LAR and AODVjr was better than that of WSNHA-
LBAR because automatic self-learning in WSNHA-LBAR is
exchanged by the decrease of performance for packet average
delay. The performance for overhead of WSNHA-LBAR and
LAR is very close, and the performance for residual energy
ratio of three routing algorithms is very close.
5.4.4. The Fourth Simulation. Figure 7 shows packet delivery
ratios achieved using WSNHA-LBAR, LAR, and AODVjr
in three scenarios for the fourth group of simulations.
The packet delivery ratios of the three routing algorithms
decreased as the network coverage and the number of
nodes increased, because this leads to heavy contention and
collision in the MAC layer. The packet delivery ratio of the
WSNHA-LBAR and LAR was higher than that of AODVjr
in all scenarios because the cylindrical Rzone reduced the
routing overhead, which in turn reduced the burden on
12 EURASIP Journal on Embedded Systems
60
64
68
72
76
80
84
88
92
96
100
Packet delivery ratio (%)
Scenario 1
Scenario 2 Scenario 3
Scenario 4
Thenumberofmobilenodes
WSNHA-LBAR
LAR
AODVjr
Figure 6: Comparison of packet delivery ratio by using WSNHA-
LBAR, LAR, and AODVjr in Scenario 1 with 1 mobile node,
Scenario 2 with 2 mobile nodes, Scenario 3 with 3 mobile nodes,
and Scenario 4 with 4 mobile nodes.
Table 5: Performance comparison in different scenarios: WSNHA-
LBAR (abbreviated by LBAR) versus LAR versus AODVjr.
Packet
delivery
ratio (%)
Residual
energy
ratio (%)
Routing
over-
head
Packet
average
delay (s)
Scenario 1
LBAR 94.35 80.76 2814 0.040136
LAR 92.32 81.29 2858 0.037440
AODVjr 88.08 81.19 2989 0.033575
Scenario 2
LBAR 93.16 81.14 2855 0.056528
LAR 90.20 81.67 2817 0.037353
AODVjr 87.75 81.47 3068 0.032544
Scenario 3
LBAR 91.12 81.12 2743 0.054299
LAR 89.68 81.59 2770 0.034033
AODVjr 87.55 81.07 3043 0.029594
Scenario 4
LBAR 90.76 81.46 2715 0.052759
LAR 89.63 81.49 2786 0.029624
AODVjr 87.06 81.37 3062 0.046035
the MAC layer. The packet delivery ratio of the WSNHA-
LBAR was higher than that of LAR in all scenarios because
WSNHA-LBAR is a self-adaptive which results in greater
tolerance for changes of the network state.
Ta bl e 6 lists the measurement results of the four per-
formance metrics for WSNHA-LBAR, LAR, and AODVjr in
different scenarios. We can finds when their performance for
packet delivery ratio is very close, their performance for packet
average delay is very close. The performances for overhead of
WSNHA-LBAR and LAR is very close, and the performances
for residual energy ratio of three routing algorithms are very
close.
60
64
68
72
76
80
84
88
92
96
100
Packet delivery ratio (%)
Scenario 1
Scenario 2 Scenario 3
WSNHA-LBAR
LAR
AODVjr
Figure 7: Comparison of packet delivery ratio by using WSNHA-
LBAR, LAR, and AODVjr in Scenario 1, Scenario 2, and Scenario
3.
Table 6: Performance comparison in different scenarios: WSNHA-
LBAR (abbreviated by LBAR) versus LAR versus AODVjr.
Packet
delivery
ratio (%)
Residual
energy
ratio (%)
Routing
over-
head
Packet
average
delay (s)
Scenario 1
LBAR 96.39 67.12 2727 0.011821
LAR 95.61 67.11 2771 0.010357
AODVjr 95.35 66.94 2741 0.011663
Scenario 2
LBAR 93.16 81.14 2855 0.056528
LAR 90.20 81.67 2817 0.037353
AODVjr 87.75 81.47 3068 0.032544
Scenario 3
LBAR 90.57 87.69 2836 0.061318
LAR 88.88 87.57 2896 0.056214
AODVjr 86.88 87.32 3820 0.067793
5.4.5. The Fifth Simulation. Figure 8 shows packet delivery
ratios achieved using WSNHA-LBAR, LAR and AODVjr
in the three scenarios for the fifth group simulations.
The packet delivery ratios of the three routing algorithms
decreased as the network coverage and the number of
nodes increased, because this leads to heavy contention and
collision in the MAC layer. The packet delivery ratio of the
WSNHA-LBAR and LAR was higher than that of AODVjr
in all scenarios because the cylindrical Rzone reduced the
routing overhead, which in turn reduced the burden on the
MAC layer.
Ta bl e 7 lists the measurement results of the four per-
formance metrics for WSNHA-LBAR LAR and AODVjr
in different scenarios. The performance of WSNHA-LBAR
was better than that of AODVjr when WSNHA-LBAR
maintained a high packet delivery ratio. The performance of
EURASIP Journal on Embedded Systems 13
60
64
68
72
76
80
84
88
92
96
100
Packet delivery ratio (%)
Scenario 1 Scenario 2 Scenario 3
WSNHA-LBAR
LAR
AODVjr
Figure 8: Comparison of packet delivery ratio by using WSNHA-
LBAR (abbreviated by LBAR), LAR, and AODVjr in Scenario 1,
Scenario 2, and Scenario 3.
Table 7: Performance comparison in different scenarios: WSNHA-
LBAR (abbreviated by LBAR) versus LAR versus AODVjr.
Packet
delivery
ratio (%)
Residual
energy
ratio (%)
Routing
over-
head
Packet
average
delay (s)
Scenario 1
LBAR 95.00 68.54 1019 0.022267
LAR 93.99 68.42 1021 0.028298
AODVjr 89.98 68.60 1025 0.038725
Scenario 2
LBAR 92.97 68.07 1039 0.025916
LAR 85.80 68.06 1038 0.053006
AODVjr 85.80 67.91 1038 0.036515
Scenario 3
LBAR 87.00 67.91 1041 0.028365
LAR 83.37 68.13 1058 0.054592
AODVjr 79.94 68.21 1051 0.030957
WSNHA-LBAR and LAR is very close when WSNHA-LBAR
maintained a high packet delivery ratio.
From the above five groups of simulation results, we
can conclude similar characteristics. LBAR shows better
performance in packet delivery ratio and routing overhead,
but there is no big difference in residual energy ratio, and
packet average delay becomes even worse in some case.
Firstly, the packet delivery ratios of the WSNHA-LBAR
were higher than those of LAR and AODVjr in all scenarios
because the cylindrical Rzone reduced the routing overheads,
and self-learning algorithm in WSNHA-LBAR lets the sensor
node automatically get the optimal R by learning the number
of the retransmission.
Secondly, the performance for routing overhead of
WSNHA-LBAR and LAR was better than that of AODVjr
because the cylindrical Rzone reduced the RREQ transmis-
sion. There is no big difference in routing overhead between
WSNHA-LBAR and LAR because they use the same cylin-
drical Rzone in their algorithm except that WSNHA LBAR
will adjust size of the cylindrical Rzone when retransmitting
RREQ, which leads to a little difference between WSNHA-
LBAR and LAR.
Thirdly, let us analyze energy consumption in WSNHA.
Energy consumption of transmitting and receiving packets
is the main energy consumption in WSNHA. Packets can
be divided into two types. One is the command packet,
and the other is the data packet. Command packets can be
estimated by routing overhead. Data packet can be estimated
by packet delivery ratio. From the simulation results, we
can find that the performance of routing overhead among
those three routing algorithm is close; in other words, energy
consumption for command packet transmission is close. The
packet delivery ratio of WSNHA-LBAR is the highest. In
other words, WSNHA-LBAR transmitted more data packets
than LAR and AODVjr; so LBAR should consume more
energy than LAR and AODVjr. However, the difference of
residual energy ratio among these three routing algorithm
is very small. From the simulation results, we will find
that their difference does not exceed 2%. In other words,
WSNHA-LBAR maintained higher packet delivery ratio
without introducing much energy consumption.
Fourthly, let us analyze packet average delay. From the
simulation results, we can find that the performance for
packet average delay of LAR and AODVjr was better than
that of WSNHA-LBAR because automatic self-learning in
WSNHA-LBAR is exchanged by the decrease of performance
for packet average delay. The process of self-learning and
finding the optimal value consumed more time. In addition,
we did not count the delay of the packets that were not
successfully delivered in this delay analysis. The delay of those
packets is considered to be infinite. Because we neglected the
undelivered packets that have infinite delay and only counted
the packets delivered successfully, the average packet delay of
AODVjr is smaller than that of LBAR and LAR. If we count
the delay of packets that were not successfully delivered, the
difference in delay among LBAR, LAR, and AODVjr is even
larger.
6. Conclusions
We have developed a new kind of location-based self-
adaptive routing algorithm, called WSNHA-LBAR, based on
AODVjr in IEEE 802.15.4/ZigBee and WSNHA. It makes
use of location information for the sensor nodes to confine
route discovery flooding to a cylindrical request zone instead
of searching blindly for a route in the whole network. This
reduces the routing overhead and results in fewer broadcast
storm problems in the MAC layer. WSNHA-LBAR uses
a self-adaptive algorithm based on Bayes’ theorem, which
can automatically adjust the size of request zone using
self-learning to increase the probability of successful route
discovery. This results in greater tolerance for changes of the
network state and reduces the need for human intervention.
We simulated five typical groups of simulation scenarios
to compare the performance of WSNHA-LBAR LAR and
14 EURASIP Journal on Embedded Systems
AODVjr. When they have the close performance for residual
energy ratio, the results for packet delivery ratio showed that
WSNHA-LBAR performed better than LAR and AODVjr due
to the self-adaptation of Rzone. The increase of performance
of packet delivery ratio is exchanged by the decrease of per-
formance for packet average delay. The results for overhead
showed that WSNHA-LBAR and LAR performed better than
AODVjr due to using cylindrical Rzone to confine route
discovery flooding.
Acknowledgments
This work was partly supported by the GRRC program of
Gyeonggi Province, South Korea ((GRRC Hanyang 2009-
B01), Building/Home USN Technology for Smart Grid) and
a grant from the Natural Science Foundation (NSF) of
educational agency of Hubei Provin, China, under Grant
number B20071106.
References
[1] I. F. Akyildiz, W. Su, Y. Sankarasubramaniam, and E. Cayirci,
“Wireless sensor networks: a survey,” Computer Networks, vol.
38, no. 4, pp. 393–422, 2002.
[2] C. Reinisch, W. Kastner, G. Neugschwandtner, and W.
Granzer, “Wireless technologies in home and building
automation,” in Proceedings of the 5th IEEE International
Conference on Industrial Informatics (INDIN ’07), pp. 93–98,
June 2007.
[3]J.L.ZhengandM.J.Lee,Sensor Network Operations: A
Comprehensive Performance Study of IEEE 802.15.4, McGraw-
Hill, New York, NY, USA, 2006.
[4]J.Zheng,M.J.Lee,andM.Anshel,“Towardsecurelowrate
wireless personal area networks,” IEEE Transactions on Mobile
Computing, vol. 5, no. 10, pp. 1361–1373, 2006.
[5] J. S. Lee, “Performance evaluation of IEEE 802.15.4 for low-
rate wireless personal area networks,” IEEE Transactions on
Consumer Electronics, vol. 52, no. 3, pp. 742–749, 2006.
[6] ZigBee Specification, ZigBee Alliance Std. Document 053
474r17, 2007.
[7] I. D. Chakeres and K. B. Luke, “AODVjr, AODV simplified,”
Mobile Computing and Communications Review, vol. 6, no. 3,
pp. 100–101, 2002.
[8] W. Kastner, G. Neugschwandtner, S. Soucek, and H. M.
Newman, “Communication systems for building automation
and control,” Proceedings of the IEEE, vol. 93, no. 6, pp. 1178–
1203, 2005.
[9] J. N. Al-Karaki and A. E. Kamal, “Routing techniques in wire-
less sensor networks: a survey,” IEEE Wireless Communications,
vol. 11, no. 6, pp. 6–27, 2004.
[10] K. Akkaya and M. Younis, “A survey on routing protocols for
wireless sensor networks,” Ad Hoc Networks,vol.3,no.3,pp.
325–349, 2005.
[11] C. Intanagonwiwat, R. Govindan, D. Estrin, J. Heidemann,
andF.Silva,“Directeddiffusion for wireless sensor network-
ing,” IEEE/ACM Transactions on Networking,vol.11,no.1,pp.
2–16, 2003.
[12] J. Kulik, W. Heinzelman, and H. Balakrishnan, “Negotiation-
based protocols for disseminating information in wireless
sensor networks,” Wireless Networks, vol. 8, no. 2-3, pp. 169–
185, 2002.
[13] D. Braginsky and D. Estrin, “Rumor routing algorithm for
sensor networks,” in Proceedings of the 1st ACM Interna-
tional Workshop on Wireless Sensor Networks and Applications
(WSNA ’02), pp. 22–31, September 2002.
[14] C. Schurgers and M. B. Srivastava, “Energy efficient routing
in wireless sensor networks,” in Communications for Network-
Centric Operations: Creating the Information Force (Milcom
’01), vol. 1, pp. 357–361, McLean, Va, USA, October 2001.
[15] W. B. Heinzelman, A. P. Chandrakasan, and H. Balakrishnan,
“An application-specific protocol architecture for wireless
microsensor networks,” IEEE Transactions on Wireless Com-
munications, vol. 1, no. 4, pp. 660–670, 2002.
[16] S. Lindsey and C. Raghavendra, “PEGASIS: power-efficient
gathering in sensor information systems,” in Proceedings of
IEEE Aerospace Conference, vol. 3, pp. 1125–1130, 2002.
[17] A. Manjeshwar and D. P. Agarwal, “TEEN: a protocol for
enhanced efficiency in wireless sensor networks,” in Pro-
ceedings of the 1st International Workshop on Parallel and
Distributed Computing Issues in Wireless Networks and Mobile
Computing, San Francisco, Calif, USA, 2001.
[18] F. Ye, H. Luo, J. Cheng, S. Lu, and L. Zhang, “A two-tier data
dissemination model for large-scale wireless sensor networks,”
in Proceedings of the 8th Annual International Conference on
Mobile Computing and Networking (MobiCom ’02), pp. 148–
159, September 2002.
[19] Y. Yu, J. Heidemann, and D. Estrin, “Geography-informed
energy conservation for ad hoc routing,” in Proceedings of
the 7th Annual ACM/IEEE International Conference on Mobile
Computing and Networking (MobiCom ’01), pp. 70–84, Rome,
Italy, 2001.
[20] Y. Xu, D. Estrin, and R. Govindan, “Geographical and energy-
aware routing: a recursive data dissemination protocol for
wireless sensor networks,” Tech. Rep. UCLA-CSD TR-01-0023,
UCLA Computer Science Department, 2001.
[21] I. Stojmenovic, “Position-based routing in ad hoc networks,”
IEEE Communications Magazine, vol. 40, no. 7, pp. 128–134,
2002.
[22] B. Leong, New techniques for geographic routing, Ph.D. disser-
tation, Department of Electrical Engineering and Computer
Science, MIT, May 2006.
[23] B. Karp and H. T. Kung, “GPSR: greedy perimeter stateless
routing for wireless networks,” in Proceedings of the 6th Annual
International Conference on Mobile Computing and Networking
(MobiCom ’00), pp. 243–254, Boston, Mass, USA, August
2000.
[24] H. Huang, “Adaptive algorithms to mitigate inefficiency in
greedy geographical routing,” IEEE Communications Letters,
vol. 10, no. 3, pp. 150–152, 2006.
[25] W. H. Liao, J. P. Sheu, and Y. C. Tseng, “GRID: a fully
location-aware routing protocol for mobile ad hoc networks,”
Telecommunication Systems, vol. 18, no. 1–3, pp. 37–60, 2001.
[26] Y. Ko and N. H. Vaidya, “Location-aided routing in mobile ad
hoc networks,” in Proceeding of the ACM/IEEE International
Conference on Mobile Computing and Networking, pp. 66–75,
1998.
[27] S. Basagni, I. Chlamtac, and V. R. Syrotiuk, “A distance
routing effect algorithm for mobility,” in Proceeding of the
ACM/IEEE International Conference on Mobile Computing and
Networking, pp. 76–84, 1998.
[28] Y. Ko and N. H. Vaidya, “Geocasting in mobile ad hoc
networks: location-based multicast algorithm,” in Proceeding
of the 2nd IEEE Workshop on Mobile Computing Systems and
Applications, pp. 101–110, Piscataway, NJ, USA, 1999.
EURASIP Journal on Embedded Systems 15
[29] X. H. Li, H. Q. Xu, S. H. Hong, Z. Wang, and X. F. Piao,
“Routing protocol for wireless sensor networks in home
automation,” in Proceedings of the 8th IFAC International
Conference on Fieldbuses & neTworks in Industrial & Embedded
Systems (FeT ’09), Ansan, Korean, May 2009.
[30] T. M. Mitchell, Machine Learning,WileyInterScience,New
York, NY, USA, 1997.
[31] K. Fall and K. Varadhan, The ns Manual, UC Berkeley, LBL,
USC/ISI, Xerox PARC, 2009.
[32] IEEE standards 802.15.4, LAN/MAN Standards Committee of
the IEEE Computer Society, 2003.
[33] C. Chen and J. Ma, “Simulation study of AODV performance
over IEEE 802.15.4 MAC in WSN with mobile sinks,” in
Proceedings of the 21st International Conference on Advanced
Information Networking and Applications Workshops (AINAW
’07), vol. 1, pp. 159–164, Niagara Falls, Canada, May 2007.
[34] S. Støa, I. Balasingham, and T. A. Ramstad, “Data throughput
optimization in the IEEE 802.15.4 medical sensor networks,”
in Proceedings of IEEE International Symposium on Circuits and
Systems (ISCAS ’07), pp. 1361–1364, New Orleans, La, USA,
May 2007.
[35] T. Sun, L J. Chen, C C. Han, G. Yang, and M. Gerla,
“Measuring effective capacity of IEEE 802.15.4 beaconless
mode,” in Proceedings of IEEE Wireless Communications and
Networking Conference (WCNC ’06), vol. 1, pp. 493–498, Las
Vegas, Nev, USA, April 2006.
[36] J. S. Lee, “Performance evaluation of IEEE 802.15.4 for low-
rate wireless personal area networks,” IEEE Transactions on
Consumer Electronics, vol. 52, no. 3, pp. 742–749, 2006.