Báo cáo hóa học: " Application of a MANET Testbed for horizontal and vertical scenarios: performance evaluation using delay and jitter metrics" potx
Bạn đang xem bản rút gọn của tài liệu. Xem và tải ngay bản đầy đủ của tài liệu tại đây (1.03 MB, 14 trang )
RESEARCH Open Access
Application of a MANET Testbed for horizontal
and vertical scenarios: performance evaluation
using delay and jitter metrics
Masahiro Hiyama
1*
, Elis Kulla
1*
, Tetsuya Oda
1
, Makoto Ikeda
2
and Leonard Barolli
2
* Correspondence: masahiro.
;
1
Graduate School of Engineering,
Fukuoka Institute of Technology
(FIT), 3-30-1 Wajiro-Higashi, Higashi-
Ku, Fukuoka 811-0295, Japan
Full list of author information is
available at the end of the article
Abstract
Mobile ad hoc networks are attracting attention for their potential use in several
fields such as collaborative computing and communications in indoor areas. Mobility
and the absence of any fixed infrastructure make MANETs very attractive for mobility
and rescue operations and time-critical applications. Considering mobility of the
terminals, routing is a key process for operation of MANETs. In this paper, we analyze
the performance of Optimized Link State Routing protocol in an indoor environment
considering different scenarios for horizontal and vertical topologies. We evaluate the
scenarios based on delay and jitter metrics. The experimental results show that for
vertical topology the performance is affected more by mobility and number of hops,
in comparison with the horizontal topology.
Keywords: MANET, OLSR, Stairs Environment, Obstacle, Testbed
1 Introduction
A Mobile Ad hoc Network (MANET) is a group of wireless mobile terminals, which
cooperate together by routing packets to each other on a temporary network. MAN-
ETs are attracting attention for their potential use in several fields such as collaborative
computing and communications in indoor areas. Considering mobility of the terminals,
routing is a key process for operation of MANETs.
Most of the work for MANETs has been done in simulation, as in general, a simula-
tor can give a quick and inexpensive understanding of protocols and algorithms. How-
ever, experimen ts in the real world are very important to verify the simulatio n results
and to revise the models implemented in the simulator. A typical example of this
approach has revealed many aspects of IEEE 802.11, like the gray-zones effect [1],
which usually are not taken into account in standard simulators, as the well-known ns-
2 simulator.
So far, we can count a lot of simul ation results on the performance of MANET, e.g.
in terms of end-to-end throughput, delay and packetloss. However, in order to ass ess
the simulation results, real-world experiments are needed and a lot of testbeds have
been built to date [2]. The baseline criteria usually used in real-world experiments is
guaranteeing the repeatability of tests, i.e. if the system does not change along the
experiments. How to define a change in the system is not a trivial problem in
MANET, especially if the nodes are mobile.
Hiyama et al . Human-centric Computing and Information Sciences 2011, 1:3
/>© 2011 Hi yama et al; licensee Springer. This is an Open A ccess article distributed under the terms of the Creative Commons Attribution
License ( which permits unrestricte d use, distribution, and reproducti on in any medium,
provided the original work is properly cited.
There is a lot of work done on routing protocols for MANET. In [3], the authors
analyze the performance of an outdoor ad-hoc network, but their study is lim ited to
reactive protocols such as Ad hoc On Demand Distance Vector (AODV) and Dynamic
Source Routing (DSR). The authors of [4] perfo rm outdoor experiments of non stan-
dard pro-active protocols. Other ad-hoc experiments are limited to identify MAC pro-
blems, by providing insights on the one-hop MAC dynamics as shown in [5].
In [6], the authors present an experimental comparison of OLSR using the standard
hysteresis routing metric and the Expected Transmission Count (ETX) metric in a 7
by 7 grid of closely spaced Wi-Fi nodes to obtain more realistic results. The through-
put results are similar to our previous work and are effected by hop distance [7]. The
closest work to ours is that in [8]. However, the authors did not care about the routing
protocol. In [9], the disadvantage of using hysteresis routing metric is presented
through simulation and indoor measurements. Our experiments are concerned with
the interactio n of trans port protocols and routing protocol, for instance OLSR. In our
previous work [10-14], we carried out many experiments with our MANET testbed.
We proved that while some of the OLSR’ s problems can be solved, for instance the
routing loop, this protocol still have the self-interference problem. There is an intri cate
inter-dependence between MAC layer and routing layer, which can lead the experi-
menter to misunderstand the results of the experiments. For example, the horizon is
not caused only by IEEE 802.11 Distributed Coordination Function (DCF), but also by
the routing protocol.
We carried out the experiments with different routing protocols such as OLSR and
BATMAN and found that throughput of TCP were improved by reducing Link Quality
Window Size (LQWS), but there were packet loss because of expe rimental environ-
ment and traffic interference. For TCP data flow, we got better results when the
LQWS value was 10. Moreover, we found that the node join and leave operations
affect more the TCP throughput and RTT than UDP.
In this work, different from our previous work, we investigate the performance of a
MANET testbed for horizontal and vertical topologies. We implemented seven
MANET scenarios and evaluated the performance considering delay and jitter metrics.
The structure of the paper is as follows. In Secti on 2, we show an overview of OLS R
routing protocol. In Section 3, we design and introduce the implementation of our
testbed. In Section 4, we give experimental results and make the comparison. Finally,
conclusions are given in Section 5.
2 OLSR Overview
The link state routing protocol that is most popular today in the open source world is
OLSR from [15]. OLSR with Link Quality (LQ) extension and fisheye-algo rithm works
quite well. The OLSR protocol is a pro-active routing protocol, which builds up a
route for data transmission by maintaining a routing table inside every node of the net-
work. The routing table is computed upon the knowledge of topology information,
which is exchanged by means of Topology Control (TC) packets. The TC packets in
turn are built after every node has filled its neighbors list. This list contains the iden-
tity of neighbor nodes. A node is considered a neighbor if and only if it can be reached
via a bi-directional link.
Hiyama et al . Human-centric Computing and Information Sciences 2011, 1:3
/>Page 2 of 14
OLSR makes use of HELLO messages to find its one hop neighbors and its two hop
neighbors through their responses. The sender can then select its Multi Point Relays
(MPR) based on the one hop node which offer the best routes to the two hop nodes.
By this way, the amount of control traffic can be reduced. Each node has also an MPR
selector set which enumerates nodes that have selected it as an MPR node. OLSR uses
TC messages along with MPR f orwarding to disseminate neighbor information
throughout the network. OLSR checks the symmetry of neighbor nodes by means of a
4-way handshake based on HELLO messages. This handshake is inherently used to
compute the packetloss probability over a certain link. This can sound odd, because
packetloss is generally computed at higher layer than r outing one. However, an esti-
mate of the packetloss is needed by OLSR in order to assign a weight or a state to
every link. Host Network Address (HNA) messages are used by OLSR to disseminate
network route advertisements in the same way that TC messages advertise host routes.
In our OLSR code, a simple RFC-compliant heuristic is used [16] to compute the
MPR nodes. Every node computes the path towards a destination by means of a simple
shortest-path algorithm, with hop-count as target metric. In this way, a s hortest path
can result to be also not good, from the point of view of the packet error rate. Accord-
ingly, recently olsrd has been equipped with the LQ extension, which is a shortest-path
algorithm with the average of the packet error rate as metric. This metric is commonly
called as the ETX, which is defined a s ETX(i)=1/(NI(i)×LQI(i)). Given a sampling
window W,NI(i) is the packet arrival rate seen by a node on t he i-th link during W.
Similarly, LQI(i) is the estimation of the packet arrival rate seen by the ne ighbor node
which uses the i-th link. When the link has a low packet error rate, the ETX metric is
higher. The LQ extension greatly enhances the packet delivery ratio with respect to
the hysteresis-based technique [17].
3 Testbed Description
Our testbed is composed of six laptops machines. The operating system (OS) mounted
on these machines is Ubuntu Linux with kernel 2.6.28, suitably modified in order to
support the wireless cards. The wireless network cards are from Linksys (model:
WUSB54G ver.4). They are usb-based cards with and external antenna of 2dBi gain,
transmitting power of 16+/-1dBm and receiving sensitivity of - 80 dBm. We verified
that the external antenna improves the quality of the first hop link, which is the link
connecting the ad-hoc network . The driver can be downloaded from the web sites in
references [18,19].
In our testbed, we have two systematic background or interference traffic we could
not eliminate: the control traffic and the other wireless Access Points (APs) inter-
spersed within the campus. The control traffic is due to the ssh program, which is
used to remotely start and control the measurement software on the source node. The
other traffic is a kind of interference, which is typical in an academic scenario.
3.1 Horizontal Topology
For the horizontal topology, we constructed five experimental scenarios. Node states
for each scenario are shown in Table 1. In the horizontal simple scenarios, nodes are
placed in open areas of our fifth floor, while in the horizontal obstacle scenarios the
nodes are placed inside rooms to analyze the effect of obstacles (walls). In Figure 1(a),
Hiyama et al . Human-centric Computing and Information Sciences 2011, 1:3
/>Page 3 of 14
all nodes are in a static state. We call this Horizontal Static (HST) scenario. In Figure 1
(b), only relay node #2 is moving. We call this Horizontal Moving1 (HM1) scenario. In
the third scenario, relay nodes #2 and #3 aremoving(seeFigure1(c)).Wecallthis
Horizontal Moving2 (HM2) scenario. In Figure 2(a), nodes are placed inside rooms
and they are static for all transmission time. We call this Horizontal Obstacle Static
(HOS) scenario. In the last scenario (Figure 2(b)) only node #3 is moving. We wil l call
this Horizontal Obstacle Moving (HOM) scenario.
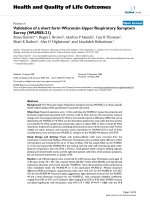
3.2 Vertical Topology
We constructed two experimental scenarios, for vertical topology. Node states for each
scenario are shown in Table 1. In Figure 3(a), all nodes are in a static state. We call
this Vertical Static (VST) scenario. In Figure 3(b), only node #6 is moving. We call this
Vertical Moving (VMO) scenario. A snapshot for each node in vertical topology is
shown in Figure 4.
Table 1 Types of nodes for each experimental model.
Topology Model No. of moving nodes No. of static nodes
Horizontal Simple HST 0 5
HM1 1 4
HM2 2 3
Horizontal Obstacle HOS 0 5
HOM 1 4
Vertical VST 0 5
VMO 1 5
Figure 1 Horizontal topology scenarios. A: HST, B: HM1, C: HM2.
Hiyama et al . Human-centric Computing and Information Sciences 2011, 1:3
/>Page 4 of 14
3.3 Testbed Interface
In our previous work, all the parameters settings and editing were done using com-
mand lines of bash shell (terminal), which resulted in many misprints and the experi-
ments were r epeated many times. In or der to make the experiments ea sier, we
implemented a testbed interface. For the Graphical User Interface (GUI) we used
wxWidgets tool and each operation is implemented by Perl language. wxWidgets is a
cross-platform GUI and tools library for GTK, MS Windows and Mac OS.
We implemented many parameters in the interface such as transmission duration, num-
ber of trials, source address, destination address, packet rate, packet size, LQWS, and
topology setting function. We can save the data for these parameters in a text file and can
Figure 2 Horizontal obstacle topology scenarios. A: HOS, B: HOM.
Hiyama et al . Human-centric Computing and Information Sciences 2011, 1:3
/>Page 5 of 14
manage in a better way the experimental conditions. Moreover, we implemented collec-
tion function of experimental data in order to make easier the experimenter’swork.
4 Experimental Results
4.1 Experimental Settings
The experimental parameters are shown in Table 2. We study the impact of best-effort
traffic for Mesh Topology (MT). In the MT scheme, the MAC filt ering routines are
not enabled. We collected data for two me trics: delay and jitter. These data are
Figure 3 Vertical topolgy scenarios. A: VST, B: VMO.
Hiyama et al . Human-centric Computing and Information Sciences 2011, 1:3
/>Page 6 of 14
collected using the Distributed Internet Traffic Generator (D-ITG) [20], which is an
open-source internet traffic generator.
Thetransmissionrateofthedataflowsis 122 pps = 499.712 Kbps, i.e. the packet
size of the payload is 512 bytes. All experiments have been performed in indoor envir-
onment, in the fifth floor and at the stai rs of our department building. All laptops are
in radio range of each other. The experimental time for one experiment was about 300
seconds. In moving scenarios, nodes stopped at corners for about three seconds before
moving again.
We measured the delay and jitter, which are computed at the receiver. For OLSR,
wT
HELLO
< T
Exp
,whereT
Exp
is the total duration of the experiment, i.e., in our case,
T
Exp
= 300 seconds, and T
HELLO
is the rate of the HELLO messages. However, the
testbed was turned on even in the absence of me asurement traffic. Therefore, the
effective T
Exp
was much greater.
As MAC protocol, we used IEEE 802.11b. The transmission power was set in order
to guarantee a coverage radius big enough to cover all one-hop physical neighbors of
each node in the network. Since we were interested mainl y in the performance of the
routing protocol, we kept unchanged all MAC parameters, such as the carrier sense,
the retransmission counter, the contention window and the RTS/CTS threshold. More-
over, the channel central frequency was set to 2.412 GHz (channel 1). In regard to the
Figure 4 Snapshot of each node (Vertical Topology).
Table 2 Experimental parameters
Function Value
Number of Nodes 6
MAC IEEE 802.11
Flow Type CBR
Packet Rate 122 pps
Packet Size 512 bytes
Number of Trials 30
Duration 300 sec
Routing Protocol OLSR
Hiyama et al . Human-centric Computing and Information Sciences 2011, 1:3
/>Page 7 of 14
interference, it is worth noting that, during our tests, almost all the IEEE 802.11 spec-
trum had been used by other APs disseminated within the campus. In general, the
interference from other APs is a non-controllable parameter.
4.2 Results Discussion
Here, we show the measured data by the box and whisker plot of the metrics accord-
ing to the model types. Box and whisker plot is a convenient way to show groups of
numerical data by lower quartile, median, upper quartile, and the outliers. In the plot,
the bottom and top of the box are always 25th and 75th percentile, respectively, and
the band near the middle of the box is always the median. The end of the whiskers
can represent the lowest datum which is still within 1.5 inter-q uartile range of the
lower quartile, and the highest datum which is still within 1.5 inter-quartile range of
the upper quartile.
4.2.1 Horizontal Topology
The observed metrics are shown in terms of the media n value for four different flows
(source node ® destination node). For horizontal topology, we notice that there is a
better performance in both delay and jitter metrics, for HM1 scenario.
In Figure 5 are shown the delay results for horizontal topology. When all nodes are
static (see Figure 5(a)), we notice that the delay have some oscillations in the case of
#1 ® #4 flow and increases noticeably in the case of #1 ® #5 flow. In Figure 5(b) is
shown the delay results for H M1 scenario. For #1 ® #4 flow and #1 ® #5 flows there
are some oscillations, but the median values show good performance. For HM2 sce-
nario, we show results in Figure 5(c). Oscillations happen in all the flows (#1 ® desti-
nation node). The median values are increasing with the increase of the number of
hops.
Figure 5 Delay results for horizontal topology. A: HST, B: HM1, C: HM2.
Hiyama et al . Human-centric Computing and Information Sciences 2011, 1:3
/>Page 8 of 14
Delay in HOS and HOM scenarios, is shown in F igure 6(a) and Figure 6(b), respec-
tively. The nodes are Non Line Of Sight (NLOS) condition, so the communication is
more difficult in these two scenario s, especially for the #1 ® #5 flow, where there is a
noticeable decrease in performance. In HOM scenario, there are more oscillations,
introduced by mobility of node #3.
We show jitter results for the horizontal topology in Figure 7. For HST scenario (see
Figure 7(a)), we observe that jitter values increase progressively as the number of hops
increases. It looks like the routes become unstable. This happens because different
links may have similar ETX values and the route to destination changes a lot. In Figure
7(b) for HM1 scenario, this effect is minimized by the movement of the intermediate
node #2. In fact, this sounds contradictory with the dynamism introduced by mobility
in our previous works [11]. But in this case, choosing the link with the highest ETX
becomes easy and the communication seems to establish stable routes. However, the
dynamism introduced by mobility is still present, as in HM2 scenario there is an
increase and oscillations in jitter values.
Regarding jitter metric, in HOS scenario the performance is good when destination is
node #2, #3 or #4. As shown in Figure 8(a), the communication of node #1 with node
#5 shows higher jitter, which is induced by the presence of walls. For HOM scenario,
results are shown i n Figure 8(b). We notice similar results with HOS s cenario, but
there are more oscillations. Mobility and obstacles decrease the performance.
4.2.2 Vertical Topology
In vertical topology we have implemented two scenarios. We show the results for delay
and jitter, in Figure 9 and 10, respectively. In Figure 9(a), the delay results for VST sce-
nario show that OLSR has a good performance when communication occurs in one or
two hops. When the destination node is node #4, which is located at the second floor,
we notice oscillations and the values of delay increase as the communication in three
or more hops becomes difficult. The performance becomes worse when the destination
is node #5. The same tendency is also observed regarding jitter metric, as shown in
Figure 10(a).
In VMO scenario, node #6 moves from the fifth floor to the first floor. The mobility
of this node brings dynamism regarding routes on the network. This is prooved by a n
increase in the values of delay and jitter, in comparison with VST scenario, as shown
in Figures 9(b) and 10(b), respectively. However, if we observe the boxplot of the #1 ®
Figure 6 Delay results for horizontal obstacle topology. A: HOS, B: HOM.
Hiyama et al . Human-centric Computing and Information Sciences 2011, 1:3
/>Page 9 of 14
#5 flow in Figure 9(b), we notice that delay values are smaller than in the #1 ® #4
flow. Comparing with the values of VST scenario, where delay increased progressively
with the increase of hop distance, in this case the movement of node #6 also helps the
communication to node #5 by creating more routes available and more probability to
choose a better route from node #1 to node #5. Regarding #1 ® #6 flow, the destin a-
tion node #6 is moving during all the time of transmission. We notice oscillations in
this case, caused by mobility. However, the perfomance for this flow, regarding delay
and jitter is better than when destination is node #3, #4 or #5.
If we compare static scenarios for both topologies, we can say in general that the
median values for delay and jitter are higher in VST scenario than in HST scenario.
Also from Figures 5, 7, 9 and 10 we can see that when nodes are moving, in horizontal
topology the values of delay and jitter are lower. In the vertical topology the nodes cre-
ate links between each-other in the NLOS condition. Based on this fact and the results
of our experiments, we can conclude that the link quality is better in horizontal topol-
ogy and mobility influences delay and jitter more in the vertical topology.
5 Conclusions
In this paper, we conducted experiments by our MANET testbed f or horizontal and
vertical scenarios. We used OLSR protocol for experimental evaluation. In our experi-
ments, we considered seven models: HST, HM1, HM2, HOS, HOM, VST and VMO.
We assessed the performance of our t estbed in terms of delay and jitter. From our
experiments, we found the following results.
In horizontal topology, when in HST scenario the number of hops increases to 3 or
more hops, there are oscillations. Delay and jitter values increase progressively as the
Figure 7 Jitter results for horizontal topology. A: HST, B: HM1, C: HM2.
Hiyama et al . Human-centric Computing and Information Sciences 2011, 1:3
/>Page 10 of 14
number of hops increases. There is a better performance in both delay and jitter
metrics, for HM1 scenario. The movement of a relay node helps the communication
between other nodes to establish more stable routes. In HM2 scenario oscillations hap-
pen in all flows and the median values are increasin g with the increase of th e number
of hops. For HOS and HOM scenarios, the communication becomes difficult, because
the obstruction of obstacles. Delay and jitter values are increased when the destination
is node #5.
Figure 8 Jitter results for horizontal obstacletopology. A: HOS, B: HOM.
Hiyama et al . Human-centric Computing and Information Sciences 2011, 1:3
/>Page 11 of 14
In vertic al topology, for VST scenari o OLSR has a good performance when commu-
nication occurs in one or two hops. When the communication needs three or more
hops,wenoticeoscillationsandthevaluesofdelayincrease.Thesametendencyis
also observed regard ing jitter metric. In VMO scenario the mobility of node #6 brings
dynamism regarding routes on the network. In this case the movement of node #6 also
helps the communication to node #5 by creating more routes available and more prob-
ability to choose a better route from node #1 to node #5.
Figure 9 Delay results for vertical topology. A: VST, B: VMO.
Hiyama et al . Human-centric Computing and Information Sciences 2011, 1:3
/>Page 12 of 14
In the vertical topology the nodes create links between each-other in the NLOS con-
dition. Though, the link quality is better in horizontal topology and mobility influences
delay and jitter more in the vertical topology.
In this work, we carried out the experiments with a proactive routing protocol in an
indoor scenario. In the future, we would like to consider the performance of reactive
protocols and compare the experimental results with simulation results. Moreover, we
would like to evaluate the performance of our testbed for outdoor scenarios.
Figure 10 Jitter results for vertical topology. A: VST, B: VMO.
Hiyama et al . Human-centric Computing and Information Sciences 2011, 1:3
/>Page 13 of 14
Acknowledgements
This work is supported by a Grant-in-Aid for scientific research of Japan Society for the Promotion of Science (JSPS).
The authors would like to thank JSPS for the financial support.
Author details
1
Graduate School of Engineering, Fukuoka Institute of Technology (FIT), 3-30-1 Wajiro-Higashi, Higashi-Ku, Fukuoka
811-0295, Japan
2
Department of Information and Communication Engineering, Fukuoka Institute of Technology (FIT),
3-30-1 Wajiro-Higashi, Higashi-Ku, Fukuoka 811-0295, Japan
Authors’ contributions
MH designed and implemented the testbed, including scenarios and data gathering. EK participated in the data
analysis and theoritical contents of the paper. TO implemented the graphical user inter face for better control of
experiments. MI did the initial settings of the testbed and implemented HST scenario. LB participated in the testbed
design and implementation and checked the final version of the paper for submission.
Competing interests
The authors declare that they have no competing interests.
Received: 11 October 2011 Accepted: 22 November 2011 Published: 22 November 2011
References
1. Lundgren H, Nordstrom E, Tschudin C (2002) Coping with Communication Gray Zones in IEEE 802.11b based Ad Hoc
Networks. Proc. of the 5-th ACM International Workshop on Wireless Mobile Multimedia (WOWMOM-2002) 49–55
2. Kiess W, Mauve M (2007) A Survey on Real-world Implementations of Mobile Ad-hoc Networks. Ad Hoc Networks
5(3):324–339
3. Maltz DA, Broch J, Johnson DB (2001) Lessons from a Full-scale Multihop Wireless Ad Hoc Network Testbed. IEEE
Personal Communications 8(1):8–15
4. Gray RS, Kotz D, Newport C, Dubrovsky N, Fiske A, Liu J, Masone C, McGrath S, Yuan Y (2004) Outdoor Experimental
Comparison of Four Ad Hoc Routing Algorithms. Proc. MSWiM-2004 220–229
5. Anastasi G, Borgia E, Conti M, Gregori E (2005) IEEE 802.11b Ad Hoc Networks: Performance Measurements. Cluster
Computing 8(2-3):135–145
6. Johnson D, Hancke G (2009) Comparison of Two Routing Metrics in OLSR on a Grid based Mesh Network. Ad Hoc
Networks 7(2):374–387
7. De Marco G, Ikeda M, Yang T, Barolli L (2007) Experimental Performance Evaluation of a Pro-active Ad-hoc Routing
Protocol in Outdoor and Indoor Scenarios. Proc. of IEEE AINA-2007 7–14
8. Kawadia V, Kumar PR (2005) Experimental Investigations into TCP Performance over Wireless Multihop Networks. Proc.
of E-WIND-2005 29–34
9. Clausen T, Hansen G, Christensen L, Behrmann G (2001) The Optimized Link State Routing Protocol, Evaluation through
Experiments and Simulation. Proc. of IEEE Symposium on Wireless Personal Mobile Communications http://hipercom.
inria.fr/olsr/wpmc01.ps
10. Barolli L, Ikeda M, De Marco G, Durresi A, Xhafa F (2009) Performance Analysis of OLSR and BATMAN Protocols
Considering Link Quality Parameter. Proc. of IEEE AINA-2009 307–314
11. Kulla E, Ikeda M, Barolli L, Miho R (2010) Impact of Source and Destination Movement on MANET Performance
Considering BATMAN and AODV Protocols. Proc. of BWCCA-2010 94–101
12. Ikeda M, Barolli L, Hiyama M, Yang T, De Marco G, Durresi A (2009) Performance Evaluation of a MANET Testbed for
Differenet Topologies. Proc. of NBiS-2009, Indianapolis 327–334
13. Ikeda M, Barolli L, De Marco G, Yang T, Durresi A (2008) Experimental and Simulation Evaluation of OLSR Protocol for
Mobile Ad-hoc Networks. Proc. of NBiS-2008 111–121
14. Hiyama M, Ikeda M, Barolli L, De Marco G, Xhafa F, Durresi A (2009) Mobility Effects in Mobile Ad Hoc Networks. Proc.
of International Workshop on Network Traffic Control, Analysis and Applications (NTCAA-2009) 2:679–684
15. Tonnesen A OLSRd: Implementation Code of the OLSR Accessed on February 24, 2011
16. Clausen T, Jacquet P (2003) Optimized Link State Routing Protocol (OLSR). RFC 3626 (Experimental)
17. Couto DSJD, Aguayo D, Bicket J, Morris R (2003) A High Throughput Path Metric for Multi-hop Wireless Routing. Proc.
of MobiCom-2003 134–146
18. Rt2x00 Project for Wireless Card’s Linux Drivers. Accessed on November 24, 2010
19. Ralink RT2570 USB Enhanced Driver. Accessed on November 24,
2010
20. Botta A, Dainotti A, Pescape A (2007) Multi-protocol and Multiplatform Traffic Generation and Measurement. Proc. of
INFOCOM-2007, Demo Session
doi:10.1186/2192-1962-1-3
Cite this article as: Hiyama et al.: Application of a MANET Testbed for horizontal and vertical scenarios:
performance evaluation using delay and jitter metrics. Human-centric Computing and Information Sciences 2011 1:3.
Hiyama et al . Human-centric Computing and Information Sciences 2011, 1:3
/>Page 14 of 14