Báo cáo hóa học: " Properties of gold nanostructures sputtered on glass" potx
Bạn đang xem bản rút gọn của tài liệu. Xem và tải ngay bản đầy đủ của tài liệu tại đây (501.21 KB, 9 trang )
NANO EXPRESS Open Access
Properties of gold nanostructures sputtered
on glass
Jakub Siegel
1*
, Olexiy Lyutakov
1
, Vladimír Rybka
1
, Zdeňka Kolská
2
, Václav Švorčík
1
Abstract
We studied the electrical and optical properties, density, and crystalline structure of Au nanostructures prepared by
direct current sputtering on glass. We measured temperature dependence of sheet resistance and current-voltage
characteristics and also performed scanning electron microscopy [SEM] analysis of gold nanolayers. It was shown
that within the wide range of temperatures, gold nanolayers (<10 nm) exhibit both metal and semiconducting-like
type of conductivity. UV/Vis analysis proved the semiconducting characteristic of intrinsic Au clusters. SEM analysis
showed the initiatory stadium of gold layer formation to be running over isolated islands. Gold density calculated
from the weight and effective thickness of the layers is an increasing function of the layer thickness up to
approximately 100 nm. In thin layers deposited on solid surface, a lattice expansion is obse rved, which is
manifested in the increase of the lattice parameter and the decre ase of metal density. With increasing layer
thickness, the lattice parameter and the density approach the bulk values.
Introduction
Nanocrystalline thin solid films nowadays present enor-
mous scientific interest, mainly due to their attractive
novel properties for technological applications [1,2]. The
most important prerequisite for the preparation of high-
quality film is an understanding of its growth dynamics
and structure in different phases of deposition.
In the course of the twentieth century, the theory of
size-dependent effects in metal thin layers was further
developed by numerous scientists, and various
approaches to the problem were proposed. For isolated
metal particles’ behavior at exiguous dimensions (1D
and 2D), quantum size effects are decisive, whereas for
ultrathin metal layers both surface effects and quantum
size effects must be considered [3,4]. These phenomena
can be attributed to a high nanol ayer and/or nanoparti-
cle surface-to-bulk ratio. H and in hand with the reduc-
tion of nanoparticle dimension, surface atoms’
proportion increases dramatically; thus, commonly
known physical properties of the bulk materials change,
e.g., density and melting point of Au nanoparticle
decreases [5-7]. Properties of metal layers are affected
by electron scattering on phonons, on imperfections,
and at layer boundaries. While the first two types of
scattering occur also in b ulk metal, the last one plays a
role only in thin layers, and it is responsible for the
reduction of the electric conductivity of thin layers [8].
Mathematical formula for the calculation of relaxation
times for more than one s cattering mechanism is given
by Matthiessen’s rule [8].
Gold is known as a shiny, yellow noble metal that
does not tarnish, has a fac e-centered cubic structure,
is non-magnetic, melts at 1,336 K, and has density a
19.320 g cm
-3
. However, a small sample of the same
gold is quite different, providing it is tiny enough:
10-nm particles absorb green light and thus appear red.
The melting temperature decreases dramatically as the
sample size goes down [9]. Moreover, gold ceases to be
noble, and 2- to 3-nm nanoparticles are excellent cata-
lysts which also exhibit considerable magnetism [4,10].
At this size, Au nanoparticles also turn into insulators.
Gold in the form of thin films is nowadays used in a
vast range of applications such as microelectromechani-
cal and nanoele ctromechanical systems [11,1 2], sensors
[13], electronic textiles [14], bioengineering [15], genera-
tor of nonlinear optical properties [16], or devices for
surface-enhanced Raman scattering [17].
The optical and electrical properties of Au nanoparti-
cles have been studied on samples prepared by atom
sputtering deposition approach onto porous alumina
* Correspondence:
1
Department of Solid State Engineering, Institute of Chemical Technology,
Technicka 5, 166 28 Prague, Czech Republic
Full list of author information is available at the end of the article
Siegel et al. Nanoscale Research Letters 2011, 6:96
/>© 2011 Siegel et al; licensee Springer. This is an Open Access article distributed under the terms of the Creative Commons Attribution
License ( which permits unrestricted use, dis tribution, and reproduction in any medium,
provided the original work is properly cited.
in [18]. The electrical resistance measurement shows
that the nanoparticles are conductive even at a small
metal volume fraction. Due to the aggregation effect, the
optical transmission spectra exhibited an enhanced
transmition band around 500 nm arising from the sur-
face plasmon resonance [18]. Many authors have devel-
oped theories of distortion of crystalline lattice in
nanostructures, some of them being applicable on nano-
particles. Spherical nanoparticles surrounded ‘by air’
have different behaviors as nanost ructure s deposited on
solid surf ace. While in spherical nanoparticles a domi-
nant effect is a lattice compre ssion [9,19-21], in other
nanostructured materials (e.g., nanowires, nanolayers), a
lattice expansion is observed [22,23]. The compression
can be explained b y the Young-Laplace equation for
spherical particles and the effect of decreasing size and
a curvature of surfa ce. The expansion on the other hand
can be due to imperfections of the lattice and the size
surface effects on nanostructures. More import ant is the
effect of lattice imperfections which, on the other hand,
may lead to a density decrease.
In this work, we studied the electrical and optical
properties, density, and crystalline structure of Au
nanostructures prepared by sputtering on glass. Mea-
surement of the sheet resistance of gold nanostructures
at room and low (LN
2
) temperatures proved the metal
or semiconductive-like characteristic of the structures.
Scanning electron microscopy [SEM] analysis showed
the gold layer growth to be running over isolated
islands. The mechanism of charge transfer and the opti-
cal excitation of metal particles were de termined by
measuring the electrical sheet resistance and UV/Vis
spectrometry, respectivel y. The UV/Vis spectra were
interpreted in the frame of the well-known Tauc’s
model [24], and the optical band gap (E
g
opt.
) of ultrathin
Au structures was calculated as a function of structure
thickness. X-ray diffraction [XRD] analysis provided
information about the crystalline structure and the lat-
tice parameter values. Density of Au was calculated
from the weight (gravimetry) and the effective thickness
of Au layers which were measured by atomic force
microscopy [AFM].
Experimental details
Substrate and Au deposition
The gold structures were sputtered on a 2 × 2-cm
microscopic glass substrate, 1 mm thick, supplied by
Glassbel Ltd., C zech Republic. Glass surface roughness
of R
a
= 0. 34 nm was measured at “"square 1.5 μm
2
.The
sputtering was accomplished on a Balzers SCD 050
device from gold target (purity 99.99%, supplied by
Goodfellow Ltd., Cambridge, UK). One slide was pre-
pared during each sputtering operation. Deposition
chamber was not equipped with a rot ated sample
holder. Under analogous experimental conditions,
homogenous layers with uniform thickness were pre-
pared [ 25]. The deposition conditions were the follow-
ing: direct current Ar plasma, gas purity 99.995%,
discharge power of 7.5 W, Ar flow approximately
0.3 l s
-1
, pressure of 5 Pa, electrode distance of 50 mm,
electrode area of 48 cm
2
, and reaction chamber volume
approximately 1,000 cm
3
. The sputtering times vary
from 4 to 500 s.
Diagnostic techniques
Metal structure thickness for chosen sputtering times
(effective thickness) was examined using AFM. The
AFM images were taken under ambient conditions on a
Digital Instruments CP II setup. The samples, 1 cm
2
in
area, were mounted on stubs using a double-sided adhe-
sive. A large area scanner was used, allowing an area up
to 100 μm
2
to be imaged. A Veeco phosphorus-doped
silicon probe CONT20A-CP with spring constant
0.9 N m
-1
was chosen. In the present experiment, struc-
ture homogeneity was tested by a scratch technique at
ten different positions. The thickness of the structures
was determined from the AFM scan done in contact
mode [26]. Thickness variations do not exceed 5%. All
scans were acquired at a scanning rate of 1 Hz.
The electrical properties of gold structures were exam-
ined by measuring the electrical sheet resistance (R
s
). R
s
was determined by a standard two-point technique using
a KEITHLE Y 487 pi coampermeter. For this measure-
ment, additional Au con tacts, about 50 nm thick, were
created by sputtering. The electrical measurements were
performed at a pressure of about 10 Pa to minimize the
influence of atmospheric humidity. The temperature
dependence of R
s
was determined on the samples placed
inacryostatevacuatedtothepressureof10
-4
Pa. The
samples were first cooled to the LN
2
temperature and
then gradually heated to room temperature. Typical error
of the sheet resistance measurement did not exceed ± 5%.
The current-voltage [CV] characteristics were mea-
sured using picoampermeter KEITHLEY 487 (sheet
resistance, >10
5
Ω) and multimeter UNI-T (sheet resis-
tance, <10
5
Ω). The temperature dependence of CV
characteristics was also determined. In that case, mea-
sured samples were placed into the cryostat at the tem-
perature of liqu id nitrogen and were gradually heated to
room temperature.
XRD analysis was performed by an automatic powder
refractometer Panalytical X’ Pert PRO using a copper
X-ray lamp (l
CuKa1
= 0.1540598 nm) equipped with an
ultrafast semiconductor detector PIXcel. Measurement
has passed on a symmetric Bragg-Brentano geometry.
Diffractograms were registered in the angular range
2ϑ = (10° to 85°). Lattice parameter a of the cubic face-
centered lattice of Au was calculated from diffraction
lines location and its intensity using Rietveld’smethod.
Siegel et al. Nanoscale Research Letters 2011, 6:96
/>Page 2 of 9
The lattice parameter could only be determined for
samples with an Au thickness exceeding 10 nm.
UV/Vis spectra were measured using a Shimadzu 3600
UV-Vis-NIR spectrometer (Kyoto, Japan) in the spectral
range from 200 to 2,700 nm. Evaluation of the optical
spectra was performed using Film Wizard software with
the aim of determining plasma frequency. Measured
spectra were also interpreted in the frame of Tauc’smodel
[24] using Tauc’s equation a(ν)=A(hν - E
g
opt
)
x
/hν, where
a is the absorption coefficient of the substance, E
g
opt
is the
substance optical band gap, x is the parameter th at gives
the type of electron transition, and factor A depe nds on
the transition pr obability and can be assumed to be con-
stant within the optical frequency range [26]. Optical band
gap width, E
g
opt
, of layers was assessed from the linear
part of plot ((a(ν)⋅ hν)
x
vs. hν). Indirect transition cannot
be excluded in these layers, and therefore , x =1/2was
used in the calculation.
Mettler Toledo UMX2 microbalance (Greifensee,
Switzerland) was used for gravimetric determination of
an amount of sputtered gold on a glass template. Density
of Au layers was then calculated from the weight and
effective layer thickness determined from the AFM scan.
Direct measurement of the layer thickness was accom-
plished by a SEM (JSM-7500F). The specimen for SEM
examination was prepared by cross-sectioning of the
metal-glass sandwich on a standard cross-section pol-
isher, with focused ion beam (6-kV acceleration voltage).
Results and discussion
Thickness and morphology of Au structures
Thickness of sputtered layers was measured by AFM.
Thickness in the initiatory stadium of deposition (sput-
tering time, 50 s) was determined from the SEM image of
the sample cross-section. Dependence o f the layer thick-
ness on sputtering time is displayed in Figure 1. Linear
dependence between sputtering time and structure thick-
ness is evident even in the initiatory stadium of the layer
growth. This finding is in contradiction with results
obtained earlier for Au sputtering on polyethylenetereph-
talate [25]. In that case, the initiatory stadium of the layer
growth was related to a lower deposition rate.
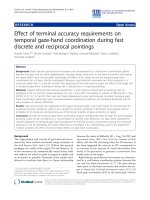
In Figure 2, a SEM picture of the cross-section of the
Au layer at its initiatory stadium of growth is shown. It
is obvious that after approximately 20 s of Au deposi-
tion, flat, discrete Au islands (clusters) appear on the
substrate surface. The flatness may indicate preferential
growth of gold clusters in a lateral direction. When the
surface coverage inc reases and t he clusters get in close
contact with each other, a coarsening sets in and
becomes the dominant process. After the surface is fully
covered, additional adsorption causes only the vertical
layer growth, while the lateral growth is dominated by
cluster boundary motion [27].
Electrical properties of Au structures
Figure 3 shows the dependence o f the sheet resistance
of Au structure on the sputtering time. Precedence was
given to the dependence on the sputtering time since
the accuracy of AFM thickness determination is limited
Figure 1 Dependence of the gold structure thickness on
sputtering time.
~5 nm
Au/glass
Figure 2 SEM scan of the cut of gold structure on glass
substrate. Deposition time was 20 s. The cut was done with the
FIB method.
Siegel et al. Nanoscale Research Letters 2011, 6:96
/>Page 3 of 9
for short sputtering times. It is well known that a rapid
decline of sheet resistance of the sputtered layer indi-
cates a transition from the electrical discontinuous to
the electrical continuous l ayer [28]. One can see that
the most pronounced change in the sheet resistance
occurs between 20 and 50 s of sputtering times, corre-
sponding to the 5- to 10-nm range of the layer thick-
ness. Thus, the layers w ith a thickness below 5 nm can
be considered as discontinuous ones, while the layers
with a thickness above 10 nm are definitely continuou s.
From the measured sheet resistance (Figure 3) and
effective layer thickness, it is possible to calculate the
layer resistivity R (Ω cm).Onecanseethatthelayer
resistivities are about one order of magnitude higher
than that reported for metallic bulk gold (R
Au
=2.5×
10
-6
Ω cm) [29]. The higher resistivity of thin gold
layers is due to the size effect, in accord with the Mat-
thiessen rule [8].
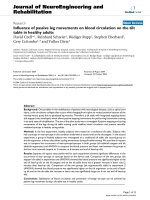
The temperature dependence of the sheet resistance
for two pa rticular structure thicknesses is displayed in
Figure 4. O ne can see that the temperatur e depende nce
of the sheet resistance strongly depends on the structure
thickness. For the layer about89nmthick,theresis-
tance is an increasing function of the sample tempe ra-
ture, the behav ior expected for metals. For the structure
about 6 nm thick, the sheet resistance first d ecreases
rapidly with increasing temperature, but a bove a tem-
perature of about 2 50 K, a slight resistance increase is
observed. The initial decrease and the final increase of
the sheet resistance with increasing temperature are
typical of semiconductors and metals, respectively. It
has been referred elsewhere [4] that a small metal clus-
ter can exhibit both metal and semiconductor character-
istics just by varying the temperat ure. It is due to
temperature-affected evolution of band gap and density
of electron states in the systems containing low number
of atoms. From the present experimental data, it may be
concluded that for the thicknesses above 10 nm, the
sputtered gold layers exhibit metal conductivity. In the
thickness range from 5 to 10 nm, the semiconductor-
like and metal conductivities are observed at low and
high temperatures, respectively. Our further measure-
ments showed that the layers thinner than 5 nm exhibit
a semiconductive-like characteristic in the whole investi-
gated t emperature scale. Except for band gap evolution
theory, typical semiconductor-like behavior may also
originate from the tunneling effect of electrons through
the discontinuous, separated Au clusters during electri-
cal measurements. Since the probability of electron
tunneling depends on the temperature, similarly,
typical c ourse of sheet resistance and, as will be show n
later, CV characteristic may be affected right by this
phenomenon.
Figure 3 Dependence of the sheet resistance of the gold
structure on deposition time.
5.8 nm
88.7 nm
Figure 4 Temperat ure dependence of the sheet resistance for
two different structure thicknesses indicated in the figure.
Siegel et al. Nanoscale Research Letters 2011, 6:96
/>Page 4 of 9
Figure 5 displays the CV characteristics of the 5.8-nm-
thick Au layer measured at room temperatur e [RT] and
at a temperature of 90 K (LN
2
). The CV curve at RT is
strictly linear so that Ohm’ s law is valid a nd the layer
exhibits metallic behavior. The CV curve o btained at
90 K grows exponentially so th at it has a non-Ohmic
characteristic typical of semiconductors. This is in a
good accordance with the data of Figure 4 and the the-
ory of band g ap occurrence in metal nanostructures.
While at RT the thermal excitation is big enough for
electrons to overcome band gap, at 90 K, the band gap
cannot be ov ercome. CV depe ndence measured at RT
and 90 K on the 5.8-nm-thick Au layer confirmed for-
mer interpretation of the temperature dependence of
the sheet resistence, i.e., metallic characteristic of the
conductance at RT and the semiconductor one at low
temperatures.
From the measurements of sheet resistance and CV
characteristics result the semiconductor-like characteris-
tic of Au at specific structure conditions (thickness,
temperature). The observed semiconductor-like charac-
teristic (decreasing resistance with increasing tempera-
ture, n onlinearity of CV characteristic) of ultrathin Au
structures may originate from two undistinguishable
phenomena. The first one results from a tunneling effect
which occurs at discontinuous structures during
resistance measurements [30]. The second one origi-
nates from the semiconductor characteristic of the
intrinsic cluster itself, which occurs in metal na nostruc-
tures of sufficiently small proportions [4]. With respect
to the experimental method used, it is impossible to dis-
tinguish which phenomenon prevails in prepared struc-
tures and contribute to the observed semiconductor-like
behavior of Au nanostructures.
In order to investigate whether the intrinsic Au clus-
ters forming ultrathin Au coverage exhibit semiconduc-
tor behavior, inde ed we accomplished additional optical
UV/Vis analysis.
Optical properties of Au structures
Thin Au films exhibit structure-dependent UV/Vis opt i-
cal spectra [28,31,32]. The localized ab sorption charac-
teristic of Au films is highly sensitive to the surrounding
medium, parti cle size, surface structure, and shape [33].
Transmission spectra from the samples with gold struc-
tures of variou s thicknesses are sh own in Figure 6. Only
the samples with the gold structure <20 nm thick, trans-
mitting primary light beam enough, were examined. The
spectra exhibit an absorption minimum around 500 nm
which is slightly red-shifted with increasing film thick-
ness. Pronounced absor ption increasing at longer wave-
length could be attributed to the surface plasmon
resonance [34]. Discontinuous and inhomogeneous
layers, with thickness rangingfrom2.4to9.9nmand
Figure 5 Current-voltage characteristic of a 5.8-nm-thick Au
structure measured at room temperature (RT) and at a
temperature of 90 K.
Figure 6 Transmission spectra of gold layers for different
structure thicknesses as indicated in the figure.
Siegel et al. Nanoscale Research Letters 2011, 6:96
/>Page 5 of 9
composed of nanometer-sized metal clusters, exhibit
absorption in the visible region attributed to the surface
plasmon in the metal islands. The surface plasmon peak
is shifted from 720 to 590 nm as the nominal layer thick-
ness decreases from 19.5 to 2.4 nm. It is well known that
optical absorption of island films of gold is a function of
island density [35]. The absorption band resulting from
bounded plasma resonance in the particles is shifted to
longer wavelengths as the island density increases. As the
thickness becomes greater, the absorption band is broa-
dened due to a wider particle size distribution.
Evaluation of the optical spectra was performed using
Film Wizard software and a Maxwell-Garnett model
was applied. In this model , Au films were described as a
heterogeneous mixture of material and voids. With the
aim of incorporating nanosize of gold clusters for the
aforementioned material, the Lorentz-Drude behavior of
the o ptical parameters wa s presumed. This approxima-
tion is a generalization of both the Lorentz oscillator
and the Lorentz-Drude models and includes the effect
of the free carrier contribution to the dielectric function
and resonant transitions between allowed states. The
best fits were obtained in the case of thickness from 2
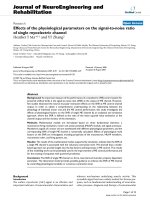
to 15 nm. Main parameter of the chosen approximation,
plasma frequency, is presented in Figure 7A as a func-
tion of the film thickness. As was predicted by the the-
ory of Mie, the red shift [36] occurs with increasing
cluster size (film thickness). Additionally, it is evident
that plasma frequency strongly depends on the film
thickness. The plasma frequency increases with increas-
ing layer thickness, and for thicknesses above 15 nm, it
reaches typical ‘ bulk’ val ue of gold, 9.02 eV . It is wel l
known that the plasma frequency is closely related
to the concentration of the free carrier [37]. From
Figure 5, it can be concluded that the concentration of
free carriers is an increasing function o f the film thick-
ness. This result is in good agreement with previous stu-
dies [30]. Increase of free carrier concentration with
increasing nanostructure thickness is a direct evidence
of the tunneling effect of electrons between isolated
gold clusters [30].
The UV/Vis spectra were also interpreted in the frame
of Tauc’s model [24] (see also above) and the optical
band g ap (E
g
opt.
) calculated as a function of the struc-
ture thickness. The E
g
opt.
as a function of the structure
thicknessisshowninFigure 7B. A non-zero value of
E
g
opt.
was detected in the case of Au structure thick-
nesses ranging from 2 to 30 nm, which corresponds
A B
Figure 7 Dependence of plasma frequency (A) and optical band gap ( B) evaluated from the UV/Vis spectra on the thickness of
deposited structures.
Siegel et al. Nanoscale Research Letters 2011, 6:96
/>Page 6 of 9
with the sputtering times between 4 and 150 s. Apart
from electrical measurements, optical meth ods do not
require any conductive path between separated clusters
during measurement. That is why optical-based methods
are able to separat e the contrib ution of tunneling effects
to the properties of Au nanostructures, which cannot be
omitted during electrical measurements of discontinu-
ous m etal layers. Optically analyzed evolution of band
gap thus unambiguously confirms the semiconductive
characteristic of intrinsic clusters forming Au nanolayers.
However, even after the electrically continuous layer is
formed (sputtering time of approximately 50 s, which
corresponds to a structure thickness of approximately
10 nm), which is characterized by the creation of a con-
ductive path between isolated clusters and a rapid decline
of sheet resi stance (see Figures 1 and 3), there still must
exist regions of separat ed Au clusters in deposited layer
which contribute to non-zero E
g
opt.
up to the structure
thickness of approximately 30 nm (see Figure 7B).
Lattice parameter and density of Au structures
It has been published elsewhere [5,38] that the lattice
parameter of metals prepared in the form of a thin layer
by a physical deposition is not a material constant
but depends strongly on the layer thickness. Figure 8
displays the dependence of the Au lattice parameter
on layer thickness derived from the present XRD mea-
surements. The dependence exhibits a monotonous
decline of the lattice parameter with increasing
layer thickness. This can be explained by the internal
stress relaxation during the growth of gold clusters (see
Figure 2 and [39]).
With the aim of finding how the decline of lattice para-
meter influences the density of gold structures, we mea-
sured the effective thickness and the mass of deposited
structures and calc ulated t he ef fective density in a stan-
dard way. In Figure 8, the dependence of the density o n
the layer thic kness is shown. The density increases with
increasing layer thick ness, and for about a 9 0-nm-thick
layer, it achieves the density of bulk gold. The reduced
density of thinner structures is probably due to the higher
fraction of free volume in gold nanocluste rs. As the gold
Figure 8 Dependence of la ttice parameter (square)anddensity(circle) on Au l ayer thickness for glass substrate. The density was
calculated from Au layer effective thickness and mass.
Siegel et al. Nanoscale Research Letters 2011, 6:96
/>Page 7 of 9
clusters become greater [27], the free volume fraction
decreases and the gold density graduall y increases. It was
reported earlier [40] that gold layers with thicknesses
above 100 nm prepared on glass substrate exhibit quite a
uniform densit y, with a mean value of 19.3 g cm
-3
typical
of bulk material. Theoretical Au density was calculated
from the value of lattice parameter [41].
Conclusions
We observe a l inear depende nce between the sputtering
time and the structure thickness even in the initial sta-
dium of the Au growth. After the stage of nucleation,
the growth of Au clusters proceeds mainly in the lateral
direction. A rapid decline of the sheet resistance of the
gold layer with increasing structure thickness indicates a
transition from the discontinuous to the continuous
gold layer. From the dependence of the sheet resistance
on the sample temperature and from the measured CV
characteristics of Au structures, it follows that the gold
layers thicker than 10 nm exhibit a metallic characteris-
tic. Structures with thicknesses between 5 and 10 nm
exhibit a semiconductor-like characteristic at low tem-
peratures and metalloid conductivity at higher tempera-
tures. Layers with thicknesses below 5 nm exhibit
semic onductive-like properties in the whole investigated
temperature range. Optical absorption of the structures
at the initial phase of the layer growth is a function of
the gold cluster density. Plasma frequency (concentra-
tion of free carrier) increases with the layer thickness.
UV/Vis analysis proved the semico nducting characteris-
tic of intrinsic Au clusters. XRD measurements proved
the monotonous d ecline of the lattice parameter with
increasing structure thickness. Measurements of the
effective thickness and weight of deposited structures
showed that the Au density is an increasing function of
structure t hickness. For the layer thicknesses above 90
nm, the layer density achieves the bulk value.
Acknowledgements
This work was supported by the Grant Agency of the CR under the projects
106/09/0125 and 108/10/1106, Ministry of Education of the CR under
Research program LC 06041, and Academy of Sciences of the CR under the
projects KAN400480701 and KAN200100801. It was also founded by financial
support from specific university research (MSMT no. 21/2010).
Author details
1
Department of Solid State Engineering, Institute of Chemical Technology,
Technicka 5, 166 28 Prague, Czech Republic
2
Department of Chemistry, J.E.
Purkyně University, Ceské mládeze 8, 400 96 Usti nad Labem, Czech Republic
Authors’ contributions
JS carried out thickness and resistance measurements at RT, participated in
Au density determination. He designed and drafted the study. OL carried
out resistance measurements at low temperature and optics measurements
together with its evaluation. VR participated in the evaluation of optical
spectra and electrical measurements. ZK carried out the Au density and
lattice parrameter. VS concieved of the study and participated in its
coordination.
Competing interests
The authors declare that they have no competing interests.
Received: 26 May 2010 Accepted: 19 January 2011
Published: 19 January 2011
References
1. Biswas A, Karulkar PC, Eilers H, Norton MG, Skorski D, Davitt C, Greve H,
Schürmann U, Zaporojtchenko V, Faupel F: Low cost, tailored polymer-
metal nanocomposites for advanced electronic applications. Vac Technol
Coat 2006, 7:57.
2. Hynninen A, Thijssen JHJ, Vermolen ECM, Dijkstra M, Blaaderen AV: Self-
assembly route for photonic crystals with a bandgap in the visible
region. Nat Mater 2007, 5:605.
3. Rao CNR, Kulkarni GU, Thomas PJ, Edwards PP: Size-dependent chemistry:
Properties of nanocrystals. Chem Eur J 2002, 8:1.
4. Roduner E: Size-dependent chemistry: Properties of nanocrystals. Chem
Soc Rev 2006, 35:583.
5. Fisher W, Geiger H, Rudolf P, Wissmann P: Structure investigation on
single-crystal gold-films. J Appl Phys 1977, 13:245.
6. Haupl K, Lang M, Wissmann P: X-ray-difraction investigations on ultra-thin
gold-films. Surf Interf Anal 1986, 9:27.
7. Wang N, Rokhlin SI, Farson DF: Nonhomogeneous surface premelting of
Au nanoparticles. Nanotechnology 2008, 19:575.
8. Chopra K: Thin Film Phenomena New York: Wiley; 1969.
9. Sun CQ: Size dependence of nanostructures: Impact of bond order
deficiency. Prog Solid State Chem 2007, 35:1.
10. Seino S, Kinoshita T, Otome Y, Maki T, Nakagawa T, Okitsu K, Mizukoshi Y,
Nakayama T, Sekino T, Niihara K, Yamamoto TA: Gamma-ray synthesis of
composite nanoparticles of noble metals and magnetic iron oxides.
Scripta Mater 2004, 51:467.
11. Nakao S, Ando T, Shikida M, Sato K: Mechanical properties of a micron-
sized SCS film in a high-temperature environment. J Micromech Microeng
2006, 16:715.
12. Liu F, Rugheimer P, Mateeva E, Savage DE, Lagally MG: Nanomechanics -
Response of a strained semiconductor structure. Nature 2002, 416:498.
13. Wenzler LA, Moyes GL, Beebe TP: Improvements to atomic force
microscopy cantilevers for increased stability. Rev Sci Instrum 1996,
67:4191.
14. Bonderover E, Wagner S: A woven inverter circuit for e-textile
applications. IEEE Elektron Dev Lett 2004, 25:295.
15. Mendelsohn J, Yang SY, Hiller J, Hochbaum A, Rubner MF: Rational design
of cytophilic and cytophobic polyelectrolyte multilayer thin films.
Biomacromolecules 2003, 4
:96.
16.
Nazabal V, Fargin E, Labrugere C, Flem G: Second harmonic generation
optimization in thermally poled borophosphate glasses and
characterization by XANES and XPS. J Non-Cryst Solids 2000, 270:223.
17. Lal S, Grady NK, Kundu J, Levin CS, Lassiter JB, Halas NJ: Tailoring
plasmonic substrates for surface enhanced spectroscopies. Chem Soc Rev
2008, 37:898.
18. Su H, Li Y, Li XY, Wong KS: Optical and electrical properties of Au
nanoparticles in two-dimensional networks: an effective cluster model.
Opt Express 2009, 17:22223.
19. Jiang Q, Liang LH, Zhao DS: Lattice contraction and surface stress of fcc
nanocrystals. J Phys Chem B 2001, 105:6275.
20. Palosz B, Grzanka E, Gierlotka S, Stel’makh S, Pielaszek R, Lojkowski W,
Bismayer U, Neuefeind J, Weber HP, Palosz W: Application of X-ray powder
diffraction to nano-materials - Determination of the atomic structure of
nanocrystals with relaxed and strained surfaces. Phase Transit 2003,
76:171.
21. Qi WH, Wang MP: Size and shape dependent lattice parameters of
metallic nanoparticles. J Nanoparticle Res 2005, 7:51.
22. Qin W, Chen ZH, Huang PY, Zhuang YH: Crystal lattice expansion of
nanocrystalline materials. J Alloy Compd 1999, 292:230.
23. Zhu YF, Zheng WT, Jiang Q: Modeling lattice expansion and cohesive
energy of nanostructured materials. Appl Phys Lett 2009, 95:083110.
24. Tauc J: Amorphous and Liquid Semiconductors Heidelberg: Springer; 1974.
25. Švorčík V, Slepička P, Švorčíková J, Špírková M, Zehentner J, Hnatowicz V:
Characterization of evaporated and sputtered thin Au layers on poly
(ethylene terephtalate). J Appl Polym Sci 2006, 99:1698.
Siegel et al. Nanoscale Research Letters 2011, 6:96
/>Page 8 of 9
26. Švorčík V, Hubáček T, Slepička P, Siegel J, Kolská Z, Bláhová O, Macková A,
Hnatowicz V: Characterization of carbon nanolayers flash evaporated on
PET and PTFE. Carbon 2009, 47:1770.
27. Kaune G, Ruderer MA, Metwalli E, Wang W, Couet S, Schlage K,
Röhlsberger R, Roth SV, Müller-Buschbaum P: In Situ GISAXS Study of Gold
Film Growth on Conducting Polymer Films. Appl Mater Interf 2009, 1:353.
28. Švorčík V, Zehentner J, Rybka V, Slepička P, Hnatowicz V: Characterization
of thin gold layers on polyethyleneterephthalate: transition from
discontinuous to continuous, homogenous layer. Appl Phys A 2002,
75:541.
29. Hodgman CD: Handbook of Chemistry and Physics Cleveland: Chemical
Rubber; 1975.
30. Slepička P, Kolská Z, Náhlík J, Hnatowicz V, Švorčík V: Properties of Au
nanolayers on polyethyleneterephthalate and polytetrafluoroethylene.
Surf Interface Anal 2009, 41:741.
31. Brust M, Bethell D, Kiely ChJ, Schiffrin DJ: Self-assembled gold nanoparticle
thin films with nonmetallic optical and electronic properties. Langmuir
1998, 14:5425.
32. Hunderi O: Optics of rough surfaces, discontinuous films and
heterogeneous materials. Surf Sci 1980, 96:1.
33. Kalyuzhny G, Vaskevich A, Schneeweiss M, Rubinstein I: Transmission
surface-plasmon resonance (T-SPR) measurements for monitoring
adsorption on ultrathin gold island films. Chem Eur J 2002, 8:3850.
34. Mor ID, Barkay Z, Granit NF, Vaskevich A, Rubinstein I: Ultrathin gold island
films on silanized glass. Morphology and optical properties. Chem Mater
2004, 16:3476.
35. Doremus RH: Optical properties of thin metallic films in island form.
J Appl Phys 1966, 37:2775.
36. Mie G: Articles on the optical characteristics of turbid tubes, especially
colloidal metal solutions. Ann Phys 1908, 330:377.
37. Fox M: Optical Properties of Solids NewYork: Oxford University Press; 2003.
38. Hazra D, Datta S, Mondal M, Ghatak J, Satyam PV, Gupta AK: Thickness
dependent lattice expansion in nanogranular Nb thin films. J Appl Phys
2008, 103:103535.
39. Qin W, Nagase T, Umakoshi Y, Szpunar JA: Lattice distortion and its effects
on physical properties of nanostructured materials. J Phys Condens Mater
2007, 19:236217.
40. Bellamy DJ, Clarke PH: Application of second law of thermodinamics and
Le Chateliers principle to developing ecosystem. Nature 1968, 218:1180.
41. Kolská Z, Říha J, Hnatowicz V, Švorčík V: Lattice parameter and expected
density of Au nano-structures sputtered on glass. Mater Lett 2010,
64:1160.
doi:10.1186/1556-276X-6-96
Cite this article as: Siegel et al.: Properties of gold nanostructures
sputtered on glass. Nanoscale Research Letters 2011 6:96.
Submit your manuscript to a
journal and benefi t from:
7 Convenient online submission
7 Rigorous peer review
7 Immediate publication on acceptance
7 Open access: articles freely available online
7 High visibility within the fi eld
7 Retaining the copyright to your article
Submit your next manuscript at 7 springeropen.com
Siegel et al. Nanoscale Research Letters 2011, 6:96
/>Page 9 of 9