Báo cáo hóa học: " Research Article Titan: An Enabling Framework for Activity-Aware “Pervasive Apps ” in Opportunistic Personal Area Networks" pptx
Bạn đang xem bản rút gọn của tài liệu. Xem và tải ngay bản đầy đủ của tài liệu tại đây (5.68 MB, 22 trang )
Hindawi Publishing Corporation
EURASIP Journal on Wireless Communications and Networking
Volume 2011, Article ID 172831, 22 pages
doi:10.1155/2011/172831
Research Article
Titan: An Enabling Framework for Activity-Aware “Pervasive
Apps ” in Opportunistic Personal Area Networks
Daniel Roggen,1 Clemens Lombriser,1, 2 Mirco Rossi,1 and Gerhard Tră ster1
o
1 Wearable
2 IBM
Computing Laboratory, ETH Zurich, 8092 Ză rich, Switzerland
u
Zurich Research Laboratory, Să umerstrasse 4, 8803 Ră schlikon, Switzerland
a
u
Correspondence should be addressed to Daniel Roggen,
Received 24 October 2010; Accepted 31 December 2010
Academic Editor: Arie Reichman
Copyright © 2011 Daniel Roggen et al. This is an open access article distributed under the Creative Commons Attribution License,
which permits unrestricted use, distribution, and reproduction in any medium, provided the original work is properly cited.
Upcoming ambient intelligence environments will boast ever larger number of sensor nodes readily available on body, in objects,
and in the user’s surroundings. We envision “Pervasive Apps”, user-centric activity-aware pervasive computing applications.
They use available sensors for activity recognition. They are downloadable from application repositories, much like current
Apps for mobile phones. A key challenge is to provide Pervasive Apps in open-ended environments where resource availability
cannot be predicted. We therefore introduce Titan, a service-oriented framework supporting design, development, deployment,
and execution of activity-aware Pervasive Apps. With Titan, mobile devices inquire surrounding nodes about available services.
Internet-based application repositories compose applications based on available services as a service graph. The mobile device
maps the service graph to Titan Nodes. The execution of the service graph is distributed and can be remapped at run time upon
changing resource availability. The framework is geared to streaming data processing and machine learning, which is key for
activity recognition. We demonstrate Titan in a pervasive gaming application involving smart dice and a sensorized wristband.
We comparatively present the implementation cost and performance and discuss how novel machine learning methodologies may
enhance the flexibility of the mapping of service graphs to opportunistically available nodes.
1. Introduction
The famous “AppStores” are common nowadays to publish
software (Apps) onto mobile phones. We envision that a similar development of “Pervasive AppStores” will commoditize
the so-called Pervasive Apps. This work proposes a way to
realize this idea. We present Titan, a service-oriented solution
that comprises Internet application repositories storing
applications in the form of dynamically composed service
graphs, a mobile device managing the user’s Personal Area
Network (PAN), and a service graph execution framework
distributing service execution to available resources (sensors,
mobile devices) in the user’s PAN. We focus on activity-aware
applications, applications that use the physical activity of the
user as a contextual source to provide an adapted pervasive
computing experience, sometimes also called activity-aware
computing [1].
For illustration purposes, a typical use case has the user
query the system as to what Pervasive Apps are available
for him. The system, based on the available resources in the
PAN, returns a list of available applications. Finally, once the
user downloads one of the activity-aware Pervasive Apps, this
one will recruit the necessary resources and deliver a new
kind of experience in everyday environments. For instance,
a Pervasive App could suddenly enhance a traditional dice
game by real-time strategic information delivered to the user
triggered by his gestures and game state. Another application
may turn a fitness parkour into an interactive social challenge
by comparing the user’s style and performance to other sport
enthusiasts around the world. However, the real power will
come from the democratization of activity-aware Pervasive
Apps, which will lead to new creative use of the resources
available within the user’s PAN.
1.1. Background. In order to infer the user’s activities,
various sensors on the user’s body, in objects the user
interacts with, and in the close surrounding of the user
provide data which is classified among a set of predefined
2
EURASIP Journal on Wireless Communications and Networking
activities, typically with machine learning techniques [2].
A typical sensor modality is accelerometers, but other
modalities can be used for activity recognition, such as
muscle activity sensing, microphones, or reed switches (see
[3] for an exhaustive list). These sensors are interconnected
into a PAN. Typical activity recognition algorithms include
the steps of signal preprocessing, data segmentation, feature
extraction to reduce data dimensionality, and classification
of the features in a set of predefined output classes (see
Figure 2). This model is the one that is assumed in this work
as it has been widely applied in human activity recognition
in wearable computing (see, e.g., [4–7]).
This work makes two assumptions.
(i) Availability of Resources. Future environments will see
an ever larger availability of readily deployed sensors. These
sensors will be either specifically dedicated to activity
recognition, or they will be foreseen for other uses yet can be
repurposed for activity recognition (e.g., proximity infrared
sensors are typically used to turn on lighting automatically
but can be repurposed to detect static postures from dynamic
movement [8]). Deployment vectors for sensors include, for
example, textile-integrated sensors included in garments [9]
(sensors are already commercially available in some sports
shoes), sensors available in mobile phones, in toys, and in
building automation systems (e.g., to detect door/windows
being opened or closed). Continuous technological advances
further support this ever increasing availability [10].
(ii) Opportunistic Sensor Configurations. While some sensors
may be known to be available (e.g., integrated in all clothings
in the same location and with the same characteristics across
all brands), it is much more likely that in a real-world
deployment of activity-aware systems the nature, type, and
availability of sensors will be highly dynamic and hard to
predict. This will depend on the clothes that the user wears
(different clothes may offer different sensors), the sensorized
gadgets that the user takes with him or leaves behind (e.g.,
mobile phone, hearing instrument, PDA, and sensorized
watch), and his location and surroundings. Typically, different rooms will offer different sensing capabilities. For
instance, a conference room may be equipped with cameras
for video conferencing; manufacturing environments may be
equipped with presence sensors to shut down machinery in
case of danger, while a bed may measure the user’s heart
rate during sleep. Such environments are open ended as they
change over time through upgrades in unpredictable ways.
However, activity-aware applications ought to make best use
of the resources available at run time, rather than demanding
a specific sensor configuration which may be cumbersome
and impractical for the user to replicate day after day (e.g.,
placing a sensor at ever the same on-body location). We refer
to such environments as offering opportunistic sensor configurations. Ongoing research efforts deliver machine learning
tools supporting activity recognition in such opportunistic
sensor configurations [3, 11].
1.2. Challenges. The main challenges that arise for the
“Pervasive Apps” concept are as follows.
(i) Open-Ended Environments. Devices found in open-ended
environment may be built by various manufacturers, using
diverse operating systems, have various capabilities, and be
available in various numbers and types. This availability is
hard to predict and may change over time.
(ii) Just-in-Time Application Adaptation. A consequence
from the above is that various available resources lead to
different activity recognition capabilities and thus allow
different kind of Apps. The Pervasive Apps that are offered
must be a function of the available resources. Furthermore,
some components of the App may need just-in-time adaptation; one sensor and the corresponding machine learning
elements may not be available, yet thay can be substituted by
one or more other modalities. Recent results show that this
type of abstract feature transformations is not uncommon
[12].
(iii) Distributed Processing and Efficient Resource Usage.
Sensor nodes only provide limited processing resources,
power, and communication bandwidth that must be managed efficiently. Distributing activity recognition processing
on the sensor nodes allows to decrease the amount of
data transferred and to best exploit the available resources.
Consequently, the running applications also need to be
dynamically relocated when the the available resources
change.
(iv) Ease of Application Representation. The Apps should be
represented in a way that allows abstracting from the specific
availability of resources at run time in a way that allows
operation with various combinations and substitutions of
run time available resources.
(v) Scalability. In open-ended environments, new application concepts may emerge. A current example is the repurposing of existing resources in urban sensing for new initially
unforeseen applications [13], and similar transformations
must not be excluded in the future. Thus, the system must
allow for some flexibility in the application logic.
1.3. Contribution. In this paper, we present the following.
(i) A review of related work (Section 2).
(ii) We describe Titan, an integrated solution for creating
activity-aware Pervasive Apps (Section 3). Titan is a
framework that uses interconnected services (service
graphs) as a programming abstraction. It links smart
sensor nodes together to collaboratively recognize a
user’s activities and realize Pervasive Apps. Titan thus
realizes distributed service execution on multiple
nodes in a programmer-transparent way. It allows
dynamic remapping of service graphs, when resource
availability change, and service graph replacement at
run-time.
(iii) We characterize the system in a gaming Pervasive
App (Section 4). This application is a pervasive Farkle
EURASIP Journal on Wireless Communications and Networking
3
Application repositories
Smart objects
Mobile phone
Service pool
A
G
C
Service descriptions
D
B
Service pool
F
Service directory
A
D
H I
F
C
E
B
G K
Service summary
E
G
A
H
Executed services
Executed services
A
E
F
G
B
Network manager
E
C
M
D
B
C
D
H
A
E
B C
F
D
G
F
H
G
Alternative
service
J
H
Application template
J
Service mapping
Composed service
graphs
Composed application
Control service
J
Available services
Unavailable service
Downloadable service
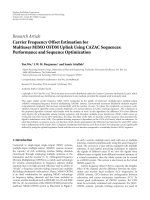
Figure 1: The Titan framework for pervasive applications comprises tiny tasks running on Titan nodes in the PAN (left), a mobile device
(center) and Internet application repositories (right). The network manager on the mobile phone collects device and service information
available in the PAN in its service directory. It provides this information to application repositories on the Internet. These repositories
compose possible applications at runtime and send the resulting service graphs back to the network manager, which maps the services onto
individual nodes for execution.
game (a form of dice game) that is enhanced by
activity recognition. This application involves all the
aspects of Titan. We characterize Titan in terms of
comparative resource usage and performance.
(iv) We discuss the challenges involved in executing activity recognition service graphs in environments where
the availability of sensors cannot be guaranteed. We
discuss how recent machine learning methodologies
geared at activity recognition in opportunistic sensor
configurations can be combined with Titan and
provide it with a greater flexibility in mapping service
graphs to available resources (Section 5).
2. State of the Art
An analysis of context recognition methods based on bodyworn and environmental sensors was carried out in [14]
and favors a streaming processing approach realized by an
interconnection of tasks. This has led to the development of
the Context Recognition Network [15]. This toolbox allows
4
EURASIP Journal on Wireless Communications and Networking
Sensor
data
acquisition
Segmentation
Local
Feature
extraction classification
Decision
fusion
Node 1: wrist bracelet
Mean
Node 3: processing
Acceleration
sensor
Windowing
Node 2: smart cup
Standard
deviation
Classifier
Classifier
Cup tilt service
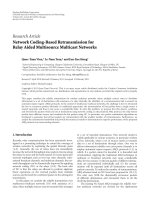
Figure 2: Illustration of a service graph doing “drink detection” from a Titan node placed on a cup and one placed on the wrist. The service
graph is illustrated, together with one particular runtime instantiation of the graph on the sensor network.
the realization of activity recognition algorithms by interconnecting signal processing elements using a simple scripting
language. This system, however, assumes a static availability
of sensors and only allows centralized data processing.
An approach to dynamic reconfiguration of data processing networks on sensor networks is DFuse [16]. DFuse is
a service-oriented approach to data processing. It contains
a data processing layer that can fuse data while moving
through the network. To optimize the efficiency, the data
processing tasks can be moved from one node to another.
DFuse is targeted at devices with typically higher processing
capabilities than most sensor nodes provide. Other serviceoriented approaches include TinySOA [17], that allows to
split queries into service invocations and distributively solves
them, and Tenet [18], which allows to task individual sensor
nodes but allows only communication in a vertical hierarchy.
The Abstract Task Graph (ATaG) [19] with its DART
runtime system [20] allows to execute task graphs in a
distributed manner. The task graph is compiled during
runtime and adapted to the configuration of the network.
DART also imposes high requirements on the hardware.
In our own prior work, we envisioned a lightweight
engine for the execution of streaming data processing task
graphs on sensor nodes [21]. This evolved into the Titan
nodes described in Section 3.2, which is one element of the
complete Titan framework presented here for the first time
to realize Pervasive Apps.
Dynamic reconfigurability was investigated by providing
dynamic loading of code updates in Deluge [22], TinyCubus
[23], SOS [24], or [25]. Dynamic code updates rely on
homogeneous platforms (i.e., the same hardware and OS),
which is unlikely to be the case in open-ended environments.
In addition, dynamic code loading is time consuming and
requires the node to stop operating while the code is
uploaded.
A platform-independent approach is to use a virtual
machine like Mat´ [26]. Applications running in Mat´
e
e
use instructions that are interpreted by virtual processors
programmed onto network nodes. The performance penalty
of the interpretation of the instructions can be alleviated
by adding application-specific instructions to the virtual
machine [27]. These instructions implement functionality
that is often used by the application and execute more
efficiently.
A number of frameworks use a mobile phone as the
core of the system with nodes connected with 1 hop and
a star topology to the phone. BeTelGeuse (gathering and
processing situational data) is a framework geared mostly at
data acquisition from on-body sensors [28].
The SPINE (signal processing in node environment)
framework goes beyond by allowing the rapid prototyping
of activity-aware application on the mobile phone using the
data from motion sensors distributed on the body [29].
SPINE centralizes the data processing on the phone and is
well suited to environments where a design-time-defined set
of sensors are available. It does not, however, allow the runtime instantiation of Pervasive Apps according to the run
time discovered resources, as we envision here.
The SENSEI framework aims to bridge the gap between
the physical world and the future Internet and foresees a
service-oriented approach to query a wide range of physical
device services through Internet [30]. This framework at
this stage focuses on infrastructure and more abstract
interoperability aspects, rather than on the specifics of
Pervasive activity-aware Apps as envisioned here. There may
eventually be a technical convergence with our approach
although the concepts of Pervasive Apps are unique to our
work so far.
The opportunity framework [31] aims at supporting
activity recognition in opportunistic sensor configurations—
sensors which just happen to be discovered and whose availability and kind cannot be controlled [11]. The framework
currently envisions a semantic matching of the resources
to the activities to detect, and a utility-driven planning for
EURASIP Journal on Wireless Communications and Networking
the runtime composition of sensors and signal processing
and machine learning elements. It is geared to allow the
integration of machine learning methodologies developed
for activity recognition in “opportunistic” sensor configurations (see [3] for a summary of recently developed
machine learning techniques in this direction). Again, that
work does not envision Pervasive Apps as introduced in this
paper. However, that work underlines that there is a raising
number of machine learning methodologies available to
perform activity recognition even if the availability of sensors
cannot be defined at design time. These methodologies in
turn support and may be included within the framework
introduced in this paper, especially to enable dynamic
composition and substitution of resources.
The recent development of opportunistic sensing [32]
has led to other frameworks supporting urban sensing,
participatory sensing, and crowd sourcing [13, 33–36].
Overall, existing related works do not address the idea
of deploying Pervasive Apps much in the same way that
currently Apps for mobile phones can be downloaded from
various AppStores. However, these related works support
our efforts. The SENSEI framework shows that there is
ongoing effort to the inclusion of physical devices in a unified
infrastructure, which also benefits our work. SPINE shows
that using mobile device as the main point of a user-centric
experience is a valid approach. The opportunity framework
shows that a number of machine learning techniques are
being developed to support the efficient use of unpredictably
available run-time resources for activity recognition. Work in
dynamic reprogramming, virtual machines, and task-based
streaming data processing led us to select an appropriate
abstraction level for the Titan framework, where we avoid
the too low-level (and hence slow) binary reprogramming in
favor of a higher level representation of activity recognition
as a set of interconnected tasks performing functions of signal processing and machine learning. To our knowledge, the
introduction of the concept of Pervasive Apps, downloadable
to the user’s mobile phone and running using the available
sensor nodes in the user’s PAN, together with the supporting
implementation, is a specificity of our work.
3. The Titan Framework
3.1. Concepts. The Titan framework for pervasive applications is shown in Figure 1 and has the following three
components.
(i) Mobile Device. A mobile device (typically the user’s
mobile phone, but it could also be another kind of wearable
computer) acts as the central point of the system and
the interface with the user. The mobile device discovers
available resources in the user’s PAN. The user can then query
available Pervasive Apps that can be offered with the available
resources. The mobile device offers interaction possibilities
with the user. It is also one instance of a Titan node (see
below) and can similarly execute services (typically those
requiring higher computational capabilities than what is
available on a sensor node). In addition, it allows for dynamic
5
service download (in the form of Java code). Such services
typically form the core logic of the Pervasive Apps.
(ii) Internet Application Repositories. Application templates
are hosted on Internet application repositories. They are
represented by a set of interconnected services, which are
required to be present in the user’s PAN for the application to
function. Substitution between services as well as alternative
implementations are also provided to best exploit available
resources. The composition of the effective service graph
to instantiate is also carried by the Internet application
repositories according to available resources.
(iii) Titan Nodes. This is the sensor networking part of
Titan. It consists of firmware on the sensor nodes of the
network. It allows the instantiation, reconfiguration, and
execution of interconnected services on the sensor nodes,
together with the communication in the network and with
the mobile device. It essentially realizes the distributed
execution of activity recognition algorithms represented as
interconnected services in the PAN of the user. It is built
upon TinyOS—a common sensor network operating system.
The process of finding suitable Pervasive Apps is shown
in Figure 1. The top part shows the PAN of the user and
the Titan nodes (in objects or on the body). The mobile
phone runs a service directory, which acts as a database for
the services available in the service pools of the Titan Nodes.
Upon querying an application, the service directory’s content
is sent to application servers on the Internet to determine
possible applications for the given PAN configuration.
Typically, services offered by sensor nodes are in relation
to the typical use of the elements in which they are
embedded. However, it is important to note that custom
Titan Nodes can be programmed (statically) with custom sets
of services and these services may be of various complexity.
Figure 2 is an example, where nodes 1 and 2 contain
sensors. Node 1 is a motion sensor placed on the wrist.
It provides services delivering low-level information (raw
acceleration). A typical activity recognition chain consists
of sensor data acquisition, segmentation, feature extraction,
and classification. Here, node 1 has been instructed to
execute a service subgraph that splits the sensor data in
windows, computes mean and standard deviation features,
and locally classifies these features to indicate whether the
gesture correspond to a movement of the hand going to
the mouth. Node 2 on the other hand is a smart cup
that provides a manufacturer-supplied high-level service that
directly delivers detected activities, such that the cup is tilted.
Here, no other services are used internally within the node
because a specific sensor (e.g., a tilt sensor) delivers readily
usable information. Node 3 is only capable of processing. It
receives data across the network from the first two nodes and
does decision fusion by correlating movements of the wrist
with the tilting of the cup to detect that the user’s gesture
corresponds to drinking from the cup. The communication
between services within a node or across nodes is handled
transparently by Titan and is hidden from the programmer.
While in this work we describe sensor nodes programmed with general purpose services composed to the
6
EURASIP Journal on Wireless Communications and Networking
application scenario’s needs, we envision in a future perspective that some services in sensor nodes will be provided
by manufacturers of components of ambient intelligence
environments.
3.2. Titan Nodes. Titan defines a programming model where
applications, such as activity recognition applications, are
described by an interconnected service graph. We refer to
Titan Nodes as the nodes of the wireless sensor network
that contain the Titan firmware, built on TinyOS [37]. The
Titan nodes form the sensor networking component of the
Titan framework. They allow the run-time instantiation of
distributed applications represented as service graphs. Each
Titan node typically executes a subgraph of the entire service
graph making up the application.
The architecture of the Titan nodes is shown in Figure 3,
and its elements are as follows.
3.2.1. Services and Service Pool. Titan nodes provide a
set of services stored within a service pool. Services can
implement signal processing function, classification tasks,
sensor readout, or other kinds of processing. Not all Titan
nodes implement the same kinds of services. For instance,
nodes that do not contain sensors would not offer sensor
readout services, while nodes with higher computational
capability may offer more computationally intensive services.
Services are flashed into the Titan nodes at design time.
Services have a set of input ports, from which they read
data, process it, and deliver it to a set of output ports.
Connections deliver data from a service output port to a
service input port and store the data as packets in FIFO
queues.
The services go through the following phases when they
are used.
(1) Configuration. At this point, the service manager instantiates a service. To each service, it passes configuration data,
which adapts the service to application needs. Configuration
data may include, for example, sampling frequency and
window size in signal processing services. The service can
allocate dynamic memory to store state information.
(2) Runtime. Every time a service receives a packet, a callback
function is executed to process the data. Titan provides the
service with the state information it has set up during the
configuration time. Services are executed in the sequence
they receive a packet, and each service runs to completion
before the next service can start.
(3) Shutdown. This phase is executed when the service
subgraph is terminated on the node. All services have to free
the resources they have reserved.
3.2.2. Service Manager. The service manager is the system
allowing to reconfigure a Titan node. It instantiates the executed services according to the network manager’s requests
(see Section 3.3). The service manager is responsible for
reorganizing the service subgraph executed on the local
sensor node during a reconfiguration.
3.2.3. Dynamic Memory. The dynamic memory module
allows services to be instantiated multiple times, and reduces
static memory requirements of the implementation. The
services can allocate memory in this space for their individual
state information. This module is needed as TinyOS does not
have an own dynamic memory management.
3.2.4. Packet Memory. The Packet Memory module stores
the packets used by the services to communicate with each
other. The packets are organized in FIFO queues, from which
services can allocate packets before sending them. This data
space is shared among the services.
3.2.5. Connections. Packets exchanged between the services
carry a timestamp and information of the data length and
type they contain. Services reading the packets can decide
on what to do with different data types. If unknown data
types are received, they may issue an error to the service
manager, which may forward it to the network manager to
take appropriate actions.
To send a packet from one Titan Node to another, Titan
provides a communication service, which can be instantiated
on both network nodes to transmit packets over a wireless
link protocol as shown in Figure 4. During configuration
time, the communication service is told which one of its
input ports is connected to which output port of the
receiving service on the other node. The two communication
services ensure a reliable transmission of the packet data.
The communication service is automatically instantiated by
the network manager to distribute a service graph over
multiple sensor nodes. Thus, for the programmer, there is no
distinction when a service graph is mapped on one or more
Titan nodes.
The recommended maximum size of a packet for Titan
Nodes is 24 bytes, as it can easily be fitted with 5 bytes header
into a TinyOS active message. The active message is used
to transmit data over wireless links and offers 29 bytes of
payload.
3.2.6. Service Manager and Service Discovery. A programmer
designs his application by interconnecting services in the
form a service graph. Service parameters as well as location
constraints can also be defined.
The mapping of a service graph into executed services
is controlled by the network manager. In order to support
the network manager, the Titan nodes answer to broadcast
service discovery messages originating from the network
manager by providing a list of matching services available in
the service pool and by providing status information about
the node.
The network manager then decides on a partitioning of
the full service graph realizing the application and provides
the service manager of the Titan nodes with the specific
subsets of the service graph to instantiate.
EURASIP Journal on Wireless Communications and Networking
7
Mobile device
Titan node
Service pool
Network
manager
A
Service manager
D
B
Service
directory
G
C
Packet memory
Dynamic memory
Executed services
A
B
C
D
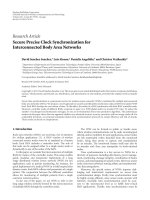
Figure 3: Main modules of the Titan Nodes (right). The arrows indicate in which direction functions can be called. The network manager
in the mobile device can control the instantiation of service graphs by communicating with the Service Manager of the Titan Node.
Mobile device
Node 1
Service graph
A
Service pool
A
B
Executed services
A
B
D
B
Service
manager
C
COM
F
E
Node 2
Service pool
B
D
COM
C
C
D
Network manager
Service
manager
COM
Executed services
Figure 4: Mapping of a service graph (whose definition resides in the mobile device) onto the Titan nodes. Parts of the service graph are
configured onto each participating node, depending on their sensors or computational capabilities. Interconnections across sensor nodes
are realized over automatically inserted communication services.
When data needs to be exchanged across nodes, communication services (see Section 3.2.5) are automatically
inserted. The resulting service subgraphs containing the
services to be executed on every sensor node are then send
to each participating node’s service manager, which takes
care of the local instantiation as shown in Figure 4. After the
configuration has been issued, the network manager keeps
polling the Service managers about their state and changes
the network configuration if needed. On node failures,
the network manager recomputes a working configuration
and updates the subgraphs on individual sensor nodes
where changes need to be made, resulting in a dynamic
reorganization of the network as a whole.
3.2.7. Synchronization. When sensors are sampled at two
sensor nodes and their data is delivered to a third node for
processing, the data streams may not be synchronized due to
differing processing and communication delays in the data
path. As a consequence, a single event measured at the two
nodes can be mistaken for two.
If the two sensor nodes are synchronized by a timing
synchronization protocol, a timestamp can be added to
8
EURASIP Journal on Wireless Communications and Networking
the data packet when it is measured. The data streams
can then be synchronized by matching incoming packets
with corresponding timestamps. Timing protocols have been
implemented on TinyOS with an accuracy of a few 10 µs
[38, 39].
If the two sensor nodes are not synchronized, the sensor
data can be examined as in [40]. The idea is to wait until
an event occurs that all sensors can measure, for example,
a jump for accelerometers on the body. Subsequent packets
reference their timestamp to the last occurrence of the event.
This functionality is provided in the Synchronizer service.
3.3. Mobile Device. The mobile device is the interface
between the user, the sensor network, and the Internet
application repositories. The mobile device contains a network manager that controls the mapping and execution of
the service graph on the Titan nodes, a service directory
that contains a list of all available services discovered in
the PAN, and a set of service graphs (representing various
applications) waiting to be mapped to the sensor network.
In addition, it can execute custom application logic services
downloaded from the Internet application repositories, in
the form of Java code.
3.3.1. Mapping Services to Network Nodes. When the execution of a specific service graph is requested, the network
manager first inspects the capabilities of the sensor nodes in
the environment by broadcasting a service discovery message
containing a list of services to be found. Every node within
a certain hop-count responds with the matching services it
has in its service pool. From this information, the network
manager builds the service directory.
The network manager then optimizes service allocation
such that the overall energy consumption is minimized. For
this purpose, it uses a metric summing up the main energy
consumers, namely wireless communication, sensors and
actuators, and the processing resources needed. The result
of this allocation is communicated to the service manager of
the concerned Titan nodes in the form of service subgraphs.
Each node typically receives a subset of the overall service
graph, thereby leading to a distributed execution of the entire
service graph on multiple Titan nodes.
The Service Manager on the Titan Nodes then takes care
of the service instantiation and that the data generated by
one service is delivered to the next service according to the
specification of the service graph. This occurs transparently,
such that individual services are not aware of whether the
next service is executed locally or whether the data first has
to be transmitted to another sensor node.
Titan nodes can also invoke at run time the network
manager to ask for reconfiguration (e.g., if battery runs
low). During the execution of the service graph, the network
manager monitors the network via the service manager on
the Titan nodes to determine whether problems occur. In
case a node fails, a new mapping of the service graph can
be issued.
The task of the network manager is formally described
as to map a service graph A = (T, I), where T is the set of
services, and I = (ti , t j ), ti , t j ∈ T is the interconnections
between them, onto a network graph G = (V , E). The
network graph is described by a set of nodes V and
communication links E = (vi , v j ), vi , v j ∈ V . The network
manager’s goal is to find a mapping M : T → V , such that a
given cost function C(M) is minimized.
Various cost functions targeting different tradeoffs have
been proposed for such a task, such as the minimization of
transmission cost, total energy consumed, or the maximization network lifetime [41]. We use here a metric targeting
minimization of the total energy used in the network.
The cost function makes use of a model of the sensor
node using values stemming from benchmarking the Titan
implementation on real sensor nodes (see Section 4 and
[21]) with a TI MSP430 microcontroller and a CC2420
transceiver. The metric used for the evaluation relies on three
main cost functions.
(i) Processing Cost C p (t, v). The cost of processing service
t on node v. This cost results into a measure for whether
enough CPU cycles are available to execute all services of
the subset assigned to the given node. To achieve an energy
value, the time for processing on the nodes’ microcontroller
is determined and multiplied by the power consumption
difference from active to standby mode.
(ii) Sensor Cost Cs (t, v). The cost of using sensor s required
by service t on node v to collect data for the algorithm. As
sensors can usually be turned off when not sampling, this
cost value describes the additional energy dissipated on the
node while sampling and includes possible duty cycling.
(iii) Communication Cost Cc (i, v, e). The cost of communicating data from one service to another for the node v. The
communication cost is zero for two services communicating
within the same node. For external communication, it prioritizes intracluster communication and introduces penalties
for cross-cluster communication. The cost is determined per
message and includes energy dissipated at the sending and
receiving part.
The mapping is constrained by the maximum processing
power C p,max (v) and communication rate Cc,max (v) a node
can support. These limits ensure the executability of the tasks
on the nodes and guarantee that the maximum transmission
capacity is not exceeded without modeling node load and
scheduling overhead explicitly. Consequently, there is no
guarantee on whether latency requirements on the algorithm
can be met. The constraints are given for the service graph
subset (Tv , Iv,e ) assigned to a node v ∈ V :
t ∈Tv
i∈Iv,e
C p (t, v) ≤ C p,max (v),
Cc (i, v, e) ≤ Cc,max (v).
(1)
Each interconnection i is mapped to an edge e and
added to two sets (i, e) ∈ Iv,e as outgoing and incoming
connections. Failure in meeting the constraints results in the
EURASIP Journal on Wireless Communications and Networking
service graph not being implementable. In such a case, the
execution cost will be set to infinity.
The total execution cost of the network is achieved by
summing up all costs incurring at nodes participating in the
execution:
Ctotal (M(A, G)) =
Tv ∈T t ∈Tv
C p (t, v) + Cs (t, v)
+
Ie,v ∈I i∈Ie
Cc (i, v, e).
(2)
The costs introduced above depend on the device type
to which they apply. The parameters for the device model
and service models are sent to the service directory along
with the node address upon service discovery. The service
model in particular includes a mapping to determine the
output data rate given a certain input data rate and the
service parameters in the service graph description. When
determining execution cost, the network manager first
derives an estimation of the data communicated from service
to service by propagating the data rates generated from each
service to each successor. The individual cost functions make
use of the service models and device models to produce the
total mapping cost.
The contributions of the individual cost components
vary with the application that is executed and the network it
is running on. Typically, communication costs dominate, as
for the energy of sending 1 bit over the air, a microcontroller
can perform roughly 1000 instructions [42] for the same
energy. Sensor costs on the other hand are usually constant
as long as the actually used sensors have similar energy
consumption per sample. The mapping thus tries to keep
communication intensive connections between services on
a single node. In most application, this means to draw as
much processing as possible to the data source, as processing
in most cases reduces the communication rate. In the
case of activity recognition algorithms, this means that the
processing such as data filtering and feature extraction is
preferably run on the Titan node containing the sensors.
An exhaustive search of the best mapping is intractable
for service graphs and networks of moderate size, as the
search space grows with O(n|T | ) (see [43]). Therefore, we use
a genetic algorithm (GA) to optimize the mapping, as GAs
are known to provide robust optimization tools for complex
search spaces [44]. The GA parameters are selected in order
to favor convergence to the global maximum by selecting a
large population size, avoiding premature convergence, and
by performing several runs. The resulting performance is the
maximum of the performance obtained in each runs.
The service graph is encoded for the GA as chromosome
with |T | genes, one for every service in the service graph.
Each gene contains the set of nodes in the network providing
the corresponding service. Mutations are applied by moving
services from one node to another. Crossovers arbitrarily
select two chromosomes, randomly pick a gene, and swap the
gene and all its successors between the two chromosomes,
which are then added to the population. The fitness of the
chromosomes is evaluated using the cost metric given above.
9
Once the implementation of the service graph with the
lowest cost has been found, the service graph subsets are
sent to the individual network manager of the Titan nodes
for execution. Additional aspects related to modeling and
convergence speed are discussed in [43].
3.3.2. Application Logic as Services. The logic of Pervasive
Apps is likely unique to each application. Thus, it does not
lend itself to be realized by generic services, such as the ones
provided by Titan nodes. In order to enable for a large variety
of Pervasive Apps, Titan allows for application repositories to
download application-specific services to the mobile device,
in the form of Java code (this is the “control service” in
Figure 1).
This Java code can access to all the features of the mobile
device (usually a mobile phone), such as screen, touch input,
audio output.
In other respects, the downloaded Java services follow
the same service model as the Titan nodes and can interact
with them. Thus, the service running on the mobile device
forms part of the service graph describing the application,
exactly like any other sensor node. In particular, the Java
services have access to packet communication methods to
exchange data with the other services running on the Titan
nodes. Since the Titan nodes use an 802.15.4 radio, we
have built a custom Bluetooth to 802.15.4 gateway to allow
communication between the mobile device and the Titan
nodes. The Java service thus communicates over Bluetooth to
the gateway, and the gateway relays the data to the 802.15.4
interface.
The Titan network manager additionally provides a Java
API that can be used by the Pervasive App to dynamically
reconfigure the network with new service graphs. This allows
tailoring the processing to the current Pervasive App state
and turning unneeded sensors to low-power states.
3.4. Internet Application Repositories. Upon query by the user
for available Pervasive Apps, the mobile device transfers the
content of the available services in the user’s PAN (i.e., the
service directory) to the Internet application repository. The
Internet application server then returns the applications that
are possible given the available services and composes at run
time the service graph to be effectively executed.
The application servers are databases storing application
templates as service graphs. These templates use services that
may or may not exist in the PAN. Each individual service
in the application template may have multiple, functionally
equivalent implementation possibilities involving one or
more services. For instance, if a sensor node is not capable of
executing an FFT, features such as zero crossings and amplitude range might be used instead. At runtime, the application
servers use service composition algorithms to create a feasible
application by combining libraries of template service graphs
in their database. An efficient implementation has been
shown in [45]. Figure 1 shows one example application
template containing a service M, which is not available in the
PAN. Consequently, it is replaced by a functionally equivalent
service graph containing the services E, F, and G, which are
all available in the service pool of the smart dice.
10
EURASIP Journal on Wireless Communications and Networking
Another way for replacements to be possible is to allow
the addition of new services to the service pool at runtime,
for example, by means of wireless reprogramming or virtual
machines. In this case, the application server may offer
to download a particular service rather than compose its
alternatives. This feature is especially useful for applicationspecific services which are not easily modeled by generalized
services. This is usually the case for the main application
logic. We use this approach in Section 4 to download a
specific Java monitoring service to the mobile phone.
A composed application consists of one or more service
graphs and a control service (application logic). The control
service runs on the mobile device and instructs the network
manager when to exchange the service graph currently
executed in the PAN for another one. Using multiple service
graphs in an application allows restricting the processing to
only what is needed in the moment and turning sensor nodes
that do not participate into power save mode until they are
needed again.
4. System Evaluation on
an Activity-Aware Farkle Game
4.1. Pervasive Farkle App Description. We base the system
evaluation on an exemplary activity-aware application: a
pervasive Farkle game: A number of children meet on the
schoolyard and decide they want to play a game with smart
objects surrounding them and their on-body sensors. The
children discuss different possible games but do not come
up with one they all like and decide to consult their mobile
phones to ask it for game suggestions. The mobile phone
contacts an application server on the Internet, describes the
smart objects in its environment, and asks for suggestions
for applications in the category “Games.” The server finds
that there are six smart dice lying on the ground, and
that all children are wearing wristbands with acceleration
sensors. It therefore proposes to play “Yahtzee” or “Farkle,”
two dice games played with five and six dice. The children
download the Farkle application to their mobile phone,
which then configures the environment for the game. During
the course of the game, the smart dice recognize how they are
manipulated during each throw. Namely, they detect being
picked up, shaken, and thrown together with data from onbody sensors to identify which objects are held by whom.
Then they communicate their eye count when they lie still.
By correlating their movements with the other dice and the
sensor-enabled wristband of the player, the smart dice can
identify the player using them, thus enabling multiple players
to play the game simultaneously. The game state is monitored
by the mobile phone. It receives the actions from the dice,
keeps the score, and tells the players whose turn it is next. As
it is the first time they play the game, suggestions on strategy
or rule explanations are delivered just when they are useful.
The scores as well as the current throw state are displayed
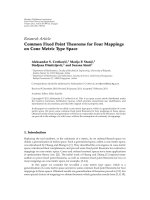
on the device’s screen as shown in Figure 5. Thus, except for
the selection of the game, all interactions with the technology
occur naturally with physical objects.
The game presented here could be realized by transmitting all data sensed by the smart objects to the mobile
phone and processing it centrally. However, this would
produce an unnecessary high load on the wireless network,
leading to scalability problems and drawing more power than
needed from the smart objects’ batteries. Preprogramming
the recognition algorithms onto the sensor nodes may be
another solution, but it needlessly restricts the breadth of
applications for which the smart objects can be used. With
the Titan framework, a scalable and composable deployment
of the applications in pervasive environments is enabled.
Below, we describe the implementation of the game and
characterize it.
4.1.1. Internet Application Repositories. The dice game service graph is composed at runtime by the application server
and involves only the dice that are available on the schoolyard
at the moment (see Figure 6).
The activity recognition part of the game is represented
by service graphs which are executed in a distributed manner
in the network. Within the same game, four unique service
graphs are designed to recognize one of the game states: dice
pickup, shaking, throwing, and scoring. While this could be
realized by a single service graph, by using multiple service
graphs we capitalize on the dynamic reconfiguration capability of Titan to minimize the number of resources used at
any time point in the activity recognition process. Reducing
the number of resources used for activity recognition is a key
to enhance the sensor network operating time [46]. The core
logic of the Farkle game is a downloadable service in Java that
is run on the mobile phone (Farkle game service). It receives
the output of the service graphs, keeps the game scores and
player sequences, and instructs the network manager which
service graph to load next (i.e., when a dice is thrown, the
next instantiated service graph is the one doing scoring).
4.1.2. The Mobile Phone. When the game is started by the
players, the network manager on the mobile phone starts
the Farkle game control service, which in turn instructs
the network manager to map and execute the first service
graph on the smart objects according to the mechanisms
described before. The Titan framework then takes care of
service instantiation and that data generated by one service
is delivered to the next service according to the specification
of the service graph. This occurs transparently, such that
individual services are not aware of whether the next service
is executed locally or the data first has to be transmitted to
another smart object. The Farkle control service receives the
results of the service graphs running on the smart objects
and decides when the game progresses from one state to the
next. When this occurs, it instructs the network manager to
exchange the current service graph for a new one. During
the execution of the service graph, the network manager
monitors the network to determine whether problems occur.
In case a node fails, it may issue a new mapping of the
service graph and update the participating smart objects’
configurations.
4.1.3. Titan Nodes. Ideally, the Titan nodes recognize individually what is happening to them. Thus, data acquisition, segmentation, feature extraction, and classification are
EURASIP Journal on Wireless Communications and Networking
11
(a)
(c)
(b)
Figure 5: Two children wearing wristbands (a) playing the dice game with the smart dice (b). The game score is automatically updated on
the mobile phone’s screen (c). Titan nodes with accelerometers are worn on the wrist (a) and integrated in the dice (b).
completed on the smart objects and wristband for the local
sensing modalities. By only communicating their perceived
context, the communicated data volume is reduced. A
network classifier can fuse those reports to get a global view
of the situation (see, e.g., [46]).
The Titan nodes in the Farkle game feature three axis
acceleration sensors integrated into the dice and in the
children’s wristbands. Those acceleration sensors are used to
determine the four states of a player’s throw: picking up the
dice, shaking them, rolling, and determining their score. For
each of the states, the Farkle game control service adapts the
executed service graphs, such that only the wrist sensors and
the dice that have been picked up are used. All nodes sample
the data at 20 Hz and process the data locally as explained
below.
The game is decomposed in four different stages. In each
stage, service graphs on the Titan nodes perform local sensor
data processing and notify the Farkle game service of relevant
events, such as the completion of a stage. The Farkle game
service then reconfigures the service graphs on the Titan
nodes to enter the next stage. Here, each stage corresponds
to a different activity recognition task. Figure 6 illustrates
the game stages, the service graphs mapped on the sensor
nodes when a player chooses to throw two dice, and the
corresponding service graphs executed on the smart objects
and on the wristband.
picked up the dice. The indication of who has picked up
the dice is sent to the Farkle game service. This information
is used to monitor that the game rules are appropriately
followed. If the wrong player picks up the dice, a message is
displayed on the screen and the application asks the players to
restart the turn by throwing the dice anew. If the right player
has picked up the dice, the Farkle game service reconfigures
the Titan nodes with the service graphs to recognize the next
activities.
Stage 1. The first game state configures the wrist sensor of
the current player to determine whether the player reaches
down to pick up a dice. This event is broadcasted to the smart
dice. The smart dice periodically sample their acceleration
sensors using an acceleration service to detect whether they
are moved by a variance and threshold service. The decision
tree service shown in Figure 6 runs on the smart dice and
reports to the mobile phone when the pickup and moving
events coincide. Correlation between the pickup movement
and the movement of the dice indicates which player has
Stage 4. The final state determines the eye counts of the dice
from the measured gravity vector. The corresponding eye
count is forwarded to the Farkle game service, which determines the throw’s best scoring combination and identifies
which player’s throw is next. The state sequence then starts
anew. The recognition of the eye count uses a decision tree
classifier as well. It classifies the static acceleration sensed
by the Titan node in the dice into a set of 6 output classes
corresponding to the eye count. The classification result is
sent to the Farkle game service.
Stage 2. The second state of the game determines whether
the dice are jointly shaken by the same player, allowing
multiple people to play simultaneously. Only the dice shaken
together with a player’s wrist are used to follow that player’s
score. This detection is realized by computing variance and
zero crossing rate of the acceleration on the dice and player’s
wrist, and classifying this into a binary decision indicating
whether a specific dice is shaken by a specific person. This is
notified to the Farkle game service.
Stage 3. The third state waits for the end of the rolling
motion of the dice. This is done by extracting the variance
of the acceleration signal within a window (a measure of the
energy of the acceleration related to the movement of the
dice). A comparison to a trained threshold indicates whether
the dice is moving or has stopped. Once the dice reaches a
standstill, the Farkle game service is notified.
12
EURASIP Journal on Wireless Communications and Networking
Picked up
6
Shaken Shaken
Reconfiguration
Still
Reconfiguration
Still
Score Score
Reconfiguration
Dice 1
Dice 2
4
Acceleration (g)
Picked up
2
0
−2
−4
−6
0
5
10
Time (s)
Pick up dice
15
Roll dice
Shake dice
acc
acc
acc
var
mX mY
var
thr
dt
acc
thr
zx
var
acc
zx
dt
farkle
var
acc
zx
var
var
thr
acc
dt
farkle
dt
farkle
acc
Acceleration
var
Sensors
Decision tree
classifier service
acc
dt
farkle
Not
moving
Score
acc
thr
var
acc
dt
dt
20
Variance
Dice
Moving
Nothing
Nothing
Wrong
player
Features
Wrist
Zero
zx crossings
Picking up
Picked
up
mX x-axis mean
thr Threshold
Classifiers
dt
Controllers
farkle
Decision tree
Farkle game control
Figure 6: Illustration of the four Farkle game states, including the user action (top), the acceleration signals recorded on two dice for one
throw (middle), and the individual service graphs for each game state (bottom). Every service is customized for the Farkle game state, as
shown on the example of a decision tree service.
EURASIP Journal on Wireless Communications and Networking
4.2. Implementation Results. We have implemented the complete Farkle game presented above including an application
server, a network manager on a mobile phone, six dice with
integrated wireless sensors, and a wrist worn wireless sensor.
We evaluated the performance of the Titan framework in
terms of resource use, reconfiguration times, transmitted
data volume, and context recognition accuracy.
We have used an HTC P3600 mobile phone featuring a
Samsung SC32442A processor at 400 MHz with 64 MB RAM
to run a Java implementation of the Titan network manager,
service directory, and to download and run the Farkle game
control service. The six dice devices measured acceleration
using an ADXL330 3-axis MEMS accelerometer sampled by
a TI MSP430F1611 microcontroller running at 8 MHz and
providing 10 kB RAM. The wireless link was provided by a
Chipcon CC2420 transceiver implementing IEEE 802.15.4.
The mobile phone connected to the smart objects uses a
custom Bluetooth to IEEE 802.15.4 gateway.
4.2.1. Application Instantiation Results. Downloading the
Farkle game description including the Farkle game control
service and the service graphs from the application server
via HTTP required 38.9 kB of data transfer. In our office,
it took on average 17 seconds to obtain it using an HSDPA
connection. The reconfiguration time of a single node has
been measured using a minimal service graph involving a
counter and an LED display service. This service graph is
encoded in 20 bytes and fits into a single configuration
message. The resulting reconfiguration time averages at
106 ms and involves the transfer of a configuration message
from the mobile phone over the gateway to the smart object,
reconfiguration, and a confirmation message in return.
Reconfiguring the node itself takes 650 µs. The execution
times of individual services on smart objects range between
a few microseconds and several milliseconds (see Section 4.3
for details for individual services). The most complex service
graph of the Farkle game involves 41 services to recognize
“shaking” for all 6 dice. Mapping it to the BAN takes
3.5 seconds while the complete switching time including
wireless reconfiguration amounts to 4.4 seconds. Titan’s
reconfiguration time is short enough to be useful for user
interaction applications. The recognition algorithms can
focus on the few activities of interest in the current state and
reconfigure for other activities when the state changes. The
activities that should be recognizable after reconfiguration
need to be detectable for longer than the reconfiguration
time of the new service graph, which is in Farkle a maximum
of 4.4 seconds.
4.2.2. Activity Recognition Performance. We characterize the
most difficult activity recognition state of the game: “shake
dice,” (performance of Stages 3 and 4 is close to perfect as
they consist of significantly simpler classification services).
In the “shake dice” the wrist sensor and all dice picked
up in the previous state sample their accelerometer at 20 Hz
and detect correlated shaking. The data is segmented in
3-second windows with an overlap of 50 samples. Three
features, mean, variance, and zero crossing rate are computed
13
on the magnitude of the 3-axis acceleration. One dice sends
its three features once per window to all other participating
dice. Each dice then combines the received data to their
own locally computed features into a feature vector that is
classified with a decision tree to determine common motion.
Executing the service graph on the MSP430 takes 4.88 ms
after each sample, and 7.44 ms for feature calculation and
classification when a window is complete. Using a dataset
of 99 minutes of correlated and uncorrelated shaking of
different frequency and amplitudes by five different subjects
and performing a 5-fold crossvalidation, we reached an
average accuracy of 83.8%. Better results were obtained using
signal correlation as feature, which achieved an accuracy
of 91.3. However, using correlation requires transmitting
the complete 20 Hz magnitude data from the wrist to the
dice instead of just transmitting three feature values every
2.5 seconds. It would thus increase the communicated data
volume by a factor of about 10. A network classification
using window features has also the advantage of needing less
accurate synchronization between the sensors. In our tests,
the shaking detection accuracy decreased by 12.8% when
using correlation as feature and signals were misaligned by as
few as 5 ms. For a similar misalignment, the window-based
feature classification on the other hand decreased by only
0.1%.
4.2.3. Data Volume. In a centralized solution, all nodes
constantly transmit their 20 Hz samples to a central node
where all processing is done. In the distributed solution on
the other hand, the wrist broadcasts its features once per
window period directly to the dice, which then report their
classification result to the central node. This reduces the
transmitted data volume for n dice by a factor of
q=
(1 + n) · sample rate · window size · window shift
.
(features + n)
(3)
For n = 6 dices, this amounts to a very significant (1 +
6) · 20 · 3 · 0.5/(3 + 6) = 210/9 reduction in data transfer.
This significantly reduced bandwidth need enables the
smart objects to use low-power communication with lower
bandwidth as they only transmit events instead of continuous data streams. An important observation is here that
using direct communication from the wrist to the dice
reduces the required bandwidth by a factor of 2.3. This shows
that a mesh topology here has an advantage over the usually
chosen star topology for BAN.
4.3. Low-Level Titan Node Characterization. The efficiency of
the distribution and execution of processing on the Titan
nodes is key to the computational performance of Titan
applications, given the limited capabilities of most sensor
nodes.
We have characterized in Tmote Sky motes [47] running at 4 MHz the low-level implementation of the Titan
firmware. The characterization includes internal functions
14
EURASIP Journal on Wireless Communications and Networking
Table 1: Memory footprints (bytes) in the Tmote Sky sensor node.
The Tmote Sky module provides 48 k ROM and 10 k RAM.
Platform
TinyOS∗
TinyOS with Deluge
Mat´
e
Titan firmware
dynamic memory
packet memory
ROM
16520
26896
37004
35024
RAM
541
1089
3146
1422
+4096
+1440
∗
As distributed with Tmote Sky modules, and instantiating the Main,
TimerC, GenericComm, LedsC, and ADCC components.
Table 2: Cycle count of the most important titan interface
functions.
Interface function
paste Context
get Context
alloc Packet
send Packet
has Packet
get Next Packet
Transfer 1 packet (avg)
Cycles
85
145
370
290
25
425
1026
Time (µs)
16
28
70
55
5
81
195
provided to services, some of the common signal processing services used for activity recognition, and nodelevel reconfiguration time (within a single Titan node). The
implementations are compared (when available) to a plain
TinyOS implementation, to the virtual machine Mat´ , and
e
to the code distribution framework Deluge.
The memory footprint of the implementation of Titan
is listed in Table 1. While these numbers are specific to the
platform we used, they provide an indication of the relative
size of the Titan implementation compared to other systems.
The space reserved for dynamic and packet memory
RAM can be tailored to the needs of the application and the
resources on the node. The service number and type in the
service pool on the node determines the amount of ROM
memory requirement and can be adapted to the platform
as well. The memory footprint shown in Table 1 includes all
Titan services as listed in Table 3.
Table 2 lists the execution time for the most important
functions Titan offers to the services. All times have been
measured by toggling a pin of the microcontroller on the
Tmote Sky. The average packet transfer is measured from the
point where the sending service calls the sending function to
the time where the receiving service has retrieved the packet
and is ready to process its contents. This time is roughly
200 µs. For the recognition of movements, acceleration data
is usually sampled at less than 100 Hz [48], which leaves the
services enough time for processing.
Table 3 shows some of the currently available services for
Titan. The execution times given in the table indicate how
long each service needs to process a data packet of 24 bytes,
which is the recommended Titan packet size as mentioned in
Section 3.2.5.
Most service execution times are in the range of a few
hundred microseconds, which shows that a service network
has enough time to execute when using a sampling frequency
of 100 Hz. Even a Fast Fourier Transform (FFT) can be
performed over 128 samples in 180 ms, leaving 86% of the
sample time for processing. Whether a whole service network
can process the sampled data in real-time needs further
analysis. If the sensor data is sampled with a frequency of
fADC and the recorded samples are issued in packets of NADC
samples, the time left for processing of the local service
network is
Tfree NADC , fADC =
NADC
− NADC · tsample − tADCMsg , (4)
fADC
where tsample is the time needed by the sensor to sample one
sample, and tADCMsg is the time needed to issue a packet.
The time needed for the processing of the data, that is,
executing the service network is determined by the execution
time Ti of the allocated services with their configuration Di
and the number N p of messages exchanged, which needs the
time t p ,
⎛
Tused (T) = N p · t p + ⎝
∀i∈T
⎞
Ti (Di )⎠ + O(T).
(5)
The TinyOS scheduler overhead is included by the O(T)
function. The execution of the service network is thus feasible
if the following inequality holds true:
Tused < Tfree .
(6)
In a heterogeneous network, the times needed to execute
a service differ from node to node, such that an adaption
of the times is needed. This can be done by a simple factor
as proposed in [14], where every node indicates a speed
grade that is multiplied with the service execution time. A
more exact approach would be to store a service execution
time table on every node, which the service manager uses to
determine whether the assigned service network is actually
executable.
To analyze the time of a reconfiguration, we have
configured a node with a service subgraph containing a
counter service that increments every second and sends its
data to the LED service, which shows the counter value on
the Tmote’s LEDs. The service subgraph description has a size
of 19 bytes and fits in a single configuration message. Table 4
shows times needed from the reception of the configuration
message to the point where the service subgraph runs. The
reconfiguration time of a single node is negligible compared
to the download and mapping times of a Pervasive App.
Using cached mappings, the reconfiguration times of service
graphs can be reduced to within a second, which allows
for dynamic exchange of network processing for different
Pervasive App states.
If a reconfiguration needs multiple configuration messages, Titan stops the current service subgraph on the
reception of the first message. The configuration of the new
service subgraph is then continued every time new configuration packets are received. As soon as the service subgraph
EURASIP Journal on Wireless Communications and Networking
15
Table 3: Titan service set and execution time Ti on a Tmote Sky. RAM indicates the number of dynamic memory bytes allocated, and ROM
is the bytes of code memory used. The delay has been computed for a packet of 22 bytes data. ns gives memory bytes needed to store n in the
data type used, for example, for 16 bit values ns = 2n.
Service
Duplicator
FBandEnergy
Description
Exec. Time
RAM
Copies a packet to multiple output ports
192 µs
—
Computes the energy in a frequency band from FFT data
200 µs
12
Computes a 32 bit real-valued FFT over a data window of n = 2k samples (exec. time for
FFT
186 ms 16 + 4n + ns
128 16-bit samples)
Led
Displays incoming data on the mote LED array
36 µs
—
Mean
Computes the mean value over a sliding window of size n
318 µs
12 + ns
Merge
Merges multiple packets into one
328 µs
12
MinMax
Looks for the maximum and minimum in a window of size n
193 µs
8
ExpAvg
Computes an exponential moving average over input data
222 µs
8
Synchronizer Synchronizes data by dropping packets until a user-defined event occurs
220 µs
10
Threshold
Quantizes the data by applying a user-defined number n of thresholds
95 µs
4 + 2n
TransDetect
Detects value changes in the input signal and issues a packet with the new value
201 µs
2
Variance
Computes the variance over a sliding window of size n
1510 µs
16 + ns
Zero crossings Counts the number of zero crossings in the data stream
176 µs
8
ROM
250
410
4714
260
494
454
484
416
476
424
474
720
370
Table 4: Analysis of the reconfiguration process comparing the node level timings to the application instantiation results of Section 4.2.1.
Service
Process configuration message
Clearing existing task subnetwork
Configuration & Startup
Total (with OS overhead)
Time (µs)
260
56
196
650
Network level
Clearing node 56 µs
Node level
Network
reconfiguration 0.9s
Mapping 3.5 s
Application
download 17s
Processing
message 260 µs
Table 5: Characteristics of a simple configuration for sampling,
feature processing, and sending for different platforms.
Platform
Titan
Mat´
e
Deluge
Configuration data
(Bytes)
(Packets)
71
4
75
4
29588
1345
Node
reconfiguration
196 µs
Processing time
(ms)
3.68
24.00
0.20
information is complete, Titan starts the execution and
notifies the network manager of that fact. The continuous
processing of the incoming configuration messages reduces
TinyOS
overhead
138 µs
the delay after the reception of the last message, as it only
includes the configuration and startup time.
To compare the Titan firmware on sensor nodes to
other systems, we have benchmarked a test application in
three systems: Titan, Mat´ [26], and Deluge [22]. Thus, the
e
comparison involves a virtual machine and a native code
solution next to Titan’s service-based approach.
The test application continuously samples a sensor at
10 Hz, calculates the maximum, the minimum, and the
mean over 10 samples, and sends them to another node (As
such, the test application implements a typical processing
structure found in accelerometer-based activity recognition
system before classification: sensor data acquisition, feature
extraction, and windowing.). We report the number and
16
EURASIP Journal on Wireless Communications and Networking
total size of the configuration messages to be sent (Table 5)
and evaluated how long the processing of the samples takes
on the node (Table 5).
Titan executes 6.5 times faster than the Mat´ virtual
e
machine and has a similar configuration size. Deluge on the
other hand has an application-specific image and is about
18x faster than Titan, but, due to the large number of configuration messages, it needs several seconds for transferring
a program image and reboot. This time is not acceptable
in the context recognition applications that we envision,
where sensors, computational power, and communication
channels may change dynamically and in unpredictable ways
depending on the user location, motion, social interaction,
and so forth. Deluge does allow to store a certain number
of configurations, depending on the node Flash memory,
but this allows only a small number of different task sets to
execute, while Titan can be reconfigured to a much broader
range of applications.
Note that we have chosen a simple application capable of
running on Mat´ . Mat´ is not able to support sampling rates
e
e
higher than 10 Hz. It neither can compute an FFT at 10 Hz
in realtime, which Titan is able to do. Being able to compute
an FFT in realtime is important as many features for activity
recognition are gained from the frequency space [7, 49].
5. Supporting Activity Awareness in
Opportunistic Sensor Configurations
In the future, ambient intelligence environment will see a
large range of wireless nodes (see Section 1 where we make a
case for this). In this discussion, we assume that they contain
the Titan firmware and thus are Titan nodes.
Some of these Titan nodes contain sensors. These are
either dedicated for activity awareness—typically found in
smart homes—but they may also be deployed for another
primary reason, yet they can be repurposed to infer human
activities. A sensor purposed for lighting control (e.g., a
presence sensor or a light switch) may also provide the
information about light toggling as a sensing service to the
rest of the system. Other nodes are processing nodes offering
computational services. Typically a sensor node also includes
computational services. However, computational services
and sensing services need not be collocated. Devices that have
sufficient idle computational power may offer computational
services to the system. For instance, a Bluetooth headset may
provide computational services related to signal and audio
processing while it is idle, then it reclaims these resources
upon the reception of a call.
The availability of computational and sensing services
changes as the user changes location, picks up or leaves
objects behind, or changes clothing—all potentially including elements of ambient intelligence. The resulting availability of services in the user’s PAN is thus hard to predict
at design time. We refer to such environments as offering
opportunistic sensor configurations [11].
Titan is essentially a programming model and a new
way to deploy activity-aware Pervasive Apps in dynamic and
heterogeneous environments at run time. We argue that
Titan is well equipped to handle changing availability of
processing resources (Section 5.1). However, Titan per se
does not contain built-in mechanisms to deal with changing
availability of sensors to perform activity recognition. This is
an aspect that cannot be addressed solely by a programming
model and run-time engine. It must be considered from a
signal processing and machine learning perspective also. We
discuss in Section 5.2 new signal processing and machine
learning techniques developed by our group and others
which aim at addressing some aspects of activity recognition
with changing availability of sensors. We show that the
design of Titan allows for the inclusion of such techniques
into an activity-aware system. Combining these techniques
with Titan further supports our objective of deploying
activity-aware Pervasive Apps in real-world open-ended
environments.
5.1. Coping with Changing Availability of Processing Nodes.
Titan is equipped with several features to cope with opportunistic availability of processing nodes. In particular, it
allows the application developer to focus on the logic of the
application by describing an activity recognition process as a
sequence of interconnected service graphs at design time. The
mapping of the service graph to effective hardware resources
is left to the run time and is handled by Titan. Thus, the
application developer does not need to care about where
specific computational services will be located at run time
(he can, however, provide constraints if needed, such as when
low latency is required between processing elements, e.g., to
compute a correlation between data streams).
5.1.1. Dynamic Mapping. A first mechanism lies in the
network manager which maps the service graph it has
been assigned to the available resources while minimizing
a cost function. Since the communication between services
is handled transparently, there is great flexibility for the
network manager to deploy the service graph on the available
nodes. In particular, services providing computation can be
very easily and transparently moved across nodes.
When processing nodes disappear (e.g., if the energy
runs out, or the user moves away from the resource), Titan
can seamlessly map the service graph to the remaining
available resources. When new processing node appears,
Titan can remap the service graph to minimize the cost of the
implementation. Beside saving costs, a fast reconfiguration
can also be exploited to virtually extend available resources
by, for example, always only recognizing activities that are
possible at the moment and thus increasing the total number
of activities that can be recognized [50].
5.1.2. Service Composition. Another mechanism lies in the
Internet application repositories. The application servers
contain application templates. They also hold sets of replacement services. When one service is not available, it can be
replaced by one or more other services to reach the same
desired function. For instance, a service based on an FFT
to compute the dominant frequency in a signal (e.g., to
detect walking) could be substituted by a lower-complexity
EURASIP Journal on Wireless Communications and Networking
mean crossing rate service. Foreseeing replacement services
is currently left to the application developer which does this
at design time.
5.2. Coping with Changing Sensor Configurations. An activity
recognition system is essentially a system detecting pattern
similarities between the sensor signals and prerecorded
signals corresponding to various activities or gestures of
interest [2]. This is typically done by signal processing and
machine learning techniques. Usually, at design time, a set
of users are asked to perform the activities or gestures of
interest, or to experience the context of interest. During this
time, the sensor signals corresponding to these activities,
gestures, or contexts are recorded. These signals form a
“database” against which the signals obtained at run time are
compared to. A number of machine learning approaches can
be used to perform this comparison: statistical approaches
such as hidden Markov models, neural networks, kernel
methods, and decision trees. Regardless of the methods used,
there are two common assumptions:
(1) the sensor signals observed at run time for a given
activity are the same as those observed at design time
(no concept drift);
(2) the sets of sensors envisioned at design time must
all remain available at run time, and at the same
location.
These assumptions are not valid in opportunistic sensor
configurations [11]. Taking the example of an acceleration
sensor, here are a few of the issues that may arise.
(i) Small Sensor Displacement. A sensor placed on the upper
arm in a wristband is used to detect gestures. With repeated
gestures, the wristband may change place, or the user
may even move it himself for comfort reason. The sensor
signal patterns corresponding to the activities of interest
become different after displacement compared to the designtime recording. This issue also arises with textile-integrated
sensors in loose fitting garments [51].
(ii) Major Sensor Displacement. A sensor placed on the hip
(e.g., in a belt buckle) for walking detection may be unavailable as the user has decided to change clothing. However,
another sensor placed in a shoe becomes available and could
offer comparative capabilities. Besides displacement, the
orientation of the sensor may also change; a mobile phone
may in a variety of pockets and be in various orientation in
them.
(iii) Modality Replacement. A sensor modality (e.g., acceleration sensor) may not be available at the desired location
(e.g., arm). However, another modality (e.g., gyroscope) is
available.
(iv) Sensor Disappearance/Reappearance. As batteries get
depleted or sensors regain energy through scavenging,
sensors may appear and disappear over time in unpredictable
17
ways. This leads to dynamic ensembles of sensors which need
to be managed to perform activity recognition in an efficient
manner.
We describe below new signal processing and machine
learning techniques developed by our group and others
which aim at addressing some of these aspects and which
can be included within Titan. Principles underlying these
developments are discussed in [11] with a summary of other
methods not discussed here available in [3].
5.2.1. Small Sensor Displacement. We developed an unsupervised classifier self-calibration technique which we showed
can improve the resilience to small changes in on-body
sensor placement of activity recognition techniques [52].
This is applicable to any sensor modality. It only assumes
that when a sensor is displaced the structure of the activities
in the feature space retains a similar relative topological
organization and that the class displacement in the feature
space remains comparable to the interclass separation. As
such, this approach is suited to small displacements on body
segments (e.g., arms or legs). This approach is also suited
to cope with changing sensor characteristic (e.g., sensitivity
or offset, typical in sensors included in textile fibers), or to
changing user action-motor patterns (e.g., due to aging).
Within Titan, the application service repositories may
automatically instantiate an unsupervised classifier selfcalibration service when the application designer indicates
that a requested sensor may be subject to displacement.
Kunze and Lukowicz have shown that features that are
robust to displacement can be designed using body models
and combining accelerometer and gyroscope modalities [53].
Within Titan, the application service repositories may
automatically instantiate the computation of robust features
when the service directory reports the availability of the
necessary modalities. This may happen transparently, even
though the application developer only specifies the use of an
acceleration sensor in his application template.
5.2.2. Major Sensor Displacement. Kunze et al. have developed a method that allows for acceleration sensor to selfcharacterize their on-body placement [54] and orientation
[55] using machine learning techniques. They also show that
symbolic location in the environment can be obtained by
similar self-characterization [56].
Within Titan, we envision that Titan nodes geared for onbody use (e.g., mobile phone that can be in various pockets
or belt clip, watch which may be on the left or right arm or in
a pocket) autonomously determine their on-body location
and orientation using these methods and report this upon
service discovery queries as a self-characterization parameter.
Thus, the service directory receives the notification of a
presence of a sensor and additional self-characterization.
The Internet application repositories may then instantiate an
appropriate activity recognition service graphs according to
the availability and placement of the sensors. The application
designer would design various service graphs for the possible
foreseen on-body placement of the sensors. For instance,
walking can be detected from sensors placed at the hip or
18
EURASIP Journal on Wireless Communications and Networking
at the ankle with a similar recognition algorithm. The difference between the sensor placement translates, however, in
different threshold parameters of the classification algorithm
[57] which can be offered as different services.
5.2.3. Modality Replacement. Kunze et al. have shown that
a sensor modality (magnetic field sensor) can be replaced by
another modality (gyroscope) [12]. Calatroni et al. argue that
there is a large number of modality replacements that can be
envisioned in ambient intelligence environments [8]. They
suggest that many sensors can be repurposed for activity
recognition even though they were initially provided for
other uses. They characterize, for instance, how reed switches
placed in windows for security purposes can be used to infer
standing or walking, by means of assumptions about human
behavior when interacting with these objects. They further
propose a method of transfer learning to capitalize on such
sporadic information gathered when the user interacts with
the environment to acquire ground truth labels that can be
used to train existing on-body sensors into recognizing these
activities [58]. Thus, while initially walking or standing could
only be inferred during a short period of time around the
interaction with the environment, after transfer learning to
an on-body sensor, the capability to infer walking or standing
is continuously available. Such an approach is especially
interesting when the modality, placement, and orientation
of the sensor on-body is unknown to the system. Transfer
learning allows to attribute meaning to the signals of that
sensor at run time. Thus, this method can in principle
be applied to any known and yet-to-be-developed sensor
modalities.
Within Titan, the application server can autonomously
propose alternative service graphs and the corresponding supplementary processing to exploit alternative sensor
modalities (e.g., replace magnetic field sensor by a gyroscope). When Pervasive Apps operate over longer period of
time, transfer learning can be exploited to attribute meaning
to signals originating from unknown new sensors. This can
be realized by means of a developer-generated database
on the Internet repository side containing the behavioral
assumptions, and the corresponding methods to operate
transfer learning to a new sensor.
5.2.4. Dynamic Sensor Ensembles. Modern activity recognition systems are usually multimodal and capitalize on a
wide availability of resources [4]. When a large number
of multimodal sensors are available in the environment, a
common way to perform activity recognition is to rely on the
global decision fusion of individual classification performed
on the sensor nodes (ensemble classifiers [59]). We showed
that enlarging the number of sensors contributing to the
global decision rapidly enhances the activity recognition
accuracy of the system [60]. However, it also increases overall
energy use. Since wireless sensor nodes are generally battery
operated and rely on energy scavenging, a better approach
consists of managing a power-performance tradeoff of the
system. We have showed empirical heuristics to dynamically
shape ensemble of nodes to reach a dynamic powerperformance tradeoff, specified either in terms of target
activity recognition accuracy, or network lifetime [46]. The
key of this approach is the heuristic that allows to find which
sensors (one or more) should be included in the dynamic
sensor ensemble to replace the loss of another one.
Within Titan, we envision that the application developer characterizes the contributions of the various sensors
foreseen for activity recognition, as described in [46]. Based
on this, the Internet application server may instantiate the
Pervasive App template with various subsets of the available
sensing services, in order to realize power-performance
management. This also can lead to improved robustness
to faults, as the loss of a sensor leads then to the use
of a sufficient number of other additional sensing services
to replace its contribution and maintain the desired target
performance.
6. Discussion
Our vision with Titan is to enable Pervasive Apps—activityaware applications that can easily be downloaded from
Pervasive Appstores, much like the current trend with
software Apps for mobile phones. The additional complexity
of Pervasive Apps is that a hardware component is needed;
sensor nodes on the body, in objects, and in the environment
must all be recruited to support activity and context
awareness. In a true pervasive experience, nodes may also
provide feedback to the user (e.g., by vibrating on the body
when playing a sports game or highlighting objects in the
environment). While in our work we used custom sensor
nodes based on the commercial TmoteSky motes, in the
future, we envision that many of these nodes are likely
to come from manufacturers of components of ambient
intelligence environments. The services provided by these
nodes will be related to the function of the element of the
ambient intelligence environment in which they are integrated. The service-oriented programming model of Titan
supports interoperability across various hardware; it hides
the underlying implementation and allows interoperability
among heterogeneous resources as long as the services are
compliant. Thus, the application developer can focus on
designing the Pervasive Apps service graph, rather than
developing lower level services. This is a further element that
may democratize the development of Pervasive Apps.
Today’s ubiquity of mobile phones makes them perfect candidates to act as mediators between the pervasive
computing world and the user. To application servers, they
abstract their environment and receive applications adapted
to the current situation. For the pervasive world, they
manage the distributed application running on Titan nodes
in their vicinity. By managing the processing locally, the
application gains on scalability and has an improved reaction
time. The mobile phone screen may be used as user interface
to display application status information, such as the game
scores of Pervasive Farkle. However, with Pervasive Apps
most user interaction can take place in the physical world.
Compared to methods based on dynamic code upload
(e.g., Deluge) or those based on virtual machines (e.g.,
Mat´ ), the strength of Titan’s service-oriented approach is
e
that algorithms within the services are implemented as native
EURASIP Journal on Wireless Communications and Networking
code and are part of the node firmware (services currently
cannot be updated, except on the mobile device). Thus,
services can execute at close to native code speed, in contrast
to virtual machine approaches. Yet reconfiguration remains
fast as the configuration information only contains the service graph description, in contrast to dynamic code upload
approaches. The flexibility of quick reconfiguration and the
resulting possibility to adapt to dynamic environments is
maintained.
One major strength of Titan compared to approaches
reviewed in Section 2 is Titan’s seamless mapping of a
design-time-defined service graph onto run-time-discovered
available resources. We showed that this allows to cope with
changing availability of processing nodes. It also allows to
split applications into different states in which the Titan
nodes only process signals relevant at the time. On state
changes, when Titan nodes fail or get out of reach, the Titan
nodes can be reconfigured to perform a new functionality. As
a consequence, the computational load on the nodes can be
kept low, and they can be switched off at times to save power.
The application designer must currently foresee multiple service graphs if the Pervasive App is to be able to
use various run-time-discovered sensor configurations for
activity recognition. We outlined in Section 5 that novel
opportunistic activity recognition methodologies (e.g., those
explored in the centralized opportunity framework) may also
be included in the logic of Titan to allow it to autonomously
exploit dynamically discovered sensing services, in addition
to the current dynamic use of processing services. Thus, this
may allow Titan to perform activity recognition in changing
sensor configurations by, for instance, substituting a sensor
modality by one or more others. We showed that the rules
governing such methodologies can be included within Titan,
typically in the Internet application repositories.
We are currently integrating the Titan framework into
the SENSEI system which defines standards for accessing,
describing, and composing services in a globally connected
network of thousands of sensors, actuators, and processing units. Titan provides dynamic mechanisms allowing
autonomous management and control of local nodes.
Titan is agnostic to the underlying networking protocols.
We used here 802.15.4 radios with the TinyOS communication protocol. However, Zigbee or ANT may also be used.
Star networks, such as Bluetooth, can also be used, albeit
limiting the flexibility in using larger number of sensor nodes
for activity recognition.
7. Conclusion
We want to enable Pervasive Apps—activity-aware applications that can easily be downloaded from Pervasive
Appstores, much like the current trend with software Apps
for mobile phones.
We have discussed the challenges involved in realizing
this in opportunistic PANs; PANs within which the available
resources (sensors, processing elements) are changing over
time in hard-to-predict ways. This occurs in open-ended
environments as the user changes sensor-enabled clothing,
takes and leaves devices behind, or changes location.
19
The Titan framework has been proposed to enable
pervasive applications in opportunistic PANs. The Titan
framework is a service-oriented approach to the design,
programming, deployment, and execution of activity-aware
applications. An application is described by a set of graphs
of interconnected services. It is downloaded by a mobile
device from Internet application repositories. The mobile
device maps the individual services at runtime to individual
nodes of a heterogeneous sensor network and locally handles
changes.
The key characteristics of the Titan framework are
(i) a service-oriented programming model that allows
a representation of an activity-aware application as
a service graph regardless of the effectively used
run-time resources. This enables it to be used in
heterogeneous environments with varying hardware
and network layers;
(ii) applications are composed and configured at runtime by substituting services or selecting among
several alternative application templates. Dynamic
and fast reconfiguration efficiently exploits scarce
processing resources on nodes;
(iii) titan is geared to streaming data processing and
machine learning, which are typically used to realize
activity recognition service graphs to be run within
the network on and around the body. Custom
services can be downloaded to realize the core logic
of Pervasive Apps.
We have described and characterized the implementation
of a pervasive gaming application using Titan, a pervasive
Farkle game relying on Titan nodes containing acceleration
sensors placed on body and in smart dice. The results of
the implementation show that a complete application can
be ready to run in 17 seconds on a 3G network, including
application download, computation of the service graph
mapping for 7 sensor nodes, and node reconfiguration. The
reconfiguration of a single sensor node takes less than 1 ms.
Sampling rates of 100 Hz can be supported with enough
free processing time for recognition algorithms. Thus, Titan
offers a better tradeoff between processing time and dynamic
reconfiguration delay than related approaches.
Titan is well equipped to replace and remap at runtime service graphs containing processing services. We have
extensively discussed how novel machine learning methodologies to perform activity recognition with unpredictable
availability of sensors can be included within Titan to provide
it with even more flexibility by allowing substitution of
sensor modalities or including mechanisms to cope with
sensor displacement. This is the object of ongoing work.
During university lectures, freshmen developed simple
Titan applications within a few hours time. Our experience
outlines that the service-oriented approach of Titan may be
a key to democratize the development and distribution of
activity-aware pervasive computing application and eventually giving them the same ease of development and visibility
as Apps currently developed for mobile phones.
20
EURASIP Journal on Wireless Communications and Networking
Titan is available under the GNU LGPL license from
/>
Acknowledgment
The authors acknowledge the financial support of the Seventh Framework Programme for Research of the European
Commission, under the project OPPORTUNITY with Grant
no. 225938 and the project SENSEI with Grant no. 215923.
References
[1] N. Davies, D. P. Siewiorek, and R. Sukthankar, “Activity-based
computing,” IEEE Pervasive Computing, vol. 7, no. 2, pp. 20–
21, 2008.
[2] L. Bao and S. S. Intille, “Activity recognition from userannotated acceleration data,” in Proceedings of the 2nd IEEE
International Conference on Pervasive Computing, pp. 1–17,
April 2004.
[3] D. Roggen, A. Calatroni, M. Rossi et al., “Collecting complex
activity data sets in highly rich networked sensor environments,” in Proceedings of the 7th International Conference on
Networked Sensing Systems, pp. 233–240, IEEE Press, 2010.
[4] T. Stiefmeier, D. Roggen, G. Ogris, P. Lukowicz, and G.
Tră ster, Wearable activity tracking in car manufacturing,
o
IEEE Pervasive Computing, vol. 7, no. 2, pp. 42–50, 2008.
[5] S. Kallio, J. Kela, P. Korpipă a, and J. Mă ntyjă rvi, User
aă
a
a
independent gesture interaction for small handheld devices,
International Journal of Pattern Recognition and Artificial
Intelligence, vol. 20, no. 4, pp. 505–524, 2006.
[6] T. Schlă mer, B. Poppinga, N. Henze, and S. Boll, “Gesture
o
recognition with a wii controller,” in Proceedings of the 2nd
International Conference on Tangible and Embedded Interaction, A. Schmidt, H. Gellersen, E. van den Hoven, A. Mazalek,
P. Holleis, and N. Villar, Eds., pp. 11–14, ACM, New York, NY,
USA, 2008.
[7] J. A. Ward, P. Lukowicz, G. Tră ster, and T. E. Starner, “Activity
o
recognition of assembly tasks using body-worn microphones
and accelerometers,” IEEE Transactions on Pattern Analysis and
Machine Intelligence, vol. 28, no. 10, pp. 15531566, 2006.
[8] A. Calatroni, D. Roggen, and G. Tră ster, “A methodology
o
to use unknown new sensors for activity recognition by
leveraging sporadic interactions with primitive sensors
and behavioral assumptions,” in Proceedings of the Opportunistic Ubiquitous Systems Workshop, part of 12th ACM
International Conference on Ubiquitous Computing, 2010,
/>OpportunisticUbiquitousSystems.
[9] A. Tognetti, N. Carbonaro, G. Zupone, and D. De Rossi,
“Characterization of a novel data glove based on textile integrated sensors,” in Proceedings of the 28th Annual International
Conference of the IEEE on Engineering in Medicine and Biology
Society (EMBS ’06), pp. 2510–2513, August-September 2006.
[10] L. Benini, E. Farella, and C. Guiducci, “Wireless sensor
networks: enabling technology for ambient intelligence,”
Microelectronics Journal, vol. 37, no. 12, pp. 1639–1649, 2006.
[11] D. Roggen, K. Fă rster, A. Calatroni et al., OPPORTUNITY:
o
towards opportunistic activity and context recognition systems,” in Proceedings of the 3rd IEEE International Symposium
on a World of Wireless, Mobile and Multimedia Networks and
Workshops (WOWMOM ’09), 2009.
[12] K. Kunze, G. Bahle, P. Lukowicz, and K. Partridge, “Can
magnetic field sensors replace gyroscopes in wearable sensing
applications?” in Proceedings of the International Symposium
on Wearable Computers (ISWC ’10), 2010.
[13] A. T. Campbell, S. B. Eisenman, N. D. Lane, E. Miluzzo, and
R. A. Peterson, “People-centric urban sensing,” in Proceedings
of the 2nd Annual International Workshop on Wireless Internet
(WICON ’06), p. 18, ACM, New York, NY, USA, 2006.
[14] U. Anliker, J. Beutel, M. Dyer et al., “A systematic approach to
the design of distributed wearable systems,” IEEE Transactions
on Computers, vol. 53, no. 8, pp. 1017–1033, 2004.
[15] D. Bannach, O. Amft, and P. Lukowicz, “Rapid prototyping of
activity recognition applications,” IEEE Pervasive Computing,
vol. 7, no. 2, pp. 22–31, 2008.
[16] R. Kumar, M. Wolenetz, B. Agarwalla et al., “DFuse: a
framework for distributed data fusion,” in Proceedings of the
1st International Conference on Embedded Networked Sensor
Systems (SenSys ’03), pp. 114–125, November 2003.
[17] A. Rezgui and M. Eltoweissy, “Service-oriented sensoractuator networks: promises, challenges, and the road ahead,”
Computer Communications, vol. 30, no. 13, pp. 2627–2648,
2007.
[18] O. Gnawali, K. Y. Jang, J. Paek et al., “The tenet architecture for
tiered sensor networks,” in Proceedings of the 4th International
Conference on Embedded Networked Sensor Systems (SenSys
’06), pp. 153–166, November 2006.
[19] A. Bakshi and V. K. Prasanna, “The abstract task graph: a
methodology for architecture-independent programming of
networked sensor systems,” in Proceedings of the Workshop on
End-to-End Sense-and-Respond Systems (EESR ’05), 2005.
[20] A. B. Bakshi and V. K. Prasanna, “DART: the data-driven
ATaG runtime,” in Architecture-Independent Programming for
Wireless Sensor Networks, John Wiley & Sons, New York, NY,
USA, 2007.
[21] C. Lombriser, M. Stă ger, D. Roggen, and G. Tră ster, Titan:
a
o
a tiny task network for dynamically recongurable heterogeneous sensor networks,” in Proceedings of the 15th Fachtagung
Kommunikation in Verteilten Systemen (KiVS ’07), pp. 127–
138, 2007.
[22] J. Hui and D. Culler, “The dynamic behavior of a data
dissemination protocol for network programming at scale,” in
Proceedings of the 2nd International Conference on Embedded
Networked Sensor Systems, pp. 81–94, ACM Press, 2004.
[23] P. J. Marron, A. Lachenmann, D. Minder, J. Hă hner, R.
a
Sauter, and K. Rothermel, “TinyCubus: a flexible and adaptive
framework for sensor networks,” in Proceedings of the 2nd
European Workshop onWireless Sensor Networks (EWSN ’05),
pp. 278–289, February 2005.
[24] C. C. Han, R. Kumar, R. Shea, E. Kohler, and M. Srivastava,
“A dynamic operating system for sensor nodes,” in Proceedings
of the 3rd International Conference on Mobile Systems, Applications, and Services (MobiSys ’05), pp. 163–176, June 2005.
[25] S. Dulman and P. Havinga, “Architectures for wireless sensor
networks,” in Proceedings of the Intelligent Sensors, Sensor
Networks and Information Processing Conference (ISSNIP ’05),
pp. 31–38, December 2005.
[26] P. Levis and D. Culler, “Mat´ : a tiny virtual machine for sensor
e
networks,” ACM SIGOPS Operating Systems Review, vol. 36,
no. 5, pp. 85–95, 2002.
[27] P. Levis, D. Gay, and D. Culler, “Active sensor networks,” in
Proceedings of the 2nd USENIX/ACM Symposium on Network
Systems Design and Implementation, 2005.
[28] J. Kukkonen, E. Lagerspetz, P. Nurmi, and M. Andersson, “BeTelGeuse: a platform for gathering and processing
EURASIP Journal on Wireless Communications and Networking
[29]
[30]
[31]
[32]
[33]
[34]
[35]
[36]
[37]
[38]
[39]
[40]
[41]
[42]
[43]
situational data,” IEEE Pervasive Computing, vol. 8, no. 2, pp.
49–56, 2009.
G. Fortino, A. Guerrieri, F. L. Bellifemine, and R. Giannantonio, “SPINE2: developing BSN applications on heterogeneous
sensor nodes,” in Proceedings of the IEEE International Symposium on Industrial Embedded Systems (SIES ’09), pp. 128–131,
July 2009.
V. Tsiatsis, A. Gluhak, T. Bauge et al., “The SENSEI real
world internet architecture,” in Towards the Future Internet—
Emerging Trends from European Research, A. Galis, A. Gavras,
S. Krco et al., Eds., IOS Press, 2010.
M. Kurz, A. Ferscha, A. Calatroni, D. Roggen, and G. Tră ster,
o
Towards a framework for opportunistic activity and context
recognition, in Proceedings of the Opportunistic Ubiquitous
Systems Workshop, part of 12th ACM International Conference
on Ubiquitous Computing, 2010, />resources/UbicompWorkshop OpportunisticUbiquitousSystems.
M. Conti and M. Kumar, “Opportunities in opportunistic
computing,” Computer, vol. 43, no. 1, pp. 42–50, 2010.
V. Kulathumani, M. Sridharan, R. Ramnath, and A. Arora,
“Weave: an architecture for tailoring urban sensing applications across multiple sensor fabrics,” in Proceedings of the
International Workshop on Mobile Devices and Urban Sensing
(MODUS ’08), 2008.
N. D. Lane, S. B. Eisenman, M. Musolesi, E. Miluzzo, and
A. T. Campbell, “Urban sensing systems: opportunistic or
participatory?” in Proceedings of the 9th Workshop on Mobile
Computing Systems and Applications (HotMobile ’08), pp. 11–
16, ACM, New York, NY, USA, 2008.
A. T. Campbell, S. B. Eisenman, N. D. Lane et al., “The rise of
people-centric sensing,” IEEE Internet Computing, vol. 12, no.
4, pp. 12–21, 2008.
J. Scott, J. Crowcroft, P. Hui, and C. Diot, “Haggle: a
networking architecture designed around mobile users,” in
Proceedings of the 3rd Annual Conference on Wireless Ondemand Network Systems and Services, p. 86, 2006.
J. Hill, R. Szewczyk, A. Woo, S. Hollar, D. Culler, and K.
Pister, “System architecture directions for networked sensors,”
in Proceedings of the 9th Internatinal Conference Architectural
Support for Programming Languages and Operating Systems
(ASPLOS ’00), pp. 93–104, November 2000.
J. Elson, L. Girod, and D. Estrin, “Fine-grained network time
synchronization using reference broadcasts,” in Proceedings
of the 5th Symposium on Operating Systems Design and
Implementation (OSDI ’02), pp. 147–163, 2002.
S. Ganeriwal, R. Kumar, and M. B. Srivastava, “Timingsync protocol for sensor networks,” in Proceedings of the
1st International Conference on Embedded Networked Sensor
Systems (SenSys ’03), pp. 138–149, November 2003.
D. Bannach, K. Kunze, P. Lukowicz, and O. Amft, “Distributed
modular toolbox for multi-modal context recognition,” in
Proceedings of the ARCS (Architecture of Computing Systems),
W. Grass, B. Sick, and K. Waldschmidt, Eds., pp. 99–113,
Springer, Heidelberg, Germany, 2006.
U. Ramachandran, R. Kumar, M. Wolenetz et al., “Dynamic
data fusion for future sensor networks,” ACM Transactions on
Sensor Networks, vol. 2, no. 3, pp. 404–443, 2006.
G. J. Pottie and W. J. Kaiser, “Wireless integrated network
sensors,” Communications of the ACM, vol. 43, no. 5, pp. 51–
58, 2000.
C. Lombriser, R. Marin-Perianu, D. Roggen, P. Havinga, and
G. Tră ster, Modeling service-oriented context processing in
o
[44]
[45]
[46]
[47]
[48]
[49]
[50]
[51]
[52]
[53]
[54]
[55]
[56]
[57]
[58]
21
dynamic body area networks,” IEEE Journal on Selected Areas
in Communications, vol. 27, no. 1, pp. 49–57, 2009.
D. E. Goldberg, Genetic Algorithms in Search Optimization
& Machine Learning, Addison-Wesley, Reading, Mass, USA,
1989.
M. Coloberti, C. Lombriser, D. Roggen, G. Tră ster, R.
o
Guarneri, and D. Riboni, “Service discovery and composition
in body area networks,” in Proceedings of the 3rd International
Conference on Body Area Networks, 2008.
P. Zappi, C. Lombriser, E. Farella, D. Roggen, L. Benini, and G.
Tră ster, “Activity recognition from on-body sensors: accuracyo
power trade-off by dynamic sensor selection,” in Proceedings
of the 5th European Conf. on Wireless Sensor Networks (EWSN
’08), R. Verdone, Ed., pp. 17–33, Springer, 2008.
Moteiv Corporation, “Ultra low power IEEE 802.15.4 compliant wireless sensor module,” Tmote Sky Datasheet, June 2006.
D. Figo, P. C. Diniz, D. R. Ferreira, and J. M. P. Cardoso, “Preprocessing techniques for context recognition from
accelerometer data,” Personal and Ubiquitous Computing, vol.
14, no. 7, pp. 645662, 2010.
a
o
M. Stă ger, P. Lukowicz, and G. Tră ster, “Implementation and
evaluation of a low-power sound-based user activity recognition system,” in Proceedings of the International Symposium on
Wearable Computers (ISWC ’04), pp. 138–141, IEEE Computer
Society Press, Los Alamitos, Calif, USA, 2004.
C. Lombriser, O. Amft, P. Zappi, L. Benini, and G. Tră ster,
o
Benets of dynamically recongurable activity recognition
in distributed sensing environments, in Activity Recognition
in Pervasive Intelligent Environments, chapter 12, pp. 261–286,
Atlantis Press, 2010.
H. Harms, O. Amft, and G. Tră ster, Modeling and simulation
o
of sensor orientation errors in garments,” in Proceedings of the
4th International Conference on Body Area Networks (Bodynets
09), 2009.
K. Fă rster, D. Roggen, and G. Tră ster, Unsupervised classier
o
o
selfcalibration through repeated context occurences: is there
robustness against sensor displacement to gain?” in Proceedings of the 13th IEEE International Symposium on Wearable
Computers (ISWC ’09), pp. 77–84, 2009.
K. Kunze and P. Lukowicz, “Dealing with sensor displacement
in motion-based onbody activity recognition systems,” in
Proceedings of the 10th International Conference on Ubiquitous
Computing (UbiComp ’08), pp. 20–29, September 2008.
K. Kunze, P. Lukowicz, H. Junker, and G. Tră ster, “Where
o
am I: recognizing on-body positions of wearable sensors,”
in Proceedings of the International Workshop on Location and
Context-Awareness (LOCA ’05), pp. 264–275, January 2005.
K. Kunze, P. Lukowicz, K. Partridge, and B. Begole, “Which
way am I facing: inferring horizontal device orientation from
an accelerometer signal,” in Proceedings of the International
Symposium on Wearable Computers (ISWC ’09), pp. 149–150,
IEEE Press, 2009.
K. Kunze and P. Lukowicz, “Symbolic object localization
through active sampling of acceleration and sound signatures,”
in Proceedings of the 9th International Conference on Ubiquitous
Computing (UbiComp ’07), pp. 163180, 2007.
M. Bă chlin, D. Roggen, M. Plotnik, J. Hausdor, and G.
a
Tră ster, Online detection of freezing of gait in parkinson’s
o
disease patients: a performance characterization,” in Proceedings of the 4th International Conference on Body Area Networks
(BodyNets ’09), 2009.
A. Calatroni, C. Villalonga, D. Roggen, and G. Tră ster,
o
Context cells: towards lifelong learning in activity recognition
22
EURASIP Journal on Wireless Communications and Networking
system,” in Proceedings of the 4th European Conference on
Smart Sensing and Context (EuroSSC ’09), pp. 121–134,
Springer, 2009.
[59] R. Polikar, “Ensemble based systems in decision making,” IEEE
Circuits and Systems Magazine, vol. 6, no. 3, pp. 21–45, 2006.
[60] P. Zappi, T. Stiefmeier, E. Farella, D. Roggen, L. Benini, and G.
Tră ster, Activity recognition from on-body sensors by classio
fier fusion: sensor scalability and robustness,” in Proceedings
of the International Conference on Intelligent Sensors, Sensor
Networks and Information Processing (ISSNIP ’07), pp. 281–
286, December 2007.