Lithium-ion Batteries Part 8 pdf
Bạn đang xem bản rút gọn của tài liệu. Xem và tải ngay bản đầy đủ của tài liệu tại đây (2.76 MB, 14 trang )
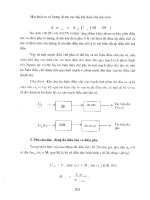
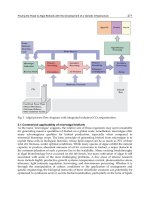
Anovelall-solid-statethin-lm-typelithium-ion
batterywithin-situpreparedelectrodeactivematerials 91
Glass, A.M.; Nassau, K. & Negran, T. J. (1978). Ionic conductivity of quenched alkali niobate
and tantalate glasses. Journal of Applied Physics, Vol. 49, No. 9, p4808-4811, 0021-
8979.
Greatbatch, W.; Lee, J. H.; Mathias, W.; Eldridge, M.; Moser, J. R. & Schneider, A. A.(1971)
IEEE Transactions on Biomedical Engineering, Vol. BME-18, No. 5, p317-324, 0018-
9294.
Hong, H. Y. P. (1978). Crystal structure and ionic conductivity of Li
14
Zn(GeO
4
)
4
and other
new Li
+
superionic conductors. Materials Research Bulletin, Vol. 13, No. 2, p117-124,
0025-5408.
Inaguma, Y.; Liquan, C.; Itoh, M.; Nakamura, T.; Uchida, T.; Ikuta, H. & Wakihara, M.
(1993). High ionic conductivity in lithium lanthanum titanate. Solid State
Communications, Vol. 86, No. 10, p689-693, 0038-1098.
Iriyama, Y.; Yada, C.; Abe, T.; Ogumi, Z. & Kikuchi, K. (2006). A new kind of all-solid-state
thin-film-type lithium-ion battery developed by applying a DC high voltage.
Electrochemistry Communications, Vol. 8, No. 8, p1287-1291, 1388-2481.
Iriyama, Y.; Shimidu, D.; Abe, T.; Sudoh, M.; & Ogumi, Z. (2008). Fast and Stable Charge
Transfer Reaction at the Li
4/3
Ti
5/3
O
4
/Lithium Phosphorus Oxynitride (LIPON)
Interface and its Application to All-Solid-State Thin Film Batteries, ECS
Transactions of 214
th
ECS Joint Meeting “PRiME 2008”, p45-52, Vol. 16, No. 26,
Honolulu, Oct. 12-17, 2008, ECS.
Kanamura, K.; Akutagawa, N. & Dokko, K. (2005). Three dimensionally ordered composite
solid materials for all solid-state rechargeable lithium batteries. Journal of Power
Sources, Vol. 146, No. 1-2, p86-89, 0378-7753.
Kawamura, J.; Kuwata, N.; Toribami, K.; Sata, N.; Kamishima, O. & Hattori, T. (2004).
Preparation of amorphous lithium ion conductor thin films by pulsed laser
deposition. Solid State Ionics, Diffusion & Reactions, Vol. 175, No. 1-4, p273-276, 0167-
2738.
Kubaschewski, O. & Alcock C. B. (1979). Metallurgical Thermochemistry, fifth ed., Pergamon
Press, 0080208975, New York.
Kuwano, J. & West, A.R. (1980). New Li
+
ion conductors in the system, Li
4
GeO
4
-Li
3
VO
4
.
Materials Research Bulletin, Vol. 15, No. 11, p1661-1667, 0025-5408.
Malugani, J.P. & Robert, G. (1979). Ionic conductivity of the glasses LiPO
3
-LiX(X=I, Br, Cl).
Materials Research Bulletin, Vol. 14, No. 8, p.1075-1081, 0025-5408 .
Neudecker, B. J.; Dudney, N. J. & Bates, J. B. (2000). "Lithium-free" thin-film battery with in
situ plated Li anode. Journal of the Electrochemical Society, Vol. 147, No. 2, p517-523,
0013-4651.
Ohtsuka, H. & Yamaki, J. (1989). Electrical characteristics of Li
2
O-V
2
O
5
-SiO
2
thin films. Solid
State Ionics, Diffusion & Reactions, Vol. 35, No. 3-4, p201-206, 0167-2738.
Rabenau, A. (1982). Lithium nitride and related materials case study of the use of modern
solid state research techniques. Solid State Ionics, Vol. 6, No. 4, p277-293, 0167-2738.
Radzilowski, R. H.; Yao, Y. F. & Kummer, J. T. (1969). Dielectric loss of beta alumina and of
ion-exchanged beta alumina. Journal of Applied Physics, Vol. 40, No. 12, p4716-4725,
0021-8979.
Sigaryov, S.E. & V.G. Terziev. (1993). Thermally induced lithium disorder in Li
3
Fe
2
(PO
4
)
3
.
Physical Review B (Condensed Matter), Vol. 48, No. 22, p16252-16255, 0163-1829.
Subramanian, M.A.; Subramanian, R. & Clearfield, A. (1986). Lithium ion conductors in the
system AB(IV)
2
(PO
4
)
3
(B=Ti, Zr and Hf). Solid State Ionics, Diffusion & Reactions,
Vol. 18-19, p562-569, 0167-2738 .
Thackeray, M.M. (1997). Manganese oxides for lithium batteries. Progress in Solid State
Chemistry, Vol. 25, No. 1-2, p1-71, 0079-6786.
Wang, B.; Bates, J. B.; Hart, F. X.; Sales, B. C.; Zuhr, R. A. & Robertson, J. D. (1996)
Characterization of thin-film rechargeable lithium batteries with lithium cobalt
oxide cathodes, Journal of the Electrochemical Society, Vol. 143, No.10, p3203-3213,
0013-4651.
Yada, C.; Iriyama, Y.; Abe, T.; Kikuchi, K. & Ogumi, Z. (2006). Amorphous Li-V-Si-O thin
films as high-voltage negative electrode materials for thin-film rechargeable
lithium-ion batteries. Journal of the Electrochemical Society, Vol. 153, No. 6, pA1148-
A1153, 0013-4651.
Yada, C.; Iriyama, Y.; Abe, T.; Kikuchi, K. & Ogumi, Z. (2009). A novel all-solid-state thin-
film-type lithium-ion battery with in situ prepared positive and negative electrode
materials. Electrochemistry Communications, Vol. 11, No. 2, p413-416, 1388-2481.
Yokoyama, M.; Iriyama, Y.; Abe, T. & Ogumi, Z. (2003). Dependency on the electrode
species of Li ion transfer at the electrode/glass electrolyte (LiPON) interface,
Proceedings of the 44th Battery Symposium, p290-291, Osaka, November, Seiei,
Ohsaka.
Nextgenerationlithiumionbatteriesforelectricalvehicles92
NASICONOpenFrameworkStructuredTransitionMetalOxidesforLithiumBatteries 93
NASICON Open Framework Structured Transition Metal Oxides for
LithiumBatteries
K.M.Begam,M.S.MichaelandS.R.S.Prabaharan
X
NASICON Open Framework Structured
Transition Metal Oxides for Lithium Batteries
1
K.M. Begam,
2
M.S. Michael and
3
S.R.S. Prabaharan
Department of Electrical Engineering, Universiti Teknologi PETRONAS
Malaysia
Department of Chemistry, S.S.N. Engineering College, Chennai
India
Faculty of Engineering, The University of Nottingham
Malaysia
1. Introduction
Since the dawn of civilization, world has become increasingly addicted to electricity due to
its utmost necessity for human life. The demand for electrically operated devices led to a
variety of different energy storage systems which are chosen depending on the field of
application. Among the available stationary power sources, rechargeable lithium-ion
batteries substantially impact the areas of energy storage, energy efficiency and advanced
vehicles. These batteries are the most advanced and true portable power sources combined
with advantages of small size, reduced weight, longer operating time and easy operation.
Such batteries can be recharged anytime (no memory effect) regardless of the charge
current/voltage and they are reliable and safe. These unique features render their
application in a variety of consumer electronic gadgets such as mobile phones, digital
cameras, personal digital assistants (PDAs), portable CD players and palmtop computers.
The high-end applications of this smart power source are projected for Hybrid Electric
Vehicles (HEVs) as potential source of propulsion.
The evolution of rechargeable lithium batteries since their inception by Sony Corporation
(Reimers & Dahn, 1992) has led to the development of new electrode materials (Kobayashi
et al., 2000; Gaubicher, et al., 2000; Zhang et al., 2009; Zhu et al., 2008) for their effective
operation in the real ICT environment. Among the new materials search for Li-ion batteries,
polyanion compounds are growing into incredible dimensions owing to their intriguing
properties (Manthiram & Goodenough, 1989; Huang et al., 2001; Yang et al., 2002; Chung et
al., 2002).
In this chapter, we present a systematic study of a group of new polyanion materials,
namely, lithium-rich [Li
2
M
2
(MoO
4
)
3
] and lithium-free [Li
x
M
2
(MoO
4
)
3
] (M= Ni, Co) phases of
transition metal oxides having NASICON open framework structure. A simple and efficient
approach to prepare the materials and a combination of characterization techniques to
reveal the physical and electrochemical properties of these materials are covered at length.
A separate section is devoted to a nano-composite approach wherein conductivity
enhancement of all the four materials is enlightened. We begin this chapter with a brief
5
Nextgenerationlithiumionbatteriesforelectricalvehicles94
description of polyanion materials in general in general and NASICON structure type
materials in particular.
2. Background
2.1 Polyanions
Despite the long known history of polyanion compounds as fast ion conductors or solid
electrolytes (Goodenough et al., 1976; Hong, 1976), they relatively comprise a new category
of electrode materials in recent times. The remarkable properties of these materials in tailor
made compositions may lead them for use as electrodes in next generation lithium-ion
batteries.
2.2 Types of polyanion compounds
Polyanion compounds incorporate NASICON structure type Li
x
M’
2
(XO
4
)
3
and olivine type
Li
x
M’’XO
4
materials.
NASICON materials are a family of compounds with M’
2
(XO
4
)
3
[M’ = Ni, Co, Mn, Fe, Ti or
V and X = S, P, As, Mo or W] networks in which M’O
6
octahedra share all their corners with
XO
4
tetrahedra, and XO
4
tetrahedra, share all their corners with M’O
6
octahedra
(Manthiram & Goodenough, 1987). The interstitials and conduction channels are generated
along the c-axis direction, in which alkali metal ions occupy the interstitial sites.
Consequently, the alkali metal ions can move easily along the conduction channels (Wang
et al., 2003). The M’
2
(XO
4
)
3
host framework is chemically versatile and it could be stabilized
with a variety of transition metal cations M’ having an accessible redox potential and XO
4
polyanions. Such framework oxides were known to undergo a topotactic insertion/
extraction of a mobile atom due to the availability of an open three-dimensional framework
(Nadiri et al., 1984; Reiff et al., 1986; Torardi & Prince, 1986) and hence are considered as
electrode materials for rechargeable lithium batteries (Padhi et al., 1997).
The Li
x
M’’XO
4
[M’ = Fe, Co, Mn or Ni and X = P, Mo, W or S] olivine structure has Li and
M’’ atoms in octahedral sites and X atoms in tetrahedral sites of a hexagonal close-packed
(hcp) oxygen array. With Li in continuous chain of edge-shared octahedra of alternate
planes, a reversible extraction/insertion of lithium from/into these chains would appear to
be analogous to the two-dimensional extraction or insertion of lithium in the LiMO
2
oxides
(Padhi et al, 1997).
2.3 NASICON type materials for energy storage– A brief history
Over the past, a number of researchers widely investigated NASICON structure type
materials to facilitate exploitation in Li-ion batteries.
As early in 1984, lithium insertion/extraction properties of NASICON type polyanion
compound, Fe
2
(MoO
4
)
3
was first reported by Nadiri et al. (1984). The compound was found
to crystallize in monoclinic structure and it contains iron ions exclusively in 3+ state. It was
shown that lithium could be inserted either chemically or electrochemically into the
framework Fe
2
(MoO
4
)
3
with the concurrent reduction of ferric to ferrous ions (Fe
3+
to Fe
2+
)
to form Li
x
Fe
2
(MoO
4
)
3
(x=2). The latter compound was found to crystallize in an
orthorhombic structure (Nadiri et al., 1984; Reiff et al., 1986).
Pure Fe
2
(WO
4
)
3
, isostructural with room temperature Fe
2
(MoO
4
)
3
(Harrison et al., 1985)
could also reversibly insert lithium either chemically or electrochemically to form
Li
2
Fe
2
(WO
4
)
3
similar to Li
2
Fe
2
(MoO
4
)
3
. It was demonstrated that the voltage versus lithium
content x for a Li/Li
x
Fe
2
(MoO
4
)
3
cell gives rise to a plateau in the 3 V region for 0<x<1.7
substantiating the two-phase character of this compositional range. There was a sharp drop
in V
oc
at x=2.0 due to lattice disproportionation leading to irreversibility (Manthiram &
Goodenough, 1987). This finding during the initial stage of exploring polyanions, in fact,
formed a footing to further investigating this kind of compounds as electrode materials for
lithium battery application.
Iron sulphate based positive electrodes, Fe
2
(SO
4
)
3
were shown to exist in hexagonal
NASICON structure (Goodenough et al., 1976) as well as in a related monoclinic form (Long
et al., 1979). Electrochemical insertion of lithium into both structure types was
demonstrated by a two phase process in the range 0<x<2 of nominal Li
x
Fe
2
(SO
4
)
3
giving rise
to a flat voltage profile at 3.6 V versus a lithium metal anode. The end phase Li
2
Fe
2
(SO
4
)
3
was confirmed to be orthorhombic. A difference of 600 mV in OCV observed between the
sulfate and corresponding molybdate or tungstate systems is due to the influence of the
counter cation on the Fe
3+
/Fe
2+
redox couple (Manthiram & Goodenough, 1989;
Nanjundasamy et al., 1996). For x>2, there is a drop in voltage from the open circuit voltage
(OCV). The performance of the material vitally depended on the initial phase of Fe
2
(SO
4
)
3
framework. The rhombohedral starting material retained modest capacity at lower current
densities even after 80 cycles whereas the monoclinic Fe
2
(SO
4
)
3
showed a faster capacity
fade (Okada et al, unpublished results). The overall performance of the hexagonal phase
was shown to be superior to the monoclinic phase (Bykov et al., 1990).
Nanjundasamy et al. (1996) investigated the use of titanium, vanadium in the cation site
and (PO
4
)
3-
in the anion site to buffer Fe
2
(SO
4
)
3
against too large a drop in voltage and found
that changing the polyanion group from (SO
4
)
2-
to (PO
4
)
3-
shifts the position of the redox
couple from 3.2 eV to 2.5 eV for Ti
4+
/Ti
3+
, 2.5 eV to 1.7 eV for V
3+
/V
2+
and 3.6 eV to 2.8 eV
for Fe
3+
/Fe
2+
below the Fermi level of lithium due to the smaller polarization of O
2-
toward
P
5+
than toward S
6+
. Each of these materials delivered a specific capacity of about 100
mAh/g between 2.0 and 4.2 V for a reversible insertion of two Li
+
per formula unit.
Padhi et al., (1998) noticed that the lithium insertion is accomplished by means of a single-
phase reaction by tuning the position of the redox couple in the NASICON framework
structures by anionic substitution as well. Electrochemical insertion of additional lithium
into rhombohedral Li
1+x
Fe
2
(SO
4
)
2
(PO
4
) with NASICON framework over the range
0 x 1.5 was found to be a reversible solid solution reaction within the hexagonal
structure. The position of the redox couple Fe
3+
/Fe
2+
is located at 3.3 – 3.4 eV below the
Fermi energy of lithium and this material delivered a reversible capacity of 110 mAh/g
relative to a Li-metal anode.
In an independent analysis, Li
3
Fe(MoO
4
)
3
was shown to reversibly insert lithium down to
2 V akin to Fe
2
(MoO
4
)
3
(Dompablo et al., 2006). They conducted a comprehensive phase
diagram study for Li
3+x
Fe(MoO
4
)
3
which
revealed preservation of the structural framework
for low
lithium contents (0<x<1) ensuring good cyclability of the material in lithium cells,
however, with a slight change of the cell volume (0.85%) (Vega et al., 2005).
Most of the above mentioned framework materials tend to operate in the low voltage range,
which is not impressive for high voltage (>4 V) positive electrode application.
In the field of high voltage (>4 V) positive electrode materials, phosphate structures
operating on the V
3+
/V
4+
receive increasing
interest in view of the fact that the redox
NASICONOpenFrameworkStructuredTransitionMetalOxidesforLithiumBatteries 95
description of polyanion materials in general in general and NASICON structure type
materials in particular.
2. Background
2.1 Polyanions
Despite the long known history of polyanion compounds as fast ion conductors or solid
electrolytes (Goodenough et al., 1976; Hong, 1976), they relatively comprise a new category
of electrode materials in recent times. The remarkable properties of these materials in tailor
made compositions may lead them for use as electrodes in next generation lithium-ion
batteries.
2.2 Types of polyanion compounds
Polyanion compounds incorporate NASICON structure type Li
x
M’
2
(XO
4
)
3
and olivine type
Li
x
M’’XO
4
materials.
NASICON materials are a family of compounds with M’
2
(XO
4
)
3
[M’ = Ni, Co, Mn, Fe, Ti or
V and X = S, P, As, Mo or W] networks in which M’O
6
octahedra share all their corners with
XO
4
tetrahedra, and XO
4
tetrahedra, share all their corners with M’O
6
octahedra
(Manthiram & Goodenough, 1987). The interstitials and conduction channels are generated
along the c-axis direction, in which alkali metal ions occupy the interstitial sites.
Consequently, the alkali metal ions can move easily along the conduction channels (Wang
et al., 2003). The M’
2
(XO
4
)
3
host framework is chemically versatile and it could be stabilized
with a variety of transition metal cations M’ having an accessible redox potential and XO
4
polyanions. Such framework oxides were known to undergo a topotactic insertion/
extraction of a mobile atom due to the availability of an open three-dimensional framework
(Nadiri et al., 1984; Reiff et al., 1986; Torardi & Prince, 1986) and hence are considered as
electrode materials for rechargeable lithium batteries (Padhi et al., 1997).
The Li
x
M’’XO
4
[M’ = Fe, Co, Mn or Ni and X = P, Mo, W or S] olivine structure has Li and
M’’ atoms in octahedral sites and X atoms in tetrahedral sites of a hexagonal close-packed
(hcp) oxygen array. With Li in continuous chain of edge-shared octahedra of alternate
planes, a reversible extraction/insertion of lithium from/into these chains would appear to
be analogous to the two-dimensional extraction or insertion of lithium in the LiMO
2
oxides
(Padhi et al, 1997).
2.3 NASICON type materials for energy storage– A brief history
Over the past, a number of researchers widely investigated NASICON structure type
materials to facilitate exploitation in Li-ion batteries.
As early in 1984, lithium insertion/extraction properties of NASICON type polyanion
compound, Fe
2
(MoO
4
)
3
was first reported by Nadiri et al. (1984). The compound was found
to crystallize in monoclinic structure and it contains iron ions exclusively in 3+ state. It was
shown that lithium could be inserted either chemically or electrochemically into the
framework Fe
2
(MoO
4
)
3
with the concurrent reduction of ferric to ferrous ions (Fe
3+
to Fe
2+
)
to form Li
x
Fe
2
(MoO
4
)
3
(x=2). The latter compound was found to crystallize in an
orthorhombic structure (Nadiri et al., 1984; Reiff et al., 1986).
Pure Fe
2
(WO
4
)
3
, isostructural with room temperature Fe
2
(MoO
4
)
3
(Harrison et al., 1985)
could also reversibly insert lithium either chemically or electrochemically to form
Li
2
Fe
2
(WO
4
)
3
similar to Li
2
Fe
2
(MoO
4
)
3
. It was demonstrated that the voltage versus lithium
content x for a Li/Li
x
Fe
2
(MoO
4
)
3
cell gives rise to a plateau in the 3 V region for 0<x<1.7
substantiating the two-phase character of this compositional range. There was a sharp drop
in V
oc
at x=2.0 due to lattice disproportionation leading to irreversibility (Manthiram &
Goodenough, 1987). This finding during the initial stage of exploring polyanions, in fact,
formed a footing to further investigating this kind of compounds as electrode materials for
lithium battery application.
Iron sulphate based positive electrodes, Fe
2
(SO
4
)
3
were shown to exist in hexagonal
NASICON structure (Goodenough et al., 1976) as well as in a related monoclinic form (Long
et al., 1979). Electrochemical insertion of lithium into both structure types was
demonstrated by a two phase process in the range 0<x<2 of nominal Li
x
Fe
2
(SO
4
)
3
giving rise
to a flat voltage profile at 3.6 V versus a lithium metal anode. The end phase Li
2
Fe
2
(SO
4
)
3
was confirmed to be orthorhombic. A difference of 600 mV in OCV observed between the
sulfate and corresponding molybdate or tungstate systems is due to the influence of the
counter cation on the Fe
3+
/Fe
2+
redox couple (Manthiram & Goodenough, 1989;
Nanjundasamy et al., 1996). For x>2, there is a drop in voltage from the open circuit voltage
(OCV). The performance of the material vitally depended on the initial phase of Fe
2
(SO
4
)
3
framework. The rhombohedral starting material retained modest capacity at lower current
densities even after 80 cycles whereas the monoclinic Fe
2
(SO
4
)
3
showed a faster capacity
fade (Okada et al, unpublished results). The overall performance of the hexagonal phase
was shown to be superior to the monoclinic phase (Bykov et al., 1990).
Nanjundasamy et al. (1996) investigated the use of titanium, vanadium in the cation site
and (PO
4
)
3-
in the anion site to buffer Fe
2
(SO
4
)
3
against too large a drop in voltage and found
that changing the polyanion group from (SO
4
)
2-
to (PO
4
)
3-
shifts the position of the redox
couple from 3.2 eV to 2.5 eV for Ti
4+
/Ti
3+
, 2.5 eV to 1.7 eV for V
3+
/V
2+
and 3.6 eV to 2.8 eV
for Fe
3+
/Fe
2+
below the Fermi level of lithium due to the smaller polarization of O
2-
toward
P
5+
than toward S
6+
. Each of these materials delivered a specific capacity of about 100
mAh/g between 2.0 and 4.2 V for a reversible insertion of two Li
+
per formula unit.
Padhi et al., (1998) noticed that the lithium insertion is accomplished by means of a single-
phase reaction by tuning the position of the redox couple in the NASICON framework
structures by anionic substitution as well. Electrochemical insertion of additional lithium
into rhombohedral Li
1+x
Fe
2
(SO
4
)
2
(PO
4
) with NASICON framework over the range
0 x 1.5 was found to be a reversible solid solution reaction within the hexagonal
structure. The position of the redox couple Fe
3+
/Fe
2+
is located at 3.3 – 3.4 eV below the
Fermi energy of lithium and this material delivered a reversible capacity of 110 mAh/g
relative to a Li-metal anode.
In an independent analysis, Li
3
Fe(MoO
4
)
3
was shown to reversibly insert lithium down to
2 V akin to Fe
2
(MoO
4
)
3
(Dompablo et al., 2006). They conducted a comprehensive phase
diagram study for Li
3+x
Fe(MoO
4
)
3
which
revealed preservation of the structural framework
for low
lithium contents (0<x<1) ensuring good cyclability of the material in lithium cells,
however, with a slight change of the cell volume (0.85%) (Vega et al., 2005).
Most of the above mentioned framework materials tend to operate in the low voltage range,
which is not impressive for high voltage (>4 V) positive electrode application.
In the field of high voltage (>4 V) positive electrode materials, phosphate structures
operating on the V
3+
/V
4+
receive increasing
interest in view of the fact that the redox
Nextgenerationlithiumionbatteriesforelectricalvehicles96
potential and energy densities of phosphate-based polyanion compounds are as good as the
current technologies (Padhi et al., 1997; Nanjundasamy et al., 1996) with good cycling
properties at high scan rates (Nazar et al., 2002). Barker et al. (2003) explored LiVFPO
4
and
Davies et al. (1994) investigated vanadium phosphate glasses as cathodes for Li-ion cells. A
number of phases of Li
3
V
2
(PO
4
)
3
were also studied as novel cathodes for Li-ion batteries.
The removal of lithium is facile in such materials as they are structurally alike the
NASICON family of materials. Amongst is the thermodynamically stable monoclinic form
of Li
3
V
2
(PO
4
)
3
which is isostructural to several other Li
3
M
2
(PO
4
)
3
(M = Sc, Fe or Cr)
materials (Huang et al., 2002; Yin et al., 2003). All three Li-ions may be reversibly removed
from Li
3
V
2
(PO
4
)
3
over two-phase electrochemical plateaus yielding a theoretical capacity of
197 mAh/g which is the highest for all phosphates reported so far. Nevertheless,
electrochemical measurements showed that the material
sustains reversibility when
extraction/insertion is confined to two Li-ions with a reversible capacity of 130 mAh/g and
the extraction of the third lithium is kinetically hindered and involves a significant over
voltage (Saidi et al., 2002; 2003). Rhombohedral form of Li
3
V
2
(PO
4
)
3
exhibits similar
electrochemical characteristics as for the charge extraction, but reinsertion is limited to 1.3
lithium corresponding to 90 mAh/g of capacity (Gaubicher et al., 2000; Morcrette et al.,
2003). Later, it was found that Zr substitution in orthorhombic Li
3
V
2
(PO
4
)
3
phase enhances
the electrochemical performance in terms of the discharge capacity and disappearance of
the two-plateau boundary in the charge-discharge curves (Sato et al., 2000).
In 4 V class NASICON structure type materials explored to date, Li
3
Fe
2
(PO
4
)
3
exits in
monoclinic and rhombohedral forms. The Fe
2
(PO
4
)
3
framework remains intact under
lithium extraction/insertion (Masquelier et al., 1996) occurring in a single continuous step
giving rise to an initial discharge capacity of 115 mAh/g (Masquelier et al., 1998). This
behavior slightly differs from Li
3
V
2
(PO
4
)
3
where partial dissolution of vanadium takes place
in deep reduction and at deep oxidation (Patoux et al., 2003).
3. Experimental processes
A succinct description of various experimental methods followed in the present study is
presented in this section. In addition, the experimental procedure employed is highlighted
wherever required.
3.1 Synthesis of open framework structured materials-Soft combustion technique
The soft-combustion technique offers several advantages over conventional high
temperature and other low temperature methods. Materials prepared via the solid-state
route contain two-phase mixtures due to the inhomogeneity caused by physical mixing of
the raw materials. The particle morphology is often irregular and particle size is very large.
On the other hand, the soft-combustion method, which is a low temperature preparative
process is not time consuming and obviously well suited for bulk synthesis. Moreover,
materials can be prepared with a single-phase structure and there is no impurity as second
phase. Uniform particle morphology is an added advantage of this technique.
To prepare the polyanion transition metal oxides in the present study, starting materials
such as lithium nitrate and hexa-ammonium heptamolybdate along with nitrate of the
transition metals, Ni and Co were dissolved in deionized water in the appropriate molar
ratio. The mixed solution was then added to an aqueous solution of glycine that acted as a
soft-combustion fuel. The quantity of glycine was optimized as twice the molar fraction of
the starting materials. The solution was heated to boiling at 100 ºC. A paste like substance
formed was further heated at 250 ºC to decompose the dried substance namely, the
precursor. During the process of decomposition, the reaction was ignited by the
combustible nature of glycine and gases like N
2
O, NH
3
etc. were liberated leading to dry
powders namely, the as-prepared material.
3.2 Characterization techniques employed
a. Physical characterization
As for the new materials prepared via the soft-combustion method, we employed physical
characterization techniques such as X-ray diffraction (XRD) and scanning electron
microscopy (SEM) analysis so as to find the crystallographic properties of the annealed
samples and to observe the particle size distribution, shape and morphology features of the
synthesized powder samples.
JEOL (model JDX 8030) and Rigaku (RINT-2500 V, 50 kV/100 mA, Rigaku Co. Ltd) X-ray
diffractometers were used to record the diffractograms of the polyanion materials using
CuK radiation (λ=1.5406 Å). Peak locations and intensities were determined by a least-
squares method and a refinement analysis, FullProof Suite, WinPLOTR 2004 was used to
calculate the unit cells. We used Cambridge Instruments (Stereo scan S200) to collect SEM
data for the family of new polyanion compounds. JEOL (JSM 6301F) was employed to study
the high resolution images.
b. Electrochemical characterization
In order to elucidate the mechanism of lithium extraction/insertion in the new materials,
and to generate kinetic and interfacial information, electrochemical studies were made, the
details of which are given below.
i. Cyclic voltammetry (CV) measurements - Constant voltage cycling:
Cyclic voltammetry is an important and most commonly used electrochemical technique to
characterize any electrochemical system. We examined the new materials by means of cyclic
voltammetry studies and obtained information regarding the reversible nature (redox
properties) of the materials and structural integrity during prolonged cycling with a view to
validate the suitability of the materials for Li-ion batteries. We performed the Slow Scan
Cyclic Voltammetry (SSCV) tests using Basic electrochemical system (BAS, Perkin Elmer,
PARC model, USA) equipped with PowerCV
software.
ii. Galvanostatic (constant current) charge/discharge test:
Although potentiostatic experiments are a key in the sense that they readily divulge the
reversibility of an electrode material, there are some applications for which a galvanostat is
advantageous. The number of Li-ions participating in the redox reaction and hence the
discharge capacity of the electrode material expressed in mAh/g is made known through
Galvanostatic cycling test. In the present study, Arbin battery tester (Arbin instruments
BT2000, USA) (8-channel unit) equipped with MITSPRO software was used to conduct the
galvanostatic charge/discharge cycle tests.
iii. Electrode preparation and cell fabrication:
Teflon made two-electrode cells with SS current collectors were used to perform the
electrochemical tests. Composite cathodes (positive electrodes) were prepared by mixing
the electrode-active material [powders of polyanion materials], acetylene black and PTFE
binder in a weight ratio of 80:15:5. The mixture was kneaded in agate type mortar and
NASICONOpenFrameworkStructuredTransitionMetalOxidesforLithiumBatteries 97
potential and energy densities of phosphate-based polyanion compounds are as good as the
current technologies (Padhi et al., 1997; Nanjundasamy et al., 1996) with good cycling
properties at high scan rates (Nazar et al., 2002). Barker et al. (2003) explored LiVFPO
4
and
Davies et al. (1994) investigated vanadium phosphate glasses as cathodes for Li-ion cells. A
number of phases of Li
3
V
2
(PO
4
)
3
were also studied as novel cathodes for Li-ion batteries.
The removal of lithium is facile in such materials as they are structurally alike the
NASICON family of materials. Amongst is the thermodynamically stable monoclinic form
of Li
3
V
2
(PO
4
)
3
which is isostructural to several other Li
3
M
2
(PO
4
)
3
(M = Sc, Fe or Cr)
materials (Huang et al., 2002; Yin et al., 2003). All three Li-ions may be reversibly removed
from Li
3
V
2
(PO
4
)
3
over two-phase electrochemical plateaus yielding a theoretical capacity of
197 mAh/g which is the highest for all phosphates reported so far. Nevertheless,
electrochemical measurements showed that the material
sustains reversibility when
extraction/insertion is confined to two Li-ions with a reversible capacity of 130 mAh/g and
the extraction of the third lithium is kinetically hindered and involves a significant over
voltage (Saidi et al., 2002; 2003). Rhombohedral form of Li
3
V
2
(PO
4
)
3
exhibits similar
electrochemical characteristics as for the charge extraction, but reinsertion is limited to 1.3
lithium corresponding to 90 mAh/g of capacity (Gaubicher et al., 2000; Morcrette et al.,
2003). Later, it was found that Zr substitution in orthorhombic Li
3
V
2
(PO
4
)
3
phase enhances
the electrochemical performance in terms of the discharge capacity and disappearance of
the two-plateau boundary in the charge-discharge curves (Sato et al., 2000).
In 4 V class NASICON structure type materials explored to date, Li
3
Fe
2
(PO
4
)
3
exits in
monoclinic and rhombohedral forms. The Fe
2
(PO
4
)
3
framework remains intact under
lithium extraction/insertion (Masquelier et al., 1996) occurring in a single continuous step
giving rise to an initial discharge capacity of 115 mAh/g (Masquelier et al., 1998). This
behavior slightly differs from Li
3
V
2
(PO
4
)
3
where partial dissolution of vanadium takes place
in deep reduction and at deep oxidation (Patoux et al., 2003).
3. Experimental processes
A succinct description of various experimental methods followed in the present study is
presented in this section. In addition, the experimental procedure employed is highlighted
wherever required.
3.1 Synthesis of open framework structured materials-Soft combustion technique
The soft-combustion technique offers several advantages over conventional high
temperature and other low temperature methods. Materials prepared via the solid-state
route contain two-phase mixtures due to the inhomogeneity caused by physical mixing of
the raw materials. The particle morphology is often irregular and particle size is very large.
On the other hand, the soft-combustion method, which is a low temperature preparative
process is not time consuming and obviously well suited for bulk synthesis. Moreover,
materials can be prepared with a single-phase structure and there is no impurity as second
phase. Uniform particle morphology is an added advantage of this technique.
To prepare the polyanion transition metal oxides in the present study, starting materials
such as lithium nitrate and hexa-ammonium heptamolybdate along with nitrate of the
transition metals, Ni and Co were dissolved in deionized water in the appropriate molar
ratio. The mixed solution was then added to an aqueous solution of glycine that acted as a
soft-combustion fuel. The quantity of glycine was optimized as twice the molar fraction of
the starting materials. The solution was heated to boiling at 100 ºC. A paste like substance
formed was further heated at 250 ºC to decompose the dried substance namely, the
precursor. During the process of decomposition, the reaction was ignited by the
combustible nature of glycine and gases like N
2
O, NH
3
etc. were liberated leading to dry
powders namely, the as-prepared material.
3.2 Characterization techniques employed
a. Physical characterization
As for the new materials prepared via the soft-combustion method, we employed physical
characterization techniques such as X-ray diffraction (XRD) and scanning electron
microscopy (SEM) analysis so as to find the crystallographic properties of the annealed
samples and to observe the particle size distribution, shape and morphology features of the
synthesized powder samples.
JEOL (model JDX 8030) and Rigaku (RINT-2500 V, 50 kV/100 mA, Rigaku Co. Ltd) X-ray
diffractometers were used to record the diffractograms of the polyanion materials using
CuK radiation (λ=1.5406 Å). Peak locations and intensities were determined by a least-
squares method and a refinement analysis, FullProof Suite, WinPLOTR 2004 was used to
calculate the unit cells. We used Cambridge Instruments (Stereo scan S200) to collect SEM
data for the family of new polyanion compounds. JEOL (JSM 6301F) was employed to study
the high resolution images.
b. Electrochemical characterization
In order to elucidate the mechanism of lithium extraction/insertion in the new materials,
and to generate kinetic and interfacial information, electrochemical studies were made, the
details of which are given below.
i. Cyclic voltammetry (CV) measurements - Constant voltage cycling:
Cyclic voltammetry is an important and most commonly used electrochemical technique to
characterize any electrochemical system. We examined the new materials by means of cyclic
voltammetry studies and obtained information regarding the reversible nature (redox
properties) of the materials and structural integrity during prolonged cycling with a view to
validate the suitability of the materials for Li-ion batteries. We performed the Slow Scan
Cyclic Voltammetry (SSCV) tests using Basic electrochemical system (BAS, Perkin Elmer,
PARC model, USA) equipped with PowerCV
software.
ii. Galvanostatic (constant current) charge/discharge test:
Although potentiostatic experiments are a key in the sense that they readily divulge the
reversibility of an electrode material, there are some applications for which a galvanostat is
advantageous. The number of Li-ions participating in the redox reaction and hence the
discharge capacity of the electrode material expressed in mAh/g is made known through
Galvanostatic cycling test. In the present study, Arbin battery tester (Arbin instruments
BT2000, USA) (8-channel unit) equipped with MITSPRO software was used to conduct the
galvanostatic charge/discharge cycle tests.
iii. Electrode preparation and cell fabrication:
Teflon made two-electrode cells with SS current collectors were used to perform the
electrochemical tests. Composite cathodes (positive electrodes) were prepared by mixing
the electrode-active material [powders of polyanion materials], acetylene black and PTFE
binder in a weight ratio of 80:15:5. The mixture was kneaded in agate type mortar and
Nextgenerationlithiumionbatteriesforelectricalvehicles98
pestle, rolled into thin sheets of around 100 m thick, and cut into circular electrodes of
3.14 cm
2
area and pressed onto an aluminum expanded grid mesh current collector. Test
cells were composed of cathode (working electrode), a thin lithium foil (FMC, USA) as both
counter and reference electrode and a microporous (Celgard
3501 polypropylene)
membrane soaked in a standard non-aqueous Li
+
electrolyte mixture solution (1M LiPF
6
in
EC+DMC) (Merck LP 30) as a separator. The test cells were fabricated inside a glove box
filled with high purity (99.999%) argon.
4. Results and discussion
4.1 Structure of Li
2
M
2
(MoO
4
)
3
The crystal structure of Li
2
M
2
(MoO
4
)
3
was determined using the CrystalDesigner
software.
Figure 1 shows the polyhedral crystal structure of Li
2
M
2
(MoO
4
)
3
. The determination of the
crystal structure revealed a three-dimensional framework consisting of metal-oxygen
octahedra and trigonal prisms (where Li and M reside) which are interconnected by MoO
4
tetrahedra. The hexagonal motif of Mo tetrahedra around M octahedra joined by their faces
is clearly seen in Fig. 1. Lithium atoms may occupy sites between or within the layers. The
open framework allowed Li
+
ions to easily move in and out of the structure. Similar
structures were already reported for analogous polyanion materials such as orthorhombic
Li
2
Fe
2
(MO
4
)
3
[M = Mo or W] (Manthiram & Goodenough, 1987).
Fig. 1. Polyhedral view of the structure of Li
2
M
2
(MoO
4
)
3
viewed along the (100) plane
(Prabaharan et al., 2004).
4.2 Phase analysis
The phase purity of all the four materials was examined by means of XRD. In order to
optimise the phase purity, we annealed the samples at different temperatures with a fixed
soak time of 4h.
a. Lithium-rich phase of metal molybdates:
The XRD patterns of Li
2
Ni(MoO
4
)
3
recorded for the product annealed at 500°C exhibited
some impurity peaks which were found to disappear upon annealing at 600°C and 700°C.
In the case of the product annealed at 600°C, it was observed that the XRD peak positions
are in good agreement with the preliminary crystallographic data previously reported
(JCPDS #70-0452) indicating the formation of a well crystalline single-phase structure. So,
the product annealed at 600ºC was taken for further examination.
Li
2
Ni
2
(MoO
4
)
3
was indexed in an orthorhombic structure with space group Pmcn. We used
a refinement program (ICSD using POWD-12++) (Ozima et al., 1977) to calculate the cell
c
b
Octahedron and tetrahedron
sharing corner oxygen atom
parameters of Li
2
Ni
2
(MoO
4
)
3
and found the values as follows: a = 10.424(4) A°, b = 17.525(1)
A° and c = 5.074(3) A°. It is to be mentioned here that no crystal structure information is
available for Li
2
Ni
2
(MoO
4
)
3
as for as we know except for the one available in JCPDS Ref.
#70-0452. However, the latter pattern is non-indexed.
Although a single-phase structure with desired phase purity was formed at 600ºC/4 h/air,
lithium could not be extracted from Li
2
Ni
2
(MoO
4
)
3
during electrochemical charge owing to
the difficulty in stabilizing nickel at a fixed valence state. It was suggested that a controlled
oxygen atmosphere is essential during annealing of LiNiO
2
in order to stabilize nickel
(Moshtev et al., 1995; Hirano et al., 1995). Accordingly, the as-prepared product of
Li
2
Ni
2
(MoO
4
)
3
was subjected to annealing at 600ºC/4h in the presence of oxygen
atmosphere (90 ml/min). The XRD pattern of this product was recorded and compared
with the one obtained under the same annealing conditions in ambient air.
Fig. 2. Comparison of the peak positions of the diffractograms of as-prepared samples
annealed in ambient air (sample A) and annealed in oxygen atmosphere (sample B)
(Prabaharan et al., 2004).
Fig. 2 illustrates an expanded view of the differences in the peak positions of the chosen
region with high intensity peaks (19
°
-31
°
/2 angle) between the samples annealed in
ambient air (sample A) and in oxygen atmosphere (sample B). A closer look at the
diffractograms clearly reveals a slight but noticeable peak shift toward low 2 regions for
the sample B with respect to sample A, which is obviously a result of the heat treatment for
the sample B in the presence of oxygen atmosphere. The peak shift is an indication of the
volume change of the crystal lattice, which would probably facilitate the easy Li
+
extraction/insertion kinetics thereby improving the rate capability and discharge capacity
compared to the one annealed in ambient air. The XRD pattern of Li
2
Co
2
(MoO
4
)
3
is very
much similar to that of Li
2
Ni
2
(MoO
4
)
3
. The disappearance of impurity peaks at a higher
annealing temperature is well seen in figure 3. In addition, the peaks are refined and
become sharper resulting in decreased crystallite size of the product. This is one of the
favorable attributes for the effective utilization of Li
2
Co
2
(MoO
4
)
3
positive-electrode active
NASICONOpenFrameworkStructuredTransitionMetalOxidesforLithiumBatteries 99
pestle, rolled into thin sheets of around 100 m thick, and cut into circular electrodes of
3.14 cm
2
area and pressed onto an aluminum expanded grid mesh current collector. Test
cells were composed of cathode (working electrode), a thin lithium foil (FMC, USA) as both
counter and reference electrode and a microporous (Celgard
3501 polypropylene)
membrane soaked in a standard non-aqueous Li
+
electrolyte mixture solution (1M LiPF
6
in
EC+DMC) (Merck LP 30) as a separator. The test cells were fabricated inside a glove box
filled with high purity (99.999%) argon.
4. Results and discussion
4.1 Structure of Li
2
M
2
(MoO
4
)
3
The crystal structure of Li
2
M
2
(MoO
4
)
3
was determined using the CrystalDesigner
software.
Figure 1 shows the polyhedral crystal structure of Li
2
M
2
(MoO
4
)
3
. The determination of the
crystal structure revealed a three-dimensional framework consisting of metal-oxygen
octahedra and trigonal prisms (where Li and M reside) which are interconnected by MoO
4
tetrahedra. The hexagonal motif of Mo tetrahedra around M octahedra joined by their faces
is clearly seen in Fig. 1. Lithium atoms may occupy sites between or within the layers. The
open framework allowed Li
+
ions to easily move in and out of the structure. Similar
structures were already reported for analogous polyanion materials such as orthorhombic
Li
2
Fe
2
(MO
4
)
3
[M = Mo or W] (Manthiram & Goodenough, 1987).
Fig. 1. Polyhedral view of the structure of Li
2
M
2
(MoO
4
)
3
viewed along the (100) plane
(Prabaharan et al., 2004).
4.2 Phase analysis
The phase purity of all the four materials was examined by means of XRD. In order to
optimise the phase purity, we annealed the samples at different temperatures with a fixed
soak time of 4h.
a. Lithium-rich phase of metal molybdates:
The XRD patterns of Li
2
Ni(MoO
4
)
3
recorded for the product annealed at 500°C exhibited
some impurity peaks which were found to disappear upon annealing at 600°C and 700°C.
In the case of the product annealed at 600°C, it was observed that the XRD peak positions
are in good agreement with the preliminary crystallographic data previously reported
(JCPDS #70-0452) indicating the formation of a well crystalline single-phase structure. So,
the product annealed at 600ºC was taken for further examination.
Li
2
Ni
2
(MoO
4
)
3
was indexed in an orthorhombic structure with space group Pmcn. We used
a refinement program (ICSD using POWD-12++) (Ozima et al., 1977) to calculate the cell
c
b
Octahedron and tetrahedron
sharing corner oxygen atom
parameters of Li
2
Ni
2
(MoO
4
)
3
and found the values as follows: a = 10.424(4) A°, b = 17.525(1)
A° and c = 5.074(3) A°. It is to be mentioned here that no crystal structure information is
available for Li
2
Ni
2
(MoO
4
)
3
as for as we know except for the one available in JCPDS Ref.
#70-0452. However, the latter pattern is non-indexed.
Although a single-phase structure with desired phase purity was formed at 600ºC/4 h/air,
lithium could not be extracted from Li
2
Ni
2
(MoO
4
)
3
during electrochemical charge owing to
the difficulty in stabilizing nickel at a fixed valence state. It was suggested that a controlled
oxygen atmosphere is essential during annealing of LiNiO
2
in order to stabilize nickel
(Moshtev et al., 1995; Hirano et al., 1995). Accordingly, the as-prepared product of
Li
2
Ni
2
(MoO
4
)
3
was subjected to annealing at 600ºC/4h in the presence of oxygen
atmosphere (90 ml/min). The XRD pattern of this product was recorded and compared
with the one obtained under the same annealing conditions in ambient air.
Fig. 2. Comparison of the peak positions of the diffractograms of as-prepared samples
annealed in ambient air (sample A) and annealed in oxygen atmosphere (sample B)
(Prabaharan et al., 2004).
Fig. 2 illustrates an expanded view of the differences in the peak positions of the chosen
region with high intensity peaks (19
°
-31
°
/2 angle) between the samples annealed in
ambient air (sample A) and in oxygen atmosphere (sample B). A closer look at the
diffractograms clearly reveals a slight but noticeable peak shift toward low 2 regions for
the sample B with respect to sample A, which is obviously a result of the heat treatment for
the sample B in the presence of oxygen atmosphere. The peak shift is an indication of the
volume change of the crystal lattice, which would probably facilitate the easy Li
+
extraction/insertion kinetics thereby improving the rate capability and discharge capacity
compared to the one annealed in ambient air. The XRD pattern of Li
2
Co
2
(MoO
4
)
3
is very
much similar to that of Li
2
Ni
2
(MoO
4
)
3
. The disappearance of impurity peaks at a higher
annealing temperature is well seen in figure 3. In addition, the peaks are refined and
become sharper resulting in decreased crystallite size of the product. This is one of the
favorable attributes for the effective utilization of Li
2
Co
2
(MoO
4
)
3
positive-electrode active
Nextgenerationlithiumionbatteriesforelectricalvehicles100
powders. In the case of the product annealed at 600 C, it was observed that the XRD peak
positions are in good agreement with the crystallographic data previously reported (PDF #
31-0716), indicating the formation of a well crystalline single-phase structure.
Li
2
Co
2
(MoO
4
)
3
was indexed in an orthorhombic structure with a space group Pnma. The
refinement program used for Li
2
Ni
2
(MoO
4
)
3
was used in this case as well and the lattice
parameters were calculated to be a = 5.086(1) Å, b = 10.484(2) Å and c = 17.606(2) Å.
Fig. 3. XRD patterns of Li
2
Co
2
(MoO
4
)
3
at (a) 500°C; (b) 600°C (Prabaharan et al., 2004).
b. Lithium-free phase of metal molybdates:
It is known from the XRD patterns of lithium-rich phases Li
2
M
2
(MoO
4
)
3
, that the
appropriate annealing temperature to obtain single-phase polyanion materials is 600C.
Hence, the as-prepared product of Ni
2
(MoO
4
)
3
was annealed at 600 C in the presence of
oxygen atmosphere for two different annealing times, 4h and 7h to verify the effect of
annealing time on the crystalline material.
Figure 4 presents the X-ray diffraction pattern of Ni
2
(MoO
4
)
3
annealed at 600C for 4 h
and 7 h in an oxygen atmosphere (90 ml/min). It is clear from the diffractograms that the
peaks are alike in terms of peak position, sharpens of the peaks and intensity for the two
samples indicating the formation of well crystalline structure. As the diffraction pattern is
similar for both the samples, sample A was chosen for further investigation. The peaks were
indexed using a least-squares refinement method.
10 20 30 40 50 60
0
1000
2000
3000
An
g
le /2θ (de
g
)
500°C
600°C
Intensity (Counts)
(013)
(102)
(031)
(024)
(104)
(033)
(200)
(228)
(146)
Fig. 4. X-ray diffractograms of Ni
2
(MoO
4
)
3
annealed at 600C under O
2
purge (90 ml/min);
Sample A - 600C/4 h; sample B - 600C/7h (Prabaharan et al., 2004).
The diffractograms of Co
2
(MoO
4
)
3
corresponding to 600C and 700C annealing
temperature for 4 h signify the growth of peaks as shown in figure below (Fig. 5).
The peaks were indexed for the first time using a least-squares refinement method.
Co
2
(MoO
4
)
3
was indexed in monoclinic structure with space group with P2/m. The lattice
parameters were determined using a refinement program (FullProof Suite, WINPLOTR
2004) and calculated to be: a = 14.280(9) Å, b = 3.382(8) Å, c = 10.5571 Å and β = 117.9728.
Fig. 5. X-ray diffraction patterns of Co
2
(MoO
4
)
3
annealed at 600 C and 700 C
(Prabaharan et al., 2004).
10 20 30
0
500
1000
(012)
(112)
(120)
(
142
)
(202)
(220)
(212)
(
242
)
(200)
Intensit
y
(
Counts
)
Angle / 2θ (deg)
700C
600C
NASICONOpenFrameworkStructuredTransitionMetalOxidesforLithiumBatteries 101
powders. In the case of the product annealed at 600 C, it was observed that the XRD peak
positions are in good agreement with the crystallographic data previously reported (PDF #
31-0716), indicating the formation of a well crystalline single-phase structure.
Li
2
Co
2
(MoO
4
)
3
was indexed in an orthorhombic structure with a space group Pnma. The
refinement program used for Li
2
Ni
2
(MoO
4
)
3
was used in this case as well and the lattice
parameters were calculated to be a = 5.086(1) Å, b = 10.484(2) Å and c = 17.606(2) Å.
Fig. 3. XRD patterns of Li
2
Co
2
(MoO
4
)
3
at (a) 500°C; (b) 600°C (Prabaharan et al., 2004).
b. Lithium-free phase of metal molybdates:
It is known from the XRD patterns of lithium-rich phases Li
2
M
2
(MoO
4
)
3
, that the
appropriate annealing temperature to obtain single-phase polyanion materials is 600C.
Hence, the as-prepared product of Ni
2
(MoO
4
)
3
was annealed at 600 C in the presence of
oxygen atmosphere for two different annealing times, 4h and 7h to verify the effect of
annealing time on the crystalline material.
Figure 4 presents the X-ray diffraction pattern of Ni
2
(MoO
4
)
3
annealed at 600C for 4 h
and 7 h in an oxygen atmosphere (90 ml/min). It is clear from the diffractograms that the
peaks are alike in terms of peak position, sharpens of the peaks and intensity for the two
samples indicating the formation of well crystalline structure. As the diffraction pattern is
similar for both the samples, sample A was chosen for further investigation. The peaks were
indexed using a least-squares refinement method.
10 20 30 40 50 60
0
1000
2000
3000
An
g
le /2θ (de
g
)
500°C
600°C
Intensity (Counts)
(013)
(102)
(031)
(024)
(104)
(033)
(200)
(228)
(146)
Fig. 4. X-ray diffractograms of Ni
2
(MoO
4
)
3
annealed at 600C under O
2
purge (90 ml/min);
Sample A - 600C/4 h; sample B - 600C/7h (Prabaharan et al., 2004).
The diffractograms of Co
2
(MoO
4
)
3
corresponding to 600C and 700C annealing
temperature for 4 h signify the growth of peaks as shown in figure below (Fig. 5).
The peaks were indexed for the first time using a least-squares refinement method.
Co
2
(MoO
4
)
3
was indexed in monoclinic structure with space group with P2/m. The lattice
parameters were determined using a refinement program (FullProof Suite, WINPLOTR
2004) and calculated to be: a = 14.280(9) Å, b = 3.382(8) Å, c = 10.5571 Å and β = 117.9728.
Fig. 5. X-ray diffraction patterns of Co
2
(MoO
4
)
3
annealed at 600 C and 700 C
(Prabaharan et al., 2004).
10 20 30
0
500
1000
(012)
(112)
(120)
(
142
)
(202)
(220)
(212)
(
242
)
(200)
Intensit
y
(
Counts
)
Angle / 2θ (deg)
700C
600C
Nextgenerationlithiumionbatteriesforelectricalvehicles102
4.3 SEM analysis
SEM images were recorded for the synthesized polycrystalline powders annealed at 600°C
for 4h and are exhibited in Fig. 6. As for the lithium-rich phases (Li
2
Ni
2
(MoO
4
)
3
&
Li
2
Co
2
(MoO
4
)
3
, SEM reveals the formation fiber-like grains with controlled grain growth
and morphology (Fig. 7a & b). In both cases the particles are loosely agglomerated with the
average size within the submicrometre range.
As for as the morphology is concerned, Ni
2
(MoO
4
)
3
as well as Co
2
(MoO
4
)
3
powders exhibit
uniform and ultrafine
spherical grains (Fig. 7 c & d) with nearly uniform particle size. The
inset in Fig. 7c shows the SEM picture recorded at high magnification to unveil the actual
grain size distribution. Consequently, the micrograph (inset) demonstrates nanosized
spherical grains with a single grain size of ~100nm. From the nanostructure morphology of
Co
2
(MoO
4
)
3
as depicted in Fig. 7d, it is readily observed that Co
2
(MoO
4
)
3
powders contain
uniform spherical grains of much reduced size (20 nm) when compared to Ni
2
(MoO
4
)
3
.
6a. Li
2
Ni
2
(MoO
4
)
3
6b. Li
2
Co
2
(MoO
4
)
3
6c. Ni
2
(MoO
4
)
3
6d. Co
2
(MoO
4
)
3
Fig. 6 (a, b & c). SEM images; d. TEM image. (Prabaharan et al., 2004, 2006, 2008).
4.4 Electrochemical studies
a. Cyclic voltammetry (CV) measurements
In order to elucidate the electrochemical reversible nature of the materials taken for the
present investigation, we carried out cyclic voltammetry tests on Li/Li
2
M
2
(MoO
4
)
3
and
Li/Li
x
M
2
(MoO
4
)
3
half cells at a low scan rate (0.1 mV/s). The cells were first charged to
extract lithium from the host materials and then discharged to insert lithium in the host
structures. We discovered that all the four materials possess electrochemical reversibility
with regard to Li
+
extraction/insertion. Accordingly, Fig. 7 presents the slow scan cyclic
voltammograms of Li
2
M
2
(MoO
4
)
3
composite electrodes vs. Li/Li
+
cycled between 4.9 V and
1.5 V. It is clearly seen from the CV profiles that Li
2
M
2
(MoO
4
)
3
polyanion materials reveal a
systematic evidence for the electrochemical reversibility through the oxidation and
reduction peaks corresponding to the two transition metal ions, M
2+
[M = Ni, Co] and Mo
6+
.
As for the electrochemical reversibility of Li
2
M
2
(MoO
4
)
3
vs.
Li/Li
+
, during charge (anodic
scan), we observed the first oxidation of Ni
2+
/Ni
3+
at 4.4 V whilst the oxidation of
Co
2+
/Co
3+
was found to occur at 4.3 V. Following the charging process, during discharge,
(cathodic scan), we were able to notice a single peak at 3.2 V corresponding to Ni
3+
/Ni
2+
reduction, and its analogous counterpart, Co
3+
was found to reduce to Co
2+
at 3.1 V. The
shift in the redox potential of M
3+
/M
2+
is correlated to the polyanion (MoO
4
)
2-
in the host
framework structure. In fact, we emphasized this point in some of our publication
(Prabaharan et al., 2004) as reported by Nanjundaswamy et al. (1996), who studied the effect
of NASICON-related framework compounds such as M
2
(SO
4
)
3
and Li
x
M
2
(PO
4
)
3
-1.60E-03
-1.20E-03
-8.00E-04
-4.00E-04
0.00E+ 00
4.00E-04
1 1.5 2 2.5 3 3.5 4 4.5 5
Current / A
Voltage / V vs. Li/Li
+
1
st
Charge
10
th
, 5
th
, 2
nd
, 1
st
Cycle
Mo
6+
/Mo
5+
Mo
4+
/Mo
6+
Mo
5+
/Mo
4+
-3.00 E-04
0.00 E+0 0
3.00 E-0 4
2.8 3.3 3.8 4.3 4.8
Ni
2+
/Ni
3+
Ni
3+
/
Ni
2+
First cycle Ni redox peaks
NASICONOpenFrameworkStructuredTransitionMetalOxidesforLithiumBatteries 103
4.3 SEM analysis
SEM images were recorded for the synthesized polycrystalline powders annealed at 600°C
for 4h and are exhibited in Fig. 6. As for the lithium-rich phases (Li
2
Ni
2
(MoO
4
)
3
&
Li
2
Co
2
(MoO
4
)
3
, SEM reveals the formation fiber-like grains with controlled grain growth
and morphology (Fig. 7a & b). In both cases the particles are loosely agglomerated with the
average size within the submicrometre range.
As for as the morphology is concerned, Ni
2
(MoO
4
)
3
as well as Co
2
(MoO
4
)
3
powders exhibit
uniform and ultrafine
spherical grains (Fig. 7 c & d) with nearly uniform particle size. The
inset in Fig. 7c shows the SEM picture recorded at high magnification to unveil the actual
grain size distribution. Consequently, the micrograph (inset) demonstrates nanosized
spherical grains with a single grain size of ~100nm. From the nanostructure morphology of
Co
2
(MoO
4
)
3
as depicted in Fig. 7d, it is readily observed that Co
2
(MoO
4
)
3
powders contain
uniform spherical grains of much reduced size (20 nm) when compared to Ni
2
(MoO
4
)
3
.
6a. Li
2
Ni
2
(MoO
4
)
3
6b. Li
2
Co
2
(MoO
4
)
3
6c. Ni
2
(MoO
4
)
3
6d. Co
2
(MoO
4
)
3
Fig. 6 (a, b & c). SEM images; d. TEM image. (Prabaharan et al., 2004, 2006, 2008).
4.4 Electrochemical studies
a. Cyclic voltammetry (CV) measurements
In order to elucidate the electrochemical reversible nature of the materials taken for the
present investigation, we carried out cyclic voltammetry tests on Li/Li
2
M
2
(MoO
4
)
3
and
Li/Li
x
M
2
(MoO
4
)
3
half cells at a low scan rate (0.1 mV/s). The cells were first charged to
extract lithium from the host materials and then discharged to insert lithium in the host
structures. We discovered that all the four materials possess electrochemical reversibility
with regard to Li
+
extraction/insertion. Accordingly, Fig. 7 presents the slow scan cyclic
voltammograms of Li
2
M
2
(MoO
4
)
3
composite electrodes vs. Li/Li
+
cycled between 4.9 V and
1.5 V. It is clearly seen from the CV profiles that Li
2
M
2
(MoO
4
)
3
polyanion materials reveal a
systematic evidence for the electrochemical reversibility through the oxidation and
reduction peaks corresponding to the two transition metal ions, M
2+
[M = Ni, Co] and Mo
6+
.
As for the electrochemical reversibility of Li
2
M
2
(MoO
4
)
3
vs.
Li/Li
+
, during charge (anodic
scan), we observed the first oxidation of Ni
2+
/Ni
3+
at 4.4 V whilst the oxidation of
Co
2+
/Co
3+
was found to occur at 4.3 V. Following the charging process, during discharge,
(cathodic scan), we were able to notice a single peak at 3.2 V corresponding to Ni
3+
/Ni
2+
reduction, and its analogous counterpart, Co
3+
was found to reduce to Co
2+
at 3.1 V. The
shift in the redox potential of M
3+
/M
2+
is correlated to the polyanion (MoO
4
)
2-
in the host
framework structure. In fact, we emphasized this point in some of our publication
(Prabaharan et al., 2004) as reported by Nanjundaswamy et al. (1996), who studied the effect
of NASICON-related framework compounds such as M
2
(SO
4
)
3
and Li
x
M
2
(PO
4
)
3
-1.60E-03
-1.20E-03
-8.00E-04
-4.00E-04
0.00E+ 00
4.00E-04
1 1.5 2 2.5 3 3.5 4 4.5 5
Current / A
Voltage / V vs. Li/Li
+
1
st
Charge
10
th
, 5
th
, 2
nd
, 1
st
Cycle
Mo
6+
/Mo
5+
Mo
4+
/Mo
6+
Mo
5+
/Mo
4+
-3.00 E-04
0.00 E+0 0
3.00 E-0 4
2.8 3.3 3.8 4.3 4.8
Ni
2+
/Ni
3+
Ni
3+
/
Ni
2+
First cycle Ni redox peaks
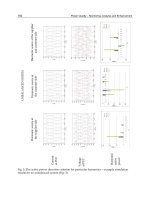
Nextgenerationlithiumionbatteriesforelectricalvehicles104
Fig. 7. Slow scan cyclic voltammetry of Li
2
M
2
(MoO
4
)
3
vs. Li/Li
+
. Scan rate: 0.1 mV/s;
V
max
: 4.9 V (oxidation); V
min
: 1.5V (reduction); Inset: First cycle Ni/Co redox peaks
(Prabaharan et al., 2004).
(M= transition metal) in the context of how a change in the polyanion group shifts the redox
potentials of the M cations and the influence on the Li
+
insertion rate and cyclability of end
member phase transitions of the lithiated and delithiated phases.
-0.00 0 4
-0.00 0 3
-0.00 0 2
-0.00 0 1
0
0.000 1
0.000 2
1 2 3 4 5
Mo
6+
/Mo
5+
3 3.5 4 4.5 5
First c
y
cle Co
redox
p
eaks
Co
2+
/Co
3+
Co
3+
/Co
2+
Mo
4+
/Mo
6+
1
st
Char
g
e
Voltage / V vs. Li
+
/Li
Current / A
-1.75E-03
-1.00E-03
-2.50E-04
5.00E-04
1.25E-03
1.5 1.8 2.1 2.4 2.7 3 3.3 3.6
Volta
g
e /
V vs. Li
+
/Li
Current / A
First Cathodic scan
from OCV
Ni
3+
/Ni
2+
Ni
2+
/Ni
3+
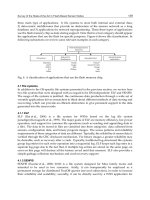
Fig. 8. Slow scan cyclic voltammetry of Li
x
M
2
(MoO
4
)
3
vs. Li/Li
+
. Scan rate: 0.1 mV/s;
V
max
: 3.6/3.5 V (oxidation); V
min
: 1.5V (reduction). (Prabaharan et al., 2004, 2006).
During the continuation of the reduction process down to 1.5 V, two peaks were noticed at
2.6 and 1.9 V in the case of Li
2
Ni
2
(MoO
4
)
3
and at 2.6 and 2 V for Li
2
Co
2
(MoO
4
)
3
indicating
the reduction of Mo
6+
to Mo
5+
and Mo
4+
. During successive cycling, these two peaks were
found to merge into a single broad peak in both cases, implying the slow and steady
dynamics of Li
+
into the active material. Upon further cycling, we were able to observe a
broad anodic peak at 2.6 V representing the Mo oxidation, followed by a high voltage peak
at 4.3 V indicating the oxidation of M
2+
cations back to 3+ state.
The slow scan cyclic voltammograms of Li
x
M
2
(MoO
4
)
3
composite electrodes vs. Li/Li
+
cycled between 1.5 V and 3.6 V [for Li
x
Ni
2
(MoO
4
)
3
] and between 1.5 V and 3.5 V [for
Li
x
Co
2
(MoO
4
)
3
]
are shown in Fig. 8. The cells were first discharged to insert lithium in
M
2
(MoO
4
)
3
framework structure and then charged to extract lithium. The CV profiles
demonstrate the electrochemical reversibility of the material and exhibits the reduction and
oxidation peaks corresponding to the two transition metal ions M
3+
and Mo
6+
.
During the first discharge from OCV, the reduction of M
3+
/M
2+
was observed at 2.6 V and
as the reduction process continues down to 1.5 V, two other broad peaks were observed at
2.1 V and 1.7 V in the case of Li
x
Ni
2
(MoO
4
)
3
due to the reduction of Mo
6+
(to its lower
oxidation states). On the other hand, a single reduction peak was observed at 2.2 V for
Li
x
Co
2
(MoO
4
)
3
indicating two-electron transfer during Mo
6+
reduction. Upon the first charge
after discharge, in lithium-free nickel molybdate, oxidation of Mo back to its higher
oxidation state (6+ state) and Ni
2+
/Ni
3+
transitions were noticed at 2.6 V, 2.7 V and 3.1 V
respectively. Whereas, in lithium-free cobalt molybdate Mo
4+
/Mo
6+
transition was observed
in a single step at 2.65 V which was followed by oxidation of Co
2+
to Co
3+
at 2.8 V. These
observations are similar to Li
2
M
2
(MoO
4
)
3
except for a slight change in the position of the
peaks and peak height. The same trend was observed during extended cycling.
Furthermore, in all the four cases, oxidation and reduction of M and Mo ions (cations and
counter cations) were clearly observed during prolonged cycling. The excellent
electrochemical reversibility of the new materials as evidenced from the CV profiles is an
indication of the appropriateness of the new materials for application in rechargeable
-2 .0 0 E -0 3
-1 .0 0 E -0 3
0 . 0 0 E + 0 0
1 . 0 0 E -0 3
2 . 0 0 E -0 3
3 . 0 0 E -0 3
1 1 . 5 2 2 . 5 3 3 . 5 4
Voltage / V vs. Li
+
/Li
Current / A
Co
3+
/Co
2+
Co
2+
/
Co
3+
Mo
6+
/
Mo
4+
Mo
4+
/Mo
6+
1
st
dischar
g
e from OCV