Báo cáo hóa học: " Intestine-Specific, Oral Delivery of Captopril/ Montmorillonite: Formulation and Release Kinetics" pdf
Bạn đang xem bản rút gọn của tài liệu. Xem và tải ngay bản đầy đủ của tài liệu tại đây (735.39 KB, 8 trang )
NANO EXPRESS Open Access
Intestine-Specific, Oral Delivery of Captopril/
Montmorillonite: Formulation and Release
Kinetics
Suguna Lakshmi Madurai
1
, Stella Winnarasi Joseph
1
, Asit Baran Mandal
1
, John Tsibouklis
2
, Boreddy SR Reddy
1*
Abstract
The intercalation of captopril (CP) into the interlayers of montmorillonite (MMT) affords an intestine-selective drug
delivery system that has a captopril-loading capacity of up to ca. 14 %w/w and which exhibits near-zero-order
release kinetics.
Introduction
Captopril (CP; 1-[(2s)-3-mercapto-2-methyl propionyl]-
L- proline), an orally active inhibitor of angiotensin-
converting enzyme (ACE) [1,2], is in many countries the
medication of choice for the management of hyperten-
sion and is often used to treat some types of congestive
heart failure [3-6]. CP contains a reactive thiol group,
which is postulated to bind to the Zn
2+
of the angioten-
sin-converting enzyme [7] and which forms the disulfide
linkages with thiol-containing r esidues of plasma pro-
teins that are responsible for the e xtensive tissue bind-
ing of the dr ug [8]. Owing to its pKa (3.7 at 25°C), CP
is highly soluble in water at acidic pH (125–160 mg/ml
at pH 1.9). At pH > pKa, the amidic linkage of the
molecule becomes increasin gly susceptible to hydrolysis;
under basic conditions, the drug exhibits a pseudo-first-
order degradation reaction [9,10].
In man, CP reduces plasma angiotensin II and aldos-
terone levels, increases plasma renin activity and pro-
duces a significant decrease in blood pressure in
hypertensive patients [11 ]. It blocks the enzyme system
that causes the relaxation of artery walls, reducing blood
pressure, decreasing symptoms of cystinuria and redu-
cing rheumatoid arthr itis symptoms. The duration of
the antihype rtensive action of a single oral dosing of CP
is 6 –8 h, with the implication that clinical administra-
tion requires the daily dose of 37.5–75.0 mg to be taken
at 8-h intervals [12]. The metabolic products of CP
include a disulfide d imer of CP, a CP-cysteine disulfide
and mixed disulfides with endogenous thio compounds
[13]. In efforts to reduce the frequency of administra-
tion, several attempts have been made to design
sustained release formulations. These have included
coated tablets [14-16], beadlets [17], hydrophobic table ts
[18], pulsatile delivery systems [19], microcapsules [20],
semisolid matrix systems [9], floating t ablets and
capsules [21], and bioadhesive polymers [22].
An evolving approach to controlled drug delivery
involves the use of nanoclays with wel l-defined morphol-
ogies. Montmorillonite (MMT), a swelling clay mineral,
is one such material that has shown considerable promise
as a carrier in controlled drug delivery. Since the mineral
is comprised of alternating negatively charged alumino-
silicate layers with exchangeable counter ions positioned
between each layer [23], the capability of the material to
act as a controlled delivery vehicle is rationalized in
terms of the potential for drug molecules to become
adsorbed onto the hydrated alumino-silicate layers,
which in aqueous media exist as dispersions of individual
platelet. This paper describes an a ttempt to assess the
suitability of MMT to act as a matrix for the controlled
release of CP by evaluating intercalation data from three
methods (solution, melt and grinding) and by considering
the characteristics of CP release.
Materials and Methods
Materials
K10 Montmorillonite nanoclay (specific surface area =
274 m
2
/g, cation exchange capacity = 119 Meq/100 g)
was purchased from Sigma– Aldrich, USA. Captopril
* Correspondence:
1
Industrial Chemistry Laboratory, Central Leather Research Institute, Council
of Scientific and Industrial Research, Chennai 600 020, India.
Full list of author information is available at the end of the article
Madurai et al. Nanoscale Res Lett 2011, 6:15
/>© 2010 Madurai et al. This is an Open Access article distributed u nder the terms of the Creative Commons Attribution License
(http://creative commons.org/licenses/by/2.0), which permits unrestricted use, distribution, and reproduction in any medium, provided
the original work is properly cited.
(Figure 1; melting point 106°C) was sourced from Medrich
pharmaceuticals, Indi a, and was used as received. All the
other chemicals used were of analytical grade.
Preparation of CP-MMT Systems
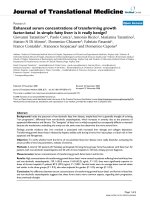
Three methods (solut ion, melt and grinding) were
employed for the intercalation of CP into the MMT
matrix (Figure 2, schematic representa tion of intercala-
tion process).
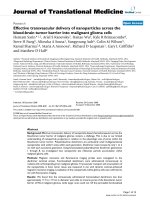
Optimization of Clay Colloidal Dispersion
Accurately weighed amounts of MMT nanoclay (ca.1,2
or 5 g) were dispersed separately in vessels containing
deionized water (100 ml) and allowed to stand for about
15 h and stirred (magnetic stirrer) for 24 h. The colloi-
dal stability of the dispersions was assessed visually over
24 h. Since all dispersions appeared stable within this
timescale, the more concentrated, 5 %w/w MMT,
dispersion was selected for further evaluation (Figure 3).
Solution Intercalation Method
To improve the cation exchange capacity (CEC) of the
clay, MMT-K10 was treated with sodium chloride and
the resultant Na-MMT dispersions were washed with
deionised water (centrifugation) until a AgNO
3
test
confirmed that all chloride had been removed [24].
Figure 1 Structure of CP.
Figure 2 Schematic representation of intercalation of CP into MMT.
Madurai et al. Nanoscale Res Lett 2011, 6:15
/>Page 2 of 8
CP (1.382, 2.765, 3.456 and 4.417 mM) was added to
separate vessels containing the 5 %w/w Na-MMT aqu-
eous dispersion (100 cm
3
) and maintained (stirring) at
50°C for 4 h. To remove a ny free drug, the intercalated
particles were collected following repeated (4×; replacing
the deionized water after each cycle) centrifugation
(4,000 rpm, 20 min) of the dispersion. The isolated CP-
MMT powder was dried in a vacuum oven, ground and
stored in a desiccator. To assess the improvement in
cation exchange capacity following treatment with
sodium, samples of MMT were subjected to an identical
procedure and used as controls.
Melt Intercalation Method
A mixture of MMT and CP (10:9 w/w) was heated
(2°C /min) to the melting point of CP and ma intained at
that temperature for 6 h. The cooled (ro om tempera-
ture) resi due was washed (3×) with deionised water and
dried (room temperature) before use.
Grinding Intercalation Method
A mixture of MMT and CP (10:9 w/w) was ground
finely (ca.30min)usingapestleandmortar,washed
(deionised water, 3×) and dried (desiccator) before use.
In Vitro Drug Release
The simulated gastric fluid was a buffer solution
(pH 1.2) that had been prepared by mixing 250 ml of
aqueous HCl (0.2 M) with 147 ml of aqueous KCl
(0.2 M). The simulated intestinal fluid was a buffer solu-
tion (pH 7.4) that had been prepared by mixing 250 ml
of aqueous KH
2
PO
4
(0.1M)and195.5mlofaqueous
NaOH (0.1 M) [25].
The drug release study was performed in a constant
temperature bath (37°C) fitted with a rotating round-
bottomed flask (100 rpm) by suspending a dialysis mem-
brane bag containing 20 ml of CP-MMT dispersion in
900 ml o f dissolution media. At specified time intervals,
an aliquot (5 ml) of the dissolution medium was
removed and the concentratio n of CP w as determined
by UV absorption measurements, respectively, at 205
and 217 nm for the acidic and basic buffers.
Drug Release Kinetics
To assess the kinetics of CP release, in vitro drug release
data were fitted into established mathematical models.
To assess zero-order release kinetics, the relationship
between t he rate of drug release and its c oncentration
was examined from a plot of percentage drug release vs.
time:
QQKt
too
=+
(1)
where, Q
o
= initial amount of drug, Q
t
=cumulative
amount of drug release at time t, K
o
= zero-order rate
constant and t = time in h.
A log plot of percent drug remaining vs.timeallowed
the assessment of first-order kinetics.
log log / .QQKt
to
=+
1
2 303
(2)
where, K
1
= first-order rate constant.
Fickian diffusion was assessed using the Higuchi
model, which plots percentage drug release against the
square root of time.
QKt
H
=
12/
(3)
where, Q = cumulative drug release at time t and
K
H
= constant reflective of the design variables of the
system.
Additionally, the Korsmeyer–Peppas model, which has
been designed to identify the release mechanism of a
drug/drug carrier system, was employed to assess data
collected during the first 210 min of the in vitro
experiment.
Mt M Ktn/ ∞=
(4)
Where, Mt/M∞ = fraction of drug released at time t,
K = rate constant and n = release exponent.
Values of n between 0.5 and 1.0 are indicative of
anomalous, non-Fickian, kinetics [26].
Characterization
The concentration of CP was determined from calibra-
tion plots of absorbance (SHIMADZU UV 240 Spectro-
photometer; quartz ce ll path length = 1 cm) at 205 nm
Figure 3 Colloidal dispersions.
Madurai et al. Nanoscale Res Lett 2011, 6:15
/>Page 3 of 8
orat217nmforthemoleculeinacidicoralkalinebuf-
fer, respectively. Infrared spectra (KBr disks) were
recorded using a PERKIN-ELMER Spectrum RX1, FTIR
V.2.00 spectrophotometer. X-ray diffraction (XRD) pat-
terns were recorded using a SIEMENS D-500 variable
angle diffractometer (CuKa source, l = 1.5405 A°;
1– 60°). Thermogravimetric deter minations (37–800°C,
10°C/min; TA instruments TGA Q50) were carried out
under nitrogen.
Results and Discussion
CP-MMT Intercalation
The drug-loading capacities for CP-MMT systems that
had been formed by the solution, melt an d grinding
methods are presented in Figure 4. In accord with the
susceptibility of CP (pKa = 3.7) to hydrolytic degrada-
tion, solution intercalation was performed in acidic
media. The CP-loading capacity of Na-MMT was very
similar to that of MMT-K
10
.
FT-IR Analysis
In Figure 5 are presented the infrared spectra of pure
MMT, pure CP and CP-MMT composites that had
been prepared using the soluti on, melt or gri nding
methods. The spectrum o f pure MMT is characterized
by the stretching and be nding vibrations of Si– O– Si
and Si– O– Al, correspondingly at 1,048 cm
-1
and
528.57 cm
-1
, and by the 919 cm
-1
stretch of Al– Al–
OH moieties in the octahedral layer. Interlayer water is
manifest by the broad – O– H stretching band at ca.
3,400 cm
-1
. The bands at 3,623 cm
-1
and at 3,698 cm
-1
are respectively attributed to the –OH stretch of Al–
OH and tha t of Si – OH [25]. The –OH bending mode
of absorbed water is evidenced as a series of overlap-
ping bands at 1,661 cm
-1
. I n the spectrum of pure CP,
the C=O stretching mode, amide absorption, S– H
stretch and C– S stretch are respectively seen at
1,751 cm
-1
, 1,587 cm
-1
, 2,570 cm
-1
and 678 cm
-1
.The
spectra of the CP-MMT systems were dominated by
the features of MMT, but there was considerable v aria-
tion in the shape, position and relative intensity o f
individual spectral features. The band at 1,751 cm
-1
,
which is absent in the spectrum of MMT but features
strongly in that of CP, is interpreted as evidence for
CP-MMT int ercalation.
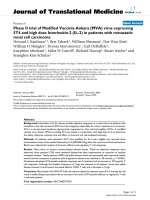
XRD Analysis
Comparison of the XRD pattern of pure MMT with
those of CP-MMT composites from solution, melt or
grinding methods (Figure 6) confirms that the clay
retains its structure following intercalation. Consistent
with previous reports that t he method of intercalation
impacts upon the d-spacing of t he carrier mineral
[27,28], the characteristic (001) peak of pure MMT
(2[θ] = 9 .9°) shifts to 11, 11.5 and 9. 6°, respectively, for
CP-MMT composites prepared by solution, melt or
grinding methods. The interlayer distances CP-MMT
systems prepared by solution, melt and gri nding meth-
ods were characterized by respective basal spacing
values of 1.7, 2.4 and 1.6 nm (Table 1). S ince the corre-
sponding distance for MMT is 1.3 nm, the more open
structure at the (001) plane of CP-MMT composites is
interpreted as evidence for the successful intercalation
of CP into the interlayer structure of the mineral.
Figure 4 Drug-loading capacities of CP-MMT systems prepared
by solution, melt and grinding intercalation.
Figure 5 FT-IR spectra of CP, MMT and of CP-MMT systems.
Madurai et al. Nanoscale Res Lett 2011, 6:15
/>Page 4 of 8
Thermogravimetric Analysis
The thermogram of MMT is characterized by a 7%
mass loss, which at the heating rate of 10°C/min
occurred over the temperature range of 48–120 °C and
is consistent with the desorption of water molecules
from MMT. The thermograms of CP-MMT systems
are characterized by the decomposition of intercalated
CP (200– 250°C) and by a second mass loss of 6%
(430– 450°C), which corresponds to the structural
dehydroxylation of MMT, Figure 7.
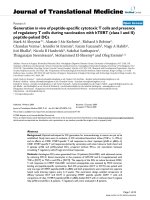
CP Release Profiles
The controlled release patterns and pH dependences of
the rate of CP release from each of the CP-MMT matrixes
are illustrated by the cumulative drug release data pre-
sented in Figures 8 and 9. In i ntestinal-fluid-mimicking
medium (pH 7.4), CP release over 9 h was 22, 21 and 4%,
0 5 10 15 20 25 30 35 40 45 50 55 60
By Melting
MMT
2 theta (de
g
ree)
By Grinding
By Solution
Relative Intensity
Figure 6 XRD patterns for MMT and for CP-MMT systems.
Table 1 Basal spacings of CP-MMT systems, as
determined by XRD
Intercalation
method
Drug loaded amount
(mmol/g)
Interlayer distance
(nm)
MMT – 1.3
CP-MMT by
solution
0.498 1.7
CP-MMT melt 0.593 2.4
CP-MMT grinding 0.137 1.6
Figure 7 Thermograms of CP-MMT systems.
2.5
3.5
4.5
5.5
6.5
7.5
8.5
12345678910
Cumulative % drug release
Time (h)
Soluion
Melt
Grinding
Drug release at pH 1.2
Figure 8 Drug release patterns of CP-MMT systems at
pH = 1.2.
0
5
10
15
20
25
12345678
Cumulative % drug release
Time (h)
Solution
Melt
Grinding
Drug release at pH 7.4
Figure 9 Drug release patterns of CP-MMT systems at
pH = 7.4.
Madurai et al. Nanoscale Res Lett 2011, 6:15
/>Page 5 of 8
respectively, for CP-MMT prepared by the melt, solution
and grinding methods, Table 2. Corresponding values for
the gastric-fluid-mimicking medium (pH 1.2) were consid-
erably lower, indicating the potential of the formulation to
exhibit small-intestine selectivity.
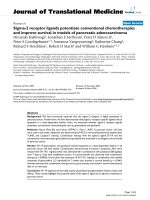
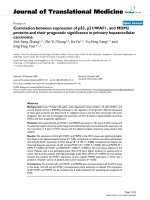
Drug Release Kinetics
Fitting of the data, from the in vitro release of CP from the
CP-MMT matrix, to the theoretical models (Figures 10
and 11) showed that, at both pH values considered, the
release profiles of formulations prepared in the melt or by
grinding were consistent with ne ar-zero-order kinetics.
Comparison of the correlation coefficients (R
2
,Tables3
and 4) identified the Higuchi model as that which fits the
data best, irrespective of the pH of the release medium. In
all the cases, values of n < 0.5 indicated that the drug dif-
fusion mechanism is classical, non-Fickian releas e, which
is assumed to b e facilitated by the swelling o f the clay
matrix [29]. The application of the Korsmeyer– Peppas
model was consistent with the suitability of the CP-MMT
system to act as an orally administered vehicle for the
sustained release of CP [30].
Conclusions
CP has been confirmed to successfully intercalate into
the interlayers of MMT. The maximum percentage of
intercalated CP was determined as ca. 14 %w/w. In vitro
Table 2 Drug release profiles of CP-MMT systems
Intercalation method Drugloaded amount
(mmol/g of clay)
Drug release rate
(%) at
pH 1.2 pH 7.4
Solution 0.498 7.2 22.0
Melt 0.593 8.1 21.0
Grinding 0.137 4.5 7.1
R² = 0.963
R² = 0.984
R² = 0.859
0
1
2
3
4
5
6
7
8
9
Cumulative % drug release
Zero order: At pH 1.2
Solution
Melt
Grinding
R² = 0.964
R² = 0.955
R² = 0.849
1.955
1.96
1.965
1.97
1.975
1.98
1.985
1.99
Log % (100-R)
Time (h)Time (h)
First order : At pH 1.2
Soluion
Melt
Grinding
R² = 0.977
R² = 0.973
R² = 0.842
2
3
4
5
6
7
8
9
Cumulative % of drug release
Time
Higuchi : At pH 1.2
Solution
Melt
Grinding
R² = 0.950
R² = 0.956
R² = 0.84
0.2
0.3
0.4
0.5
0.6
0.7
0.8
0.9
1
0 20 40 60 80 100 120 0 20 40 60 80 100 120
1357911 0.5 1 1.5 2 2.5
Log % release
Log Time
Korsemeyer-peppas : At pH 1.2
Solution
Melt
Grinding
Figure 10 Zero order, First order, Higuchi and Koresmeyer–Peppas kinetic models at pH 1.2.
Madurai et al. Nanoscale Res Lett 2011, 6:15
/>Page 6 of 8
R² = 0.962
R² = 0.984
R² = 0.939
0
5
10
15
20
25
Cumulative % drug release
Time (h)
Zero order : At pH 7.4
Solution
Melt
Grinding
R² = 0.980
R² = 0.982
R² = 0.939
1.88
1.9
1.92
1.94
1.96
1.98
2
Log %(100-R)
Time (h)
First order : At pH 7.4
Solution
Melt
Grinding
R² = 0.987
R² = 0.975
R² = 0.911
0
5
10
15
20
25
Cumulative % of drug release
Time
Higuchi : At pH 7.4
Solution
Melt
Grinding
R² = 0.985
R² = 0.948
R² = 0.859
0
0.2
0.4
0.6
0.8
1
1.2
1.4
1.6
0123456789 0123456789
0.8 1.3 1.8 2.3 2.8 0 0.2 0.4 0.6 0.8 1
Log % release
Log Time
Korsemeyer-peppas: At pH 7.4
Solution
Melt
Grinding
Figure 11 Zero order, First order, Higuchi and Koresmeyer–Peppas kinetic models at pH 7.4.
Table 3 Parameters for CP release at pH 1.2
pH 1.2 Zero order First order Higuchi Koresmeyer–Peppas
R
2
R
2
R
2
R
2
n
Solution 0.963 0.964 0.977 0.950 0.255
Melt 0.984 0.955 0.973 0.956 0.391
Grind 0.859 0.849 0.842 0.840 0.091
Table 4 Parameters for CP release at pH 7.4
pH 7.4 Zero order First order Higuchi Koresmeyer–Peppas
R
2
R
2
R
2
R
2
n
Solution 0.962 0.980 0.987 0.985 0.466
Melt 0.984 0.982 0.975 0.948 0.551
Grind 0.939 0.939 0.911 0.859 0.321
Madurai et al. Nanoscale Res Lett 2011, 6:15
/>Page 7 of 8
release experiments have shown that the release of CP
from the MMT matrix is sensitive to the pH of the dis-
solution media. The CP release rate in simulated intest-
inal fluid (pH 7.4) is significantly higher than that in
simulated gastric fluid (pH 1.2) and exhibits near-zero-
order release kinetics.
Acknowledgements
One of the authors (JWS) is grateful to CSIR for funding as a Project
Assistant in the NWP-035 project.
Author details
1
Industrial Chemistry Laboratory, Central Leather Research Institute, Council
of Scientific and Industrial Research, Chennai 600 020, India.
2
Biomaterials &
Drug Delivery Research Group, School of Pharmacy and Biomedical Sciences,
University of Portsmouth, Portsmouth, Hampshire PO1 2DT, UK.
Received: 3 July 2010 Accepted: 5 August 2010
Published: 27 August 2010
References
1. Ferguson RK, Brunner HR, Turini GA, Gavras H, McKinstry DN: Lancet 1977,
1:775.
2. Ondetti MA, Rubin B, Cushman DW: Science 1977, 196:441.
3. Gavras H, Brunner HR, Turini GA, Kershaw GR, Tifft CP, Guttelod S, Gavras I,
Ukovish RA, McKinstry DN: New Engl J Med 1978, 298:991.
4. Bravo EL, Tarazi RC: Hypertension 1979, 1:39.
5. Brunner HR, Gavras H, Waebar B, Kershaw GR, Turini GA, Vukovish RA,
McKinstry DN: Ann Intern Med 1979, 90:19.
6. Testa MA, Anderson RB, Nackley JF, Hollenberg NK: New Engl J Med 1993,
328:907.
7. Antonaccio MJ: Ann Rev Pharmacol Toxicol 1982, 22:57.
8. Komai T, Ikeda T, Kawai K, Kameyama E, Shendo H: J Pharmacobio-Dynam
1981, 4:677.
9. Seta Y, Higuchi F, Kawahara Y, Nishimura K, Okada R: Int J Pharm 1988,
41:245.
10. Anaizi NH, Swenson C: Am J Hosp Pharm 1993, 50:486.
11. Horovitz SP: Angiotensin Converting Enzyme Inhibitors, Mechanisms of
Action and Clinical Implications: Procceedings of the A. N. Richards
Symposium Sponsored by the Physiological Society of Philadelphia.
Urban & Schwarzenberg, Baltimore-Munich; 1981.
12. Miazaki N, Shionoiri H, Uneda S, Uneda G, Yasuda G, Gotoh E, Fujishima S,
Kaneko Y, Kawahara Y, Yamazaki Y: Nippon Jinzo Gakkai Shi 1982, 24:421.
13. Migdalof BH, Wong KK, Lan SJ, Kripalani KJ, Singhvi SM: Fed Proc 1980,
39:757.
14. Drost JD, Reier GE, Jain NB: U.S. Patent 4756911 1988.
15. Guittard GV, Carpenter HA, Quan ES, Wong PS, Hamel LG: US patent
5178867 1993.
16. Nahata MC, Morosco RS, Hipple TF: Am J Hosp Pharm 1994, 51:95.
17. Joshi YM, Bachman WR, Jain NB: European Patent EP 288732 A2 1988.
18. Thakur AB, Jain NB: U.S. Patent 4738850 1988.
19. AprRashid A: British Patent Application 2230441A 1990.
20. Singh J, Robinson DH: Drug Dev Ind Pharm 1988, 14:545.
21. Matharu RS, Singhavi NM: Drug Dev Ind Pharm 1992, 18:1567.
22. DeCrosta MT, Jain NB, Rudnic EM: U.S. Patent 4666705 1987.
23. Sposito G, Skipper NT, Sutton R, Park SH, Soper AK, Greathouse JA: Proc Natl
Acad Sci 1999, 96:3358.
24. Bergaya F, Theng BKG, Lagaly G: Handbook of clay science. Elsevier
publication, Amsterdam; 2006.
25. Ghanshyam VJ, Hasmukh AP, Bhavesh DK, Hari CB: Appl Clay Sci 2009,
45:248.
26. Peppas NA, Sahlin JJ: Int J Pharm 1989, 57:169.
27. Reed-Hill RE, Abbaschain R: Physical metallurgy principles. PWS publishing
Company, Boston; 3 1994.
28. Suguna Lakshmi M, Sriranjani M, Bava Bakrudeen H, Suresh Kannan A,
Mandal AB, Reddy Boreddy SR: Appl Clay Sci 2010, 48:589.
29. Pradhan R, Budhathoki U, Thapa P: J Sci Eng Technol 2008, 1:55.
30. Korsmeyer RW, Gurny R, Doelker E, Buri P, Peppas NA: Int J Pharm 1983,
15:25.
doi:10.1007/s11671-010-9749-0
Cite this article as: Madurai et al.: Intestine-Specific, Oral Delivery of
Captopril/Montmorillonite: Formulation and Release Kinetics. Nanoscale
Res Lett 2011 6:15.
Submit your manuscript to a
journal and benefi t from:
7 Convenient online submission
7 Rigorous peer review
7 Immediate publication on acceptance
7 Open access: articles freely available online
7 High visibility within the fi eld
7 Retaining the copyright to your article
Submit your next manuscript at 7 springeropen.com
Madurai et al. Nanoscale Res Lett 2011, 6:15
/>Page 8 of 8