Báo cáo hóa học: " Research Article A Sparsity-Based Approach to 3D Binaural Sound Synthesis Using Time-Frequency Array Processing" ppt
Bạn đang xem bản rút gọn của tài liệu. Xem và tải ngay bản đầy đủ của tài liệu tại đây (1.25 MB, 13 trang )
Hindawi Publishing Corporation
EURASIP Journal on Advances in Signal Processing
Volume 2010, Article ID 415840, 13 pages
doi:10.1155/2010/415840
Research Article
A Sparsity-Based Approach to 3D Binaural Sound Synthesis Using
Time-Frequency Ar ray Processing
Maximo Cobos,
1
Jose J. Lopez (EURASIP Member),
1
and Sascha Spors (EURASIP Member)
2
1
Institute of Telecommunications and Multimedia Applications, Universidad Polit
´
ecnica de Valencia, 46022 Valencia, Spain
2
Deutsche Telekom Laboratories, Technische Universit
¨
at Berlin, 10578 Berlin, Germany
Correspondence should be addressed to Maximo Cobos,
Received 2 March 2010; Revised 21 June 2010; Accepted 7 September 2010
Academic Editor: Augusto Sarti
Copyright © 2010 Maximo Cobos et al. This is an open access article distributed under the Creative Commons Attribution
License, which permits unrestricted use, distribution, and reproduction in any medium, provided the original work is properly
cited.
Localization of sounds in physical space plays a very important role in multiple audio-related disciplines, such as music,
telecommunications, and audiovisual productions. Binaural recording is the most commonly used method to provide an
immersive sound experience by means of headphone reproduction. However, it requires a very specific recording setup using
high-fidelity microphones mounted in a dummy head. In this paper, we present a novel processing framework for binaural
sound recording and reproduction that avoids the use of dummy heads, which is specially suitable for immersive teleconferencing
applications. The method is based on a time-frequency analysis of the spatial properties of the sound picked up by a simple
tetrahedral microphone array, assuming source sparseness. The experiments carried out using simulations and a real-time
prototype confirm the validity of the proposed approach.
1. Introduction
Human hearing plays a major role in the way our environ-
ment is perceived. Generally, sound is perceived in all three
dimensions, width, height, and depth, which are all necessary
to achieve a natural perception of sound [1]. These attributes
are usually employed to describe the spatial characteristics
of sound taking into account its diffuseness properties. The
human auditory system is very sophisticated and, thus,
capable to analyze and extract most spatial information
pertaining to a sound source using two ears. In fact, when
a sound scene is recorded by a single microphone, we are still
able to recognize the original sound events. However, much
of the information corresponding to the spatial properties of
these events is lost. As a result, spatial sound recording and
reproduction techniques are always based on a multichannel
approach.
Reproduction using two-channels or stereo is the most
common way that most people know to convey some spatial
content into sound recording and reproduction, and this
can be considered as the simplest approximation to spatial
sound. On the other hand, surround sound systems have
evolved and entered homes in order to give a better sensation
than stereo by using more reproduction channels and have
been widely utilized in theaters since the middle 70s. Both
stereo and surround systems have an optimal listening posi-
tion, known as sweet spot [2]. This optimum listening area is
almost limited to the central point in the loudspeaker setup.
Outside the central zone, the perceived virtual source loca-
tions differ significantly from their intended spatial position.
Another much more realistic strategy is to reproduce
directly in the ears of the listener, via headphones, the signal
that he/she would perceive in the acoustic environment that
is intended to be simulated. This strategy is widely known
as binaural reproduction. The signals to be reproduced with
headphones can be recorded with an acoustic dummy head
or they can be artificially synthesized by using a measured
Head-Related Transfer-Function (HRTF) [3]. In an anechoic
environment, as sound propagates from the source to the
listener, its own head, pinna, and torso introduce changes to
the sound before it reaches the ear drums. These effects of
the listener’s body are registered by the HRTF, which is the
transfer function between the sound pressure that is present
at the center of the listener’s head when the listener is absent
2 EURASIP Journal on Advances in Signal Processing
Analysis stage Synthesis stage
x
1
(t)
.
.
.
x
4
(t)
STFT
x
1
(k, r)
.
.
.
x
4
(k, r)
3D DOA
estimation
θ(k, r)
φ(k, r)
Time-frequency
selective HRTF
filtering
HRTF
data
Y
L
(k, r)
Y
R
(k, r)
STFT
−1
x
L
(t)
x
R
(t)
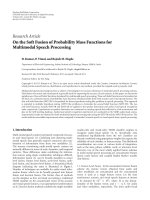
Figure 1: Block diagram of the proposed 3D binaural synthesis method.
and the sound pressure developed at the listener’s ear. Since
humans have different-sized heads, torsos, and ear shapes,
HRTFs vary from person to person. The HRTF is a function
of direction, distance, and frequency. The inverse Fourier
transform of the HRTF is the Head-Related Impulse Response
(HRIR), which is a function of direction, distance, and time.
Using binaural sound reproduction, it is possible to create
a very convincing and immersive sound experience that
provides the listener with a natural perception of localized
sound events.
In this paper, we present a novel method to capture and
process the spatial characteristics of sound with the aim
of providing a real-time 3D audio experience. Instead of
using an expensive dummy head setup, a small tetrahedral
microphone array is utilized to discriminate among the
three spatial dimensions, providing a cheap and effective
way of constructing a full 3D audio system. The proposed
technique is based on a two-step approach. In a first analysis
stage, the signals captured by each microphone pair are
processed in the time-frequency domain, resulting in a
complete directional description of the recorded sound. In
the synthesis stage, source sparseness is assumed, and each
time-frequency bin is selectively filtered using a different
HRTF depending on its estimated direction.
Figure 1 summarizes the steps involved in the proposed
approach for binaural sound synthesis.
(1) The signals obtained by the microphones of the array
enter the analysis stage.
(2) In the analysis stage, the four signals are first trans-
formed into the time-frequency domain by means
of the Short-Time Fourier Transform (STFT). Then,
Direction-of-Arrival (DOA) information (azimuth
and elevation) for each time-frequency bin is
extracted using the processing described in Section 3.
(3) The synthesis stage is based on a time-frequency
selective HRTF filtering of one of the input micro-
phone signals. This filtering is carried out selectively
in the STFT domain according to the directions
estimated in the analysis stage, resulting in the output
signals for the left and right ears. Finally, the ear
signals are transformed back to the time domain
using the inverse STFT operator.
The paper is structured as follows. Section 2 provides a
review of multisource binaural synthesis techniques closely
related to our work. Section 3 presents the processing
techniques involved in the analysis stage of the method,
describing the signal model and the array geometry used
to estimate the directional information. Section 4 is devoted
to the synthesis stage of the method, where the analyzed
spatial information is used to create an immersive 3D sound
scene. Section 5 presents a performance comparison between
conventional binaural reproduction and our sparsity-based
approach using synthetic mixtures of speech and music
sources. Section 6 describes and evaluates a real-time pro-
totype that implements the processing described in this
paper. Finally, in Section 7, the conclusions of this work are
summarized.
2. Binaural Sound Synthesis
2.1. Multisource Binaural Sound Synthesis. It is widely known
that binaural sound synthesis is a technique capable of
reproducing a virtual sound image of a recorded sound
signal at an apparent position in the three-dimensional
space. Binaural synthesis is based on the use of HRTFs (or
their HRIRs time-domain representation) to filter the audio
streams corresponding to different sound sources located at
different spatial positions, creating a highly immersive audio
experience. As a result, to render N sound sources positioned
at N different locations it is necessary to use 2N filters (N
for the left ear and N for the right ear). The computational
complexity is therefore very dependent on the number of
sound sources, which makes the real-time rendering of
multiple sound sources a very intensive computational task
[4, 5]. In this context, many approaches have been proposed
to reduce the complexity of multisource binaural synthesis,
many of them based on paramet ric HRTFs [6]. Experiments
with parametric HRTFs have confirmed that subjects cannot
discriminate the parametric HRTF versions from the original
ones if a suitable set of parameters are selected within
each critical band [7]. Breebaart et al. [8] proposed some
methods to provide a multichannel audio experience over
stereo headphones from a mixdown of sound source signals
and a parametric representation (spatial parameters) of the
multichannel original signal in a time-frequency domain.
The binaural synthesis stage combines the spatial parameters
EURASIP Journal on Advances in Signal Processing 3
of the multichannel signal with the HRTF parameters that
describe the virtual loudspeaker setup, resulting in a set of
combined binaural parameters that are later used to modify
the downmix signal. These rendering methods provide high-
quality binaural reproduction of multichannel audio and can
be easily combined with multichannel audio coders such as
MPEG surround.
Despite being powerful and promising, the above
approaches are substantially different from the application
covered in this paper. The reason is that they are mainly based
on a time-frequency analysis of different loudspeaker signals
whereas our proposed method takes as input the signals from
a small microphone array, which are successfully employed
to describe the sound field in one point of the three-
dimensional space. Therefore, the proposed method shares
more similarities with another spatial sound processing
technique known as D irectional Audio Coding.
2.2. Directional Audio Coding. Directional Audio Coding
(DirAC) is a recently proposed method for spatial sound
recording and reproduction [9] which shares many simi-
larities with the binaural synthesis technique described in
this paper. In a first analysis stage, DirAC uses typically
a B-format microphone to capture the spatial properties
of the sound recorded in a given environment (although
other alternatives can also be used [10]). In a second stage,
the analyzed spatial features are employed to reproduce the
recorded sound again by means of an arbitrary loudspeaker
setup. Note that although B-format signals are used, there
are substantial differences with conventional Ambisonics
reproduction [11].
More recently, a binaural synthesis version of DirAC
has been proposed to provide spatial sound reproduction
over headphones using the conventional DirAC scheme [12].
The main features of this version and their relation to our
proposed approach are next discussed.
2.2.1. DirAC Analysis and Synthesis. The analysis stage of
DirAC is based on a time-frequency processing of the B-
format input signals to estimate direction and diffuseness
parameters. To this end, an energetic analysis based on
pressure and velocity signals is carried out, which needs
for an adequate calibration before starting the processing
[13]. Besides using a B-format microphone, different array
structures can be employed in this analysis stage with the
aim of estimating the necessary direction and diffuseness
parameters.
Regarding DirAC synthesis, several alternatives have
also been proposed. In the low-bit-rate version, only one
omnidirectional signal is transmitted along with the spatial
metadata, which is used as the signal that is processed
and applied to all the reproduction loudspeakers. Another
version uses B-format signals to construct a set of virtual
microphone signals that are similarly processed using the
metadata obtained from the analysis stage [9].
The transmitted signals are divided into two different
streams: the diffuse and the nondiffuse sound stream. The
nondiffuse sound is assumed to be the part of sound that
has a clear direction and is reproduced by the loudspeaker
setup using vector base amplitude panning (VBAP) [14]. In
contrast, the diffuse sound stream is assumed to surround
the listener and the input signal is decorrelated and played
from multiple loudspeakers.
The binaural version of DirAC follows a philosophy sim-
ilar to that of Breebaart’s work in that a virtual loudspeaker
setup is assumed and implemented by means of HRTF data.
Both diffuse and nondiffuse sound streams are processed in
the same way as in the real loudspeaker version but using
virtual loudspeakers simulated by means of HRTFs [15].
2.2.2. Relation to the Proposed Approach. As previously com-
mented, DirAC shares many similarities with the binaural
synthesis method proposed in this paper, which is also based
on a two-step approach. However, substantial differences can
be found both in the analysis and the synthesis stages of the
algorithm.
As will be seen in Section 3.3, amplitude calibration is
not necessary in our proposed analysis stage, since DOA
estimation is based only on phase information. Although
different microphone array alternatives have already been
proposed for DOA estimation in a DirAC context, they either
are limited to DOA estimation in the horizontal plane [16]or
they use more than 4 microphones [17, 18
]. Moreover, as will
be later explained, diffuseness is not directly estimated in our
proposed approach since the synthesis stage does not rely on
this parameter.
On the other hand, the synthesis stage does not assume
a virtual loudspeaker setup nor makes a different treatment
between diffuse and nondiffuse components. This makes
the synthesis processing even more simple than in DirAC.
In fact, in our method, diffuseness information is assumed
to be inherently encoded by the DOA estimates since the
variance found on the directional information over the
time-frequency domain is already a representation of the
diffuseness characteristics of the recorded sound. In this
context, there is no need for assuming a specific loudspeaker
reproduction setup since each time-frequency element is
binaurally reproduced according to its estimated direction.
3. Analysis Stage
3.1. Signal Model. The signals recorded by a microphone
array, with sensors denoted with indices m
= 1,2, , M in
an acoustic environment where N sound sources are present,
can be modeled as a finite impulse response convolutive
mixture, written as
x
m
(
t
)
=
N
n=1
L
m
−1
=0
h
mn
(
)
s
n
(
t
−
)
, m = 1, , M,
(1)
where x
m
(t) is the signal recorded at the mth microphone
at time sample t, s
n
(t) is the nth source signal, h
mn
(t) is the
impulse response of the acoustic path from source n to sensor
m,andL
m
is the maximum length of all impulse responses.
The above model can also be expressed in the STFT
domain. This transform divides a time domain signal into
a series of small overlapping pieces; each of these pieces is
4 EURASIP Journal on Advances in Signal Processing
windowed and then individually Fourier transformed [19].
Using this transform, the model of (1) can be expressed as
X
m
(
k, r
)
=
N
n=1
H
mn
(
k
)
S
(
k, r
)
,
(2)
where X
m
(k, r) denotes the STFT of the mth microphone
signal, being k and r the frequency index and time frame
index, respectively. S
n
(k, r) denotes the STFT of the source
signal s
n
(t)andH
mn
(k) is the frequency response from source
n to sensor m. Note that (2)isonlyequivalentto(1) in the
case when the analysis window in the computation of the
STFT is longer than L
m
.
If we assume that the sources rarely overlap at each time-
frequency point, (2) can be simplified as follows:
X
m
(
k, r
)
≈ H
ma
(
k
)
S
a
(
k, r
)
,
(3)
where S
a
(k, r) is the dominant source at time-frequency
point (k, r). To simplify, we assume an anechoic model
where the sources are sufficiently distant to consider plane
wavefront incidence. Then, the frequency response is only
a function of the time-delay τ
mn
between each source and
sensor
H
mn
(
k
)
= e
j2πf
k
τ
mn
,
(4)
f
k
being the frequency corresponding to frequency index k.
3.2. Sparsity and Disjointness. Speech and music signals have
been shown to be sparse in the time-frequency domain [20].
A sparse source has a peaky probability density function; the
signal is close to zero at most time-frequency points, and has
large values in rare occasions. This property has been widely
applied in many works related to source signal localization
[21, 22] and separation [23, 24] in underdetermined situa-
tions, that is, when there are more sources than microphone
signals. However, source sparsity alone is useless if the
sources overlap to a high degree. The disjointness of a mixture
of sources can be defined as the degree of nonoverlapping of
the mixed signals. An objective measure of disjointness is the
so-called W-Disjoint Orthogonality (WDO) [25, 26].
Spectral overlapping depends not only on source sparsity,
but also on the mutual relationships between signals. Highly
uncorrelated signals will result in a low probability of
overlapping. This is even truer for statistically independent
signals, since independence is a stronger requirement than
uncorrelation. Speech signals most often mix in a random
and uncorrelated manner, such as in the cocktail party
paradigm. With music mixtures, the situation is different.
Their disjointness will vary strongly according to music type.
Tonal music will result in strong overlaps in frequency, while
atonal music will be more disjoint in frequency [27].
The disjointness properties of speech and music signals
are dependent on the window size parameter, which affects
the number of frequency bands in the analysis. In particular,
the disjointness of speech signals decreases when the window
size is very large as a consequence of the reduced temporal
resolution. For music signals, frequency disjointness plays a
z
4
2
3
1
d
n
R
p
1
p
2
p
3
p
4
y
φ
n
θ
n
x
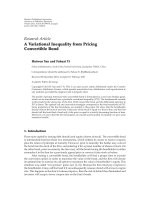
Figure 2: Tetrahedral microphone array for 3D DOA estimation.
more important role than time disjointness and so frequency
resolution should be favored with longer analysis windows.
Moreover, as expected, mixtures of correlated melodies
shown to be less disjoint than uncorrelated ones due to the
higher amount of spectral and temporal overlapping.
It is also worth to remark that the sparsity and
disjointness properties of audio signals become affected
in reverberant environments. The room impulse response
smears the energy in both time and frequency and so
the spectral overlap between different sources in the time-
frequency domain is increased with reverberation. Despite
this effect, the assumption of nonoverlapping sources has
been shown to be still useful for sparsity-based applications
such as source separation [28, 29].
3.3. Array Geometry and DOA Estimation. Now consider a
tetrahedral microphone array (M
= 4) with base radius R,
as shown in Figure 2. The sensor location vectors in the 3-
dimensional space with origin in the array base center, are
given by
p
1
=
[
R,0,0
]
T
,
p
2
=
−
R
2
,
√
3
2
R,0
T
,
p
3
=
−
R
2
,
−
√
3
2
R,0
T
,
p
4
=
0, 0, R
√
2
T
.
(5)
The DOA vector of the nth source as a function of the
azimuth θ
n
and elevation φ
n
angles is defined as
d
n
=
cos θ
n
cos φ
n
,sinθ
n
cos φ
n
,sinφ
n
T
.
(6)
EURASIP Journal on Advances in Signal Processing 5
The source to sensor time delay with respect to the origin
is given by τ
mn
= p
T
m
d
n
/c, c being the speed of sound.
Therefore, the frequency response of (4)canbewrittenas
H
mn
(
k, r
)
≈ e
j(2πf
k
/c)p
T
m
d
n
.
(7)
Taking into account this last result and (3), it becomes
clear that the phase difference between the microphone pair
formed by sensors i and j,isgivenby
∠
X
j
(
k, r
)
X
i
(
k, r
)
≈
2πf
k
c
p
j
− p
i
T
d
n
,(8)
where ∠ denotes the phase of a complex number.
Using a reference microphone q, the phase difference
information at point (k, r)ofM
− 1 microphone pairs is
stored in the vector
b
q
(
k, r
)
=
∠
X
1
(k, r)
X
q
(k, r)
, , ∠
X
M
(k, r)
X
q
(k, r)
T
,
(9)
forming the following system of equations:
b
q
(
k, r
)
=
2πf
k
c
Pd
n
,
(10)
where
P
=
p
1q
, , p
Mq
T
, p
nq
= p
n
− p
q
.
(11)
Finally, the DOA at time-frequency bin (k, r) is obtained
by taking the inverse of the P matrix
d
n
(
k, r
)
=
c
2πf
k
P
−1
b
q
(
k, r
)
.
(12)
Theregulartetrahedralgeometryusedinthispaper
leads to the following simple equations for d
n
(k, r) =
[
d
1
,
d
2
,
d
3
]
T
:
d
1
= cos θ
n
cos φ
n
=
c
2πf
k
1
√
3
(
b
2
+ b
3
)
,
d
2
= sin θ
n
cos φ
n
=
c
2πf
k
(
b
3
− b
2
)
,
d
3
= sin φ
n
=
c
2πf
k
⎡
⎣
1
√
6
(
b
2
+ b
3
)
−
3
2
b
4
⎤
⎦
,
(13)
where b
n
is the nth element of the vector b
1
(k, r) (reference
microphone q
= 1). The azimuth angle is obtained using the
four quadrant inverse tangent function:
θ
n
(
k, r
)
= atan
360
◦
d
1
,
d
2
. (14)
The elevation angle is directly obtained as
φ
n
(
k, r
)
= sin
−1
d
3
. (15)
Note that for each time-frequency point (k, r), estimating
the 3D direction of arrival is relatively simple, just using
the observed phase differences between 3 microphone pairs
of the array. Another aspect to consider is spatial aliasing.
The distance between microphones determines the angular
aliasing frequency. Due to the 2π ambiguity in the calculation
of the phase differences, the maximum ambiguity-free
frequency in a microphone pair subarray would be given
by f
k
= c/2d,whered is the separation distance between
the capsules. Beyond this frequency, there is not a one-
to-one relationship between phase difference and spatial
direction. However, small arrays with d
≈ 1.5cm provide
an unambiguous bandwidth greater than 11 kHz, covering a
perceptually important frequency range.
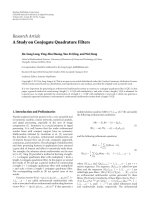
3.4. Example. With the objective of showing how this anal-
ysis stage is capable of capturing the 3D spatial information
of sound, we show a simulated sound scene where 4 speech
sources are simultaneously active. The simulation has been
carried out considering a shoe-box-shaped room (3.6 m
×
3.6 m × 2.2 m) with reflecting walls (reverberation time
T
60
= 0.1 s). The azimuth angles of the sources were
θ
1
= 15
◦
, θ
2
= 75
◦
, θ
3
= 210
◦
,andθ
4
= 260
◦
.The
elevation angles were φ
1
= 0
◦
, φ
2
= 30
◦
, φ
3
=−10
◦
,
and φ
4
= 45
◦
. Figure 3(a) shows the source locations in the
3D space. Figures 3(b) and 3(c) show the 2D histograms of
the distribution of DOA estimates in the XY and ZY plane,
where red color means that many estimates are concentrated
on the same location. Note how most DOA estimates
are concentrated around the actual source directions. The
deviations in the estimates are a consequence of room
reflections and interference. The effect of reverberation in
sparse source localization was studied by the authors in a
previous work [30]. However, as will be explained in the next
section, these deviations do not have a negative effect on our
proposed binaural synthesis method, since they contribute to
the perception of the diffuseness properties of sound.
4. Synthesis Stage
As said in Section 1, HRTFs provide accurate localization
cues because they encode all the necessary information
regarding how the arriving sound is filtered by the diffraction
and reflection properties of the head, pinna, and torso, before
it reaches the eardrum and inner ear. Using this information,
synthesizing a binaural sound signal for headphone repro-
duction is straightforward. The HRTF for each ear must be
used to filter an input signal, ensuring that the outputs are
correctly reproduced over their corresponding headphone
channel. This is usually done for each separate source signal
with the aim of positioning an auditory object in the direc-
tion from which the HRTFs have been measured. However,
in our proposed approach, the synthesis stage differs signifi-
cantly from this conventional processing due to the fact that
no separate source signals are available. Again, taking into
account source sparseness in the time-frequency domain, we
will be able to reproduce the original spatial characteristics of
the recorded sound scene using the directional information
extracted from the previous analysis stage.
6 EURASIP Journal on Advances in Signal Processing
z
y
x
S
1
S
2
S
3
S
4
(a)
XY projection
1.510.50
−0.5−1−1.5
1.5
1
0.5
0
−0.5
−1
−1.5
(b)
ZY projection
1.510.50
−0.5−1−1.5
1.5
1
0.5
0
−0.5
−1
−1.5
(c)
Figure 3: DOA analysis of a mixture of 4 speech sources. (a) Source locations in the 3D space. (b) Distribution of DOA estimates in the XY
plane. (c) Distribution of DOA estimates in the ZY plane.
4.1. Time-Frequency Selective HRTF Filtering. Consider a set
of measured [31, 32] or simulated HRTFs [33]. It is widely
known that the use of nonindividualized HRTFs for binaural
reproduction has some problems, mainly
(i) sound objects are frequently localized inside the head,
(ii) frontal sounds often appear behind the listener and
vice versa,
(iii) the perceived directions of the synthesized sources do
not match the intended spatial positions.
These classical problems associated to binaural reproduc-
tion have already been extensively studied [34]andwewill
not address them in this paper.
Assuming far field conditions, the HRTF is a function
of the arrival direction of the source (θ
n
, φ
n
) and the
frequency f
k
, expressed as HRTF(θ
n
, φ
n
, k). Moreover, there
is also a different HRTF for the right and left ears, having
HRTF
L
(θ
n
, φ
n
, k)andHRTF
R
(θ
n
, φ
n
, k).
The synthesis strategy is simple. Any of the omnidirec-
tional signals of the array X
m
(k, r) is filtered accordingly to
the estimated DOA angles
θ
n
and
φ
n
as follows:
Y
L
(
k, r
)
= X
m
(
k, r
)
HRTF
L
θ
n
,
φ
n
, k
,
Y
R
(
k, r
)
= X
m
(
k, r
)
HRTF
R
θ
n
,
φ
n
, k
,
(16)
where Y
L
(k, r)andY
R
(k, r) are the STFT of the output signals
corresponding to the left and right ears, respectively. These
signals are transformed back to the time domain using the
inverse STFT operator following an overlap-add scheme.
Using the above approach, the microphone signal
X
m
(k, r) provides a pressure signal for the synthesis of the
binaural signal. The required spatial localization cues are
then given by the HRTF coefficients, which are carefully
selected based on the estimated directional data. Note that
we only use a single omnidirectional signal for the calculation
of the output, since combinations of the microphone signals
Table 1: Mean square error for synthesized signals in anechoic
scenario.
Number of sources N Mean square error
1 0.003
2 0.073
3 0.243
4 0.382
could result in coloration due to spatial filtering effects. In
our implementation, we chose the signal of microphone 4
for being slightly above from the array center.
4.2. Selective Filtering and Sparsity. Further considerations
are needed regarding the above synthesis approach. Note that
each time-frequency bin is independently filtered according
to its DOA information. As well as in the analysis stage,
source sparsity and disjointness form the basis of our
synthesis method. Under approximate WDO conditions,
only one source has a major contribution on a given
time-frequency element. Therefore, it is only necessary to
filter each bin according to the direction of the dominant
contribution since the energy corresponding to the rest of
the sources can be neglected with little error. Obviously, if
the number of sources is increased, the error will be higher.
To illustrate this idea, Figure 4 shows the waveforms of
the left and right ear signals in an anechoic scenario for an
increasing number of sources. The real signals obtained by
conventional HRTF synthesis are shown on the left side and
the ones synthesized by means of time-frequency selective
filtering are on the right side. To evaluate quantitatively the
synthesized signals, their mean square errors are provided
in Ta b le 1 . As expected, the error of the synthesized signal
depends on the number of sources. However, as will be
shown in the next section, these errors do not severely affect
the subjective quality of the synthesized signals.
EURASIP Journal on Advances in Signal Processing 7
Right
Left
Real-1 source
1050
Time (s)
−1
1
−1
1
Right
Left
Synthetic-1 source
1050
Time (s)
−1
1
−1
1
(a)
Right
Left
Real-2 sources
1050
Time (s)
−1
1
−1
1
Right
Left
Synthetic-2 sources
1050
Time (s)
−1
1
−1
1
(b)
Right
Left
Real-3 sources
1050
Time (s)
−1
1
−1
1
Right
Left
Synthetic-3 sources
1050
Time (s)
−1
1
−1
1
(c)
Figure 4: Waveforms of real and sparsity-based synthesized binaural signals for different number of sources. (a) One source. (b) Two sources.
(c) Three sources.
Besides the number of sources, the environment and the
type of signals also play a major role in our synthesis method.
As explained in Section 3.2, speech and music have different
sparsity properties and room reflections spread the energy
of the sources both in time and frequency. However this is
not a serious problem. Time-frequency points dominated by
reverberation will be inherently reproduced from multiple
directions, just as suggested by the analysis stage. This way,
the higher the variance found in the estimated directions,
the higher the sense of envelopment will be perceived.
In contrast, a dry room that produces very peaky DOA
distributions will result in a synthesized binaural signal
where the sources can be clearly perceived from their
actual directions. A problem associated with a high degree
of reverberation is that artifacts may appear due to the
prominent discontinuities in the directional data. These
effects can be effectively reduced by smoothing the filtering
coefficients along the frequency axis.
4.3. HRTF Spatial Resolution. Traditionally, a practical prob-
lem associated with HRTFs is the difficulty to measure
responses for every possible angle with infinite spatial
resolution. Although some approaches have been recently
proposed to solve this classical problem [35], most available
HRTF databases have been measured with some practical
resolution. In order to use HRTFs corresponding to the
acquired directional information, several approaches can be
followed.
8 EURASIP Journal on Advances in Signal Processing
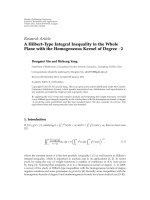
y
x
Source 3
(θ
3
, φ
3
) = (120, −10)
Source 4
(θ
4
, φ
4
) = (180, 0)
Source 2
(θ
2
, φ
2
) = (60, 10)
Source 1
(θ
1
, φ
1
) = (0, 0)
Simulated human head
or tetrahedral array
2m
6.25 m
3.75 m
Figure 5: Simulation setup used to obtain the signals used in the subjective evaluation.
(1) Use directly the HRTF of the available data bank that
is closest to the estimated direction. This would be
the simplest approach.
(2) Interpolate the available HRTFs to get more accu-
rate filters. This can be done using sophisticated
interpolation techniques [36–38]. However, a simple
linear interpolation in the time domain using the
closest HRIRs has shown to be a very convincing and
efficient solution [39, 40].
(3) Use a parametric HRTF model [33, 41]. This option
provides directly the filtering information needed for
any direction.
Depending on the requirements of a given application,
adifferent strategy can be selected. While the interpolation
strategy is very useful for achieving accurate localization, the
other two methods are computationally more efficient. In the
next section we comment on some useful aspects regarding
the real-time implementation of the method.
5. Evaluation Using Synthetic Mixtures
To evaluate subjectively the quality and spatial impression
provided by the proposed technique, a set of simulations
considering different acoustic situations were carried out.
The evaluation conducted this way is useful to assess the
performance of the method under different acoustic environ-
ments with control on specific aspects of the acoustic setup.
In the experiments, a set of sound sources were simulated
inside a shoe-box-shaped room (6.25
× 3.75 × 2.5m),
acquiring all the required impulse responses by means of the
Roomsim [42] simulation package for Matlab. This software
simulates the acoustics of a rectangular room by means of
the image method [43] and, moreover, it allows to generate
binaural room impulse responses (BRIRs) corresponding to
a selected HRTF data set.
The simulation setup is depicted in Figure 5. Four source
positions, were considered in the experiments at a radius
2 m for the array base center (origin of coordinates): (θ
1
=
0
◦
, φ
1
= 0
◦
), (θ
2
= 60
◦
, φ
2
= 10
◦
), (θ
3
= 120
◦
, φ
3
=−10
◦
),
and (θ
4
= 180
◦
, φ
4
= 0
◦
). The signals at the microphones
were obtained by convolving the simulated responses with
the corresponding dry source signals and adding all of
them together. To simulate our tetrahedral array, we used
an intermicrophone distance of d
= 1.5cm and assumed
perfect omnidirectional responses for all sensors. On the
other hand, the KEMAR mannequin [44] was selected to
generate reference source signals for the subjective tests.
Different types of signals were considered to take into
account different sparsity properties.
(i) A set of 2 male and 2 female speech sources
extracted from the public data provided in The 2008
Signal Separation Evaluation Campaign [45]. They
are sampled at 16 kHz, 16 bits, and have a duration
of 10 s.
(ii) A multitrack folk music recording consisting of
four instruments: accordion, sax, guitar, and violin.
Although originally sampled at 44.1 kHz, they were
resampled to have the same sampling frequency
(16 kHz) as the above speech mixtures.
The STFT was computed using Hann windows of 1024
samples of length, with a hop size of 512 samples (50%
overlap). These parameters have been shown to be optimum
for sparsity-based speech processing [27]. However, music
would benefit from longer time windows.
A set of 7 listeners took part on an informal listening
test with the aim of evaluating the similarities between the
scenes rendered by means of the simulated KEMAR and
those obtained by means of the proposed approach. The
assessed sound scenes were mixtures of one, two, three,
and four sources. There were three versions of each scene.
Each version was obtained using different room surface
EURASIP Journal on Advances in Signal Processing 9
characteristics, thus, having different reverberation times:
T
60
= 0 s (anechoic), T
60
= 0.1 s (slightly reverberant),
and T
60
= 0.9 (very reverberant). As a result, there were
2 versions (KEMAR-simulation and proposed) of a total
of 24 different sound scenes (12 for speech and 12 for
music).
Two different aspects were considered in the evaluation:
sound quality and spatial impression. A 4-point grade
scale was used to compare the scenes rendered using the
tetrahedral array with the reference KEMAR simulated
scenes, ranging from
−3 to 0 in the following intensity scale:
(i) 0: Equal,
(ii)
−1: Slightly Worse,
(iii)
−2: Moderately Worse,
(iv)
−3: Substantially Worse.
5.1. Results. Figures 6(a) and 6(b) show the results of the
tests for sound quality and spatial impression, respectively.
Black dots denote the mean values and thin bars rep-
resent 95% confidence intervals. Regarding sound quality
(Figure 6(a)), it can be observed that in anechoic conditions
(T
60
= 0), there are no significant differences between both
binaural reproduction methods. However, as the reverbera-
tion degree gets higher, the performance of the method is
slightly degraded. This worsening may be due to some metal-
lic sound reported by some listeners. There are also clear
differences between speech and music, music being consid-
erably more problematic than speech, specially when the
number of sound sources is higher. This is a consequence of
harmonic overlapping, which affects substantially the WDO
assumption. Regarding spatial impression (Figure 6(b)), the
decreasing tendency with reverberation is again observed,
but the number of sound sources and the type of source
signals seem to be less significant.
From the above results, it becomes clear that both
source overlapping and reverberation affect negatively the
performance of the proposed approach. Obviously, this
degradation is due to the fact that some of the assump-
tions taken for the development of the algorithm are not
completely met, specially those based on source sparsity
and disjointness. A detailed analysis of the artifacts caused
by different types of errors in the analysis and synthesis
stages could be useful to improve the performance of
the method when working in difficult acoustic environ-
ments. Although this analysis is out of the scope of this
paper, the authors plan to address this issue in future
works.
6. Evaluation with Real Mixtures
6.1. Real-Time Implementation. In the last section, a set
of experiments using simulations of reverberant rooms
were presented. Besides considering these simulations, the
applicability of the proposed method can be substantially
enhanced by providing some notes on the real-time imple-
mentation of a working prototype. Two objectives are
pursued with this implementation. First, to demonstrate
that the computational cost of this technique is reduced
enough to be implemented in a practical embedded system.
Second, having a real-time system allowed us to plan future
interactive experiments where conditions related to scene
changes can be experienced as they occur.
For our real-time prototype we used a PC running
Microsoft Windows XP as a base. To construct the micro-
phone array prototype with d
= 1.5 cm, four instrumenta-
tion quality microphones from Br
¨
uel & Kjaer model 4958
were used. These microphones have excellent phase matching
in the audio band. The signal acquiring system consisted
of a digital audio interface with four microphone inputs
(M-Audio Fast Track Ultra USB 2.0) and ASIO drivers.
The Intel Integrated Performance Primitives (Intel IPP) [46]
library was used for FFT computation and vector operations.
In the analysis stage, phase differences are calculated from
the FFT coefficients of each input data frame at each
channel. The [x, y, z] components of the DOA vector are
then calculated using (13), taking into account that the
corresponding frequencies f
k
have to be previously stored.
Moreover, the processing parameters were set the same as in
Section 5.
Since the experiments reported in the following sub-
section were conducted using a Br
¨
uel & Kjaer 4128 Head
And Torso Simulator (HATS), the HRTF database used
for the synthesis was specifically measured by the authors
to allow for an objective comparison. The HRTFs were
measured using the logarithmic sweep method [47]with
sampling frequency 44.1 kHz. Moreover, the measuring
system was carefully compensated. HRTFs were sampled
both in azimuth and elevation. The dummy-head was placed
in a rotating table, measuring responses from
−180
◦
to 180
◦
every 5 degrees. On the other hand, elevations were measured
from
−40
◦
to 90
◦
every 10 degrees. For every measure,
the same loudspeaker distance to the center was employed
(1 m).
6.2. Evaluation and Discussion. Experiments similar to those
presented in Section 5 were carried out using the constructed
prototype. Different combinations of sound sources were
simultaneously recorded using the tetrahedral microphone
array and the HATS, placing the microphone array on top
(Figure 7). The sources were reproduced in the horizontal
plane over different loudspeakers of our Wave-Field Synthe-
sis array, with azimuth angles of 0, 60, 120, and 180 degrees.
The room has an approximate reverberation time of T
60
=
0.2 s. For comparison purposes, the same speech and music
signals used in the simulations were selected. The reference
signals for the listening test are the simultaneously recorded
signals from the artificial head. The same group of subjects
took part in the evaluation.
The results of this experiment are shown in Figure 8.As
expected, there are many similarities with those in Figure 6
for slight reverberation. Again, results both in sound quality
and spatial impression are worse for music signals than
for speech signals, specially when the number of sources is
high. Moreover, the results confirm that sound quality is
more critical than spatial impression, however, the overall
score suggests that the perceived quality obtained with the
10 EURASIP Journal on Advances in Signal Processing
Speech
AverageN
= 4N = 3N = 2N = 1Sources
0
−1
−2
−3
Equal
Slightly worse
Moderately worse
Substantially worse
Music
AverageN
= 4N = 3N = 2N = 1Sources
0
−1
−2
−3
Equal
Slightly worse
Moderately worse
Substantially worse
T
60
= 0s
T
60
= 0.1 s
T
60
= 0.9 s
(a)
Speech
AverageN
= 4N = 3N = 2N = 1Sources
0
−1
−2
−3
Equal
Slightly worse
Moderately worse
Substantially worse
Music
AverageN
= 4N = 3N = 2N = 1Sources
0
−1
−2
−3
Equal
Slightly worse
Moderately worse
Substantially worse
T
60
= 0s
T
60
= 0.1 s
T
60
= 0.9 s
(b)
Figure 6: Results of the subjective tests using synthetic mixtures. Black dots denote the mean values and thin bars represent 95% confidence
intervals. (a) Sound quality evaluation. (b) Spatial impression evaluation.
Figure 7: Tetrahedral array and acoustic dummy-head used in the experiments.
proposed synthesis method is only slightly degraded from the
obtained using the acoustic dummy-head.
7. Conclusion
In this paper, we have presented a two-step binaural sound
synthesis method based on sparse signal processing and
time-frequency analysis. In the first stage, the assumption
of sound sources that rarely overlap in the time-frequency
domain has been considered to study the spatial properties
of the sound that impinges a small tetrahedral microphone
array. The phase difference information of several micro-
phone pairs is combined to obtain a 3D DOA estimate
in each time-frequency slot. In the synthesis stage, one of
EURASIP Journal on Advances in Signal Processing 11
Speech
AverageN
= 4N = 3N = 2N = 1Sources
0
−1
−2
−3
Equal
Slightly worse
Moderately worse
Substantially worse
Music
AverageN
= 4N = 3N = 2N = 1Sources
0
−1
−2
−3
Equal
Slightly worse
Moderately worse
Substantially worse
(a)
Speech
AverageN
= 4N = 3N = 2N = 1Sources
0
−1
−2
−3
Equal
Slightly worse
Moderately worse
Substantially worse
Music
AverageN
= 4N = 3N = 2N = 1Sources
0
−1
−2
−3
Equal
Slightly worse
Moderately worse
Substantially worse
(b)
Figure 8: Results of the subjective tests using real recorded mixtures. Black dots denote the mean values and thin bars represent 95%
confidence intervals. (a) Sound quality evaluation. (b) Spatial impression evaluation.
the microphone signals is selectively filtered in the time-
frequency domain with the left and right HRTFs that
correspond to the estimated DOAs.
Experiments using both synthetic and real mixtures of
speech and music were conducted using different number of
sources. Although the performance of the method is slightly
degraded with the number of sources and reverberation,
the perceived sound quality and spatial impression are
considerably similar to conventional binaural reproduction.
However, artifacts due to spectral overlapping makes this
method more suitable for speech applications than for
music.
The proposed spatial sound capturing method not only
eliminates the need for an acoustic mannequin, which has
a considerable volume and uncomfortable portability, but
also allows to change easily the head response by using a
different HRTF database in requirement of the application,
needs, or user preferences. Moreover, it allows to rotate
the head position in real time. Thus, a tracking system
can be used to follow the position of the subject in the
synthesis stage, providing the listener with a more immersive
sensation.
Acknowledgment
The Spanish Ministry of Science and Innovation supported
this work under the Project TEC2009-14414-C03-01.
References
[1] J. Blauert, Spatial Hearing, MIT Press, Cambridge, UK, 1997.
[2] F. Rumsey, Spatial Audio, Focal Press, 2001.
[3] C. I. Cheng and G. H. Wakefield, “Introduction to head-
related transfer functions (HRTF’s): representations of HRTF’s
in time, frequency, and space,” in Proceedings of the 107th
Convention of the Audio Engineering Society (AES ’99),New
York, NY, USA, 1999.
[4] P. S. Chanda, S. Park, and T. I. Kang, “A binaural synthesis
with multiple sound sources based on spatial features of head-
related transfer functions,” in Proceedings of the International
JointConferenceonNeuralNetworks, pp. 1726–1730, Vacouver,
Canada, July 2006.
[5] P. G. Georgiou and C. Kyriakakis, “A multiple input single
output model for rendering virtual sound sources in real
time,” in Proceedings of the IEEE Internat inal Conference on
Multimedia and Expo (ICME ’00), vol. 1, pp. 253–256, New
York, NY, USA, July 2000.
[6] J. Breebaart, F. Nater, and A. Kohlrausch, “Parametric bin-
aural synthesis: background, applications and standards,” in
Proceedings of the NAG-DAGA, pp. 172–175, Rotterdam, The
Netherlands, 2009.
[7] J. Breebaart and C. Faller, Spatial Audio Processing: MPEG
Surround and Other Applications, Wiley, Chichester, UK,
2007.
[8] J. Breebaart, L. Villemoes, and K. Kj
¨
orling, “Binaural ren-
dering in MPEG surround,” EUR A SIP Journal on Advances
in Signal Processing, vol. 2008, Article ID 732895, 14 pages,
2008.
[9] V. Pulkki, “Spatial sound reproduction with directional audio
coding,” Journal of the Audio Engineering Society, vol. 55, no. 6,
pp. 503–516, 2007.
[10] G. Del Galdo and F. Kuech, “Nested microphone array
processing for parameter estimation in directional audio
coding,” in Proceedings of the IEEE Workshop on Applications of
Signal Processing to Audio and Acoustics (WASPAA ’09),New
Paltz, NY, USA, October 2009.
12 EURASIP Journal on Advances in Signal Processing
[11] V. Pulkki, “Directional audio coding in spatial sound repro-
duction and stereo upmixing,” in Proceedings of the AES 28th
International Conference, Pitea, Sweden, July 2006.
[12] M. Laitinen and V. Pulkki, “Binaural reproduction for direc-
tional audio coding,” in Proceedings of the IEEE Workshop
on Applications of Signal Processing to Audio and Acoustics
(WASPAA ’09), pp. 337–340, New Paltz, NY, USA, October
2009.
[13] O. Thiergart, G. Del Galdo, M. Taseska, J. Pineda, and F.
Kuech, “In situ microphone array calibration for parameter
estimation in directional audio coding,” in Proceedings of the
AES 128th Convention, London, UK, May 2010.
[14] V. Pulkki, “Spatial sound generation and perception by ampli-
tude panning techniques,” Tech. Rep., Helsinki University of
Technology, Helsinki, Finland, 2001.
[15] M. Laitinen, Binaural reproduction for direct ional audio coding,
M.S. thesis, Helsinki University of Technology, Helsinki,
Finland, 2008.
[16] J. Ahonen, V. Pulkki, and T. Lokki, “Teleconference application
and B-format microphone array for directional audio coding,”
in Proceedings of the AES 30th International Conference,
Saariselk
¨
a, Finland, March 2007.
[17]R.Schultz-Amling,F.Kuech,M.Kallinger,G.DelGaldo,J.
Ahonen, and V. Pulkki, “Planar microphone array processing
for the analysis and reproduction of spatial audio using
directional audio coding,” in Proceedings of the AES 124th
Convention, Amsterdam, The Netherlands, May 2008.
[18] J. Merimaa, “Applications of a 3-d microphone array,” in
Proceedings of the AES 112th Convention, Munich, Germany,
May 2002.
[19] L. Cohen, Time-Frequency Analysis, Prentice-Hall, 1995.
[20] J. J. Burred and T. Sikora, “On the use of auditory rep-
resentations for sparsity-based sound source separation,” in
Proceedings of the 5th International Conference on Information,
Communications and Signal Processing (ICICS ’05), pp. 1466–
1470, Bangkok, Thailand, December 2005.
[21] S. Araki, H. Sawada, R. Mukai, and S. Makino, “Perfor-
mance evaluation of sparse source separation and DOA
estimation with observation vector clustering in reverberant
environments,” in Proceedings of the International Workshop on
Acoustic Echo and Noise Control(IWAENC ’06), Paris, France,
2006.
[22] S. Rickard and F. Dietrich, “DOA estimation of many w-
disjoint orthogonal sources from two mixtures using DUET,”
in Proceedings of the 10th IEEE Workshop on Statistical Signal
and Array Processing (SSAP ’00), pp. 311–314, Pocono Manor,
Pa, USA, August 2000.
[23]
¨
O. Yilmaz and S. Rickard, “Blind separation of speech
mixtures via time-frequency masking,” IEEE Transactions on
Signal Processing, vol. 52, no. 7, pp. 1830–1847, 2004.
[24] P. Bofill and M. Zibulevsky, “Underdetermined blind source
separation using sparse representations,” Signal Processing, vol.
81, no. 11, pp. 2353–2362, 2001.
[25] S. Rickard and O. Yilmaz, “On the w-disjoint orthogonality of
speech,” in Proceedings of the IEEE International Conference on
Acoustics, Speech, and Signal Processing, pp. 529–532, Orlando,
Fla, USA, May 2002.
[26] A. Jourjine, S. Richard, and O. Yilmaz, “Blind separation
of disjoint orthogonal signals: demixing n sources from 2
mixtures,” in Proceedings of the IEEE International Conference
on Acoustics, Speech and Signal Processing (ICASSP ’00), vol. 5,
pp. 2985–2988, Istanbul, Turkey, 2000.
[27] J. J. Burred, From sparse models to timbre learning: new methods
for musical source separation, Ph.D. thesis, Technical University
of Berlin, 2008.
[28] S. Schulz and T. Herfet, “On the window-disjoint-ortho-
gonality of speech sources in reverberant humanoid scenar-
ios,” in Proceedings of the 11th Internat ional Conference on
Dig ital Audio E ffects (DAFx ’08), Espoo, Finland, September
2008.
[29] M. Cobos and J. J. Lopez, “Two-microphone separation of
speech mixtures based on interclass variance maximization,”
Journal of the Acoustical Society of America, vol. 127, no. 3, pp.
1661–1672, 2010.
[30] M. Cobos, J. J. Lopez, and S. Spors, “Effects of room
reverberation in source localization using small microphone
arrays,” in Proceedings of the 4th International Symposium on
Communications, Control and Signal Processing (ISCCSP ’10),
Limassol, Cyprus, March 2010.
[31] V. R. Algazi, R. O. Duda, D. M. Thompson, and C. Avendano,
“The CIPIC HRTF database,” in Proceedings of the IEEE
Workshop on Applications of Signal Processing to Audio and
Acoustics, pp. 99–102, New Paltz, NY, USA, October 2001.
[32] IRCAM, “LISTEN HRTF database,” 2003, http://recherche
ircam.fr/equipes/salles/listen/.
[33] C. P. Brown and R. O. Duda, “An efficient HRTF model for 3-
D sound,” in Proceedings of the IEEE Workshop on Applications
of Signal Processing to Audio and Acoustics (ASSP ’97), 1997.
[34] H. Møller, M. F. Sørensen, C. B. Jensen, and D. Hammershøi,
“Binaural technique: do we need individual recordings?”
Journal of the Audio Engineering Society, vol. 44, no. 6, pp. 451–
468, 1996.
[35] G. Enzner, “3-d-continuous-azimuth acquisition of head-
related impulse responses using multi-channel adaptive filter-
ing,” in Proceedings of the IEEE Workshop on Applications of
Signal Processing to Audio and Acoustics (WASPAA ’09),pp.
325–328, New Paltz, NY, USA, October 2009.
[36] F. Keyrouz and K. Diepold, “Efficient state-space rational
interpolation of HRTFs,” in Proceedings of the AES 28th
International Conference, Pitea, Sweden, 2006.
[37] F. Freeland, L. Biscainho, and P. Diniz, “Efficient HRTF
interpolation in 3D moving sound,” in Proceedings of the
AES 22nd International Conference on Virtual, Synthetic and
Entertainment Audio, Espoo, Finland, June 2002.
[38] F. Keyrouz and K. Diepold, “A new HRTF interpolation
approach for fast synthesis of dynamic environmental inter-
action,” Journal of the Audio Engineering Society, vol. 56, no.
1-2, pp. 28–35, 2008.
[39] J. Sodnik, R. Su
ˇ
snik, M.
ˇ
Stular, and S. Toma
ˇ
zi
ˇ
c, “Spatial sound
resolution of an interpolated HRIR library,” Applied Acoustics,
vol. 66, no. 11, pp. 1219–1234, 2005.
[40] T. Nishino, S. Mase, S. Kajita, K. Takeda, and F. Itakura,
“Interpolating HRTF for auditory virtual reality,” Journal of
the AcousticalSociety of America, vol. 100, no. 4, pp. 2602–2602,
1996.
[41] V. Algazi, R. Duda, and D. M. Thomson, “The use of head-
and-torso models for improved spatial sound synthesis,” in
Proceedings of the AES 113th Convention, Los Angeles, Calif,
USA, October 2002.
[42] D. R. Campbell, “Roomsim: a MATLAB simulation shoebox
room acoustics,” 2007, />∼campbell/
Roomsim/.
[43] J. B. Allen and D. A. Berkley, “Image method for efficiently
simulating small-room acoustics,” Journal of the Acoustical
Society ofAmerica, vol. 65, no. 4, pp. 943–950, 1979.
EURASIP Journal on Advances in Signal Processing 13
[44] B. Gardner and K. Martin, “HRTF measurements of a KEMAR
dummy-head microphone,” MIT Media Lab, May 1994,
/>∼kdm/hrtfdoc/hrtfdoc.html.
[45] E. Vincent, S. Araki, and P. Bofill, “The 2008 signal separation
evaluation campaign: a community-based approach to large-
scale evaluation,” in Independent Component Analysis and
Signal Separation, vol. 5441 of Lecture Notes in Computer
Science, pp. 734–741, 2009.
[46] S. Taylor, Intel Integrated Performance Primitives, Intel Press,
2004.
[47] S. M
¨
uller and P. Massarani, “Transfer-function measurement
with sweeps,” Journal of the Audio Engineering Society, vol. 49,
no. 6, pp. 443–471, 2001.