Báo cáo hóa học: " Research Article An Alternative Method to Compute the Bit Error Probability of Modulation Schemes Subject to Nakagami-m Fading" pdf
Bạn đang xem bản rút gọn của tài liệu. Xem và tải ngay bản đầy đủ của tài liệu tại đây (811.13 KB, 12 trang )
Hindawi Publishing Corporation
EURASIP Journal on Advances in Signal Processing
Volume 2010, Article ID 574109, 12 pages
doi:10.1155/2010/574109
Research Article
An Alternative Method to Compute the Bit Error Probability of
Modulation Schemes Subject to Nakagami-m Fading
Wamberto J. L. Queiroz,
1
Waslon T. A. Lopes,
1
Francisco Madeiro,
2
and Marcelo S. Alencar
1
1
Departamento de Engenharia El
´
etrica, Universidade Federal de Campina Grande, 58.429-900, Campina Grande, PB, Brazil
2
Escola Polit
´
ecnica de Pernambuco, Universidade de Pernambuco, 50.750-470, Recife, PE, Brazil
Correspondence should be addressed to Marcelo S. Alencar,
Received 4 March 2010; Revised 23 June 2010; Accepted 24 September 2010
Academic Editor: Athanasios Rontogiannis
Copyright © 2010 Wamberto J. L. Queiroz et al. This is an open access article distributed under the Creative Commons Attribution
License, which permits unrestricted use, distribution, and reproduction in any medium, provided the original work is properly
cited.
This paper presents an alternative method for determining exact expressions for the bit error probability (BEP) of modulation
schemes subject to Nakagami-m fading. In this method, the Nakagami-m fading channel is seen as an additive noise channel whose
noise is modeled as the ratio between Gaussian and Nakagami-m random variables. The method consists of using the cumulative
density function of the resulting noise to obtain closed-form expressions for the BEP of modulation schemes subject to Nakagami-
m fading. In particular, the proposed method is used to obtain closed-form expressions for the BEP of M-ary quadrature amplitude
modulation (M-QAM), M-ary pulse amplitude modulation (M-PAM), and rectangular quadrature amplitude modulation (I
×J-
QAM) under Nakagami-m fading. The main contribution of this paper is to show that this alternative method can be used to
reduce the computational complexity for detecting signals in the presence of fading.
1. Introduction
The growing need for improvement in capacity and perfor-
mance of wireless communication systems has demanded
high data transmission rates, in a scenario suitable to
accommodate the ever-increasing multimedia trafficand
new applications. In this context, spectrally efficient modula-
tion schemes have attracted the attention of companies and
academia. Quadrature amplitude modulation (QAM) is an
attractive modulation scheme to achieve high transmission
rates, without increasing the bandwidth of the wireless
communication system.
Traditionally, the computation of the BEP of M-QAM
has been carried out by calculating the symbol error
probability or simply estimating it using lower or upper
bounds [1]. Good approximations for the BEP of M-QAM
subject to additive white Gaussian noise (AWGN) have been
presented in [2, 3] based on signal-space concepts and
recursive algorithms. It is worth mentioning that although
some approximate expressions give accurate error rates for
high signal-to-noise ratio (SNR), the evaluation of the error
rates using those expressions tends to deviate from their
corresponding exact values when the SNR is low.
In spite of the attention devoted to the study of the BEP
of QAM for an AWGN channel, a closed-form expression for
the BEP of M-QAM for an AWGN channel has been derived
only in 2002 [4].
Regarding the performance evaluation of QAM for a
Rayleigh fading channel, the BEP has been addressed pre-
viously (e.g., [5–8]). In [5], the analytically derived BEP
formula for 16-QAM and 64-QAM involves the computation
of a definite integral (whose integrand is the product of the
well-known Q-function and an exponential function) and
yields results that match the curves obtained from simu-
lation. Based on [9], Vitthaladevuni and Alouini obtained
generic expressions for the BEP of hierarchical constellations
4/M-QAM [7].
In [10], Craig’s method [11] for numerically computing
the average error probability of two-dimensional M-ary
signaling in AWGN is extended to give results to determine
the average probability of symbol errors in slow Rayleigh
fading. Dong et al. have determined in [10] the exact average
2 EURASIP Journal on Advances in Signal Processing
symbol error probability for the 16-Star QAM subject to
fading.
Concerning the performance evaluation of communica-
tion systems for Nakagami fading channels, the bit error rate
performance of multiple-input multiple-output (MIMO)
systems employing transmit diversity through orthogonal
space time block coding (STBC) was addressed in [12].
Exact closed-form expressions were derived for the BEP of
Gray-coded Pulse Amplitude Modulation (PAM) and QAM
modulations when STBC was employed in the presence
of Nakagami-m fading. The analysis considered a single-
input single-output (SISO) channel approach, and the
mathematical expressions for the BEP were obtained for
integer values of the Nakagami fading parameter m.
The STBC coding was also considered in [13], where
the authors applied the SISO equivalency of STBC in order
to analyse its performance over nonselective Nakagami-m
fading channels in presence of spatial fading correlation.
In [14], the authors considered a more general frame-
work of Nakagami-m fading and derived an exact closed-
form expression for the Shannon capacity of STBC, setting
the limit on the achievable average spectral efficiency by any
adaptive modulation scheme employing STBC in Nakagami
fading.
In [15], the authors considered the fact that a signal
received from a fading channel is subject to a multiplicative
distortion (MD) and to the usual additive noise—then,
following a compensation of the MD, the signal fed to the
detector may include only a single additive distortion term,
which comprises the effects of the original additive noise,
the MD, and the error in MD compensation. In [15], the
probability density function of that single additive distortion
was derived and used to obtain the error probability of some
modulation schemes. A similar development was used in
[16]—in which the authors have shown that the Rayleigh
fading channel can be seen as an additive noise channel
whose noise is modeled as the ratio between a Gaussian
random variable (r.v.) and a Rayleigh r.v. The cumulative
density function (CDF) of that noise has been derived in
[17].
This paper extends the analysis of [16, 17]andpresents
a convenient method for obtaining the BEP for modulation
schemes subject to Nakagami-m fading. The methodology
presented in this paper is used to obtain exact and closed-
form expressions for the BEP of M-PAM, M-QAM, and I
×J-
QAM schemes subject to Nakagami-m fading. It is important
to mention that the closed-form BER expressions derived
do not represent a contribution of the paper, because they
are available in the literature and can be obtained using
other approaches, and are derived to illustrate the proposed
method.
The paper also shows how this approach can be used
to reduce the number of operations required for detecting
signals in the presence of fading. This can be seen as the
main contribution of this paper, since a lower computational
complexity leads to a more efficient power consumption and
a smaller processing time. Considering handsets of cellular
communication systems, low power consumption extends
the battery lifetime, and small processing time enhances
the performance for online applications such as video calling
and web browsing.
The remaining of the paper is organized as follows.
Section 2 presents the system model. Section 3 addresses the
derivation of the CDF of the additive noise. In Section 4,
the CDF is used to derive an exact expression for the
BEP of M-QAM subject to Nakagami-m fading. Section 5
is devoted to the derivation of an exact expression for the
BEP of an M-PAM subject to Nakagami-m fading, while
Section 6 deals with the derivation of an exact expression for
the BEP of the I
× J-QAM subject to Nakagami-m fading.
Section 7 presents simulation results and an analysis of the
computational complexity for detecting signals in presence
of fading. Concluding remarks are presented in Section 8.
2. The System Model
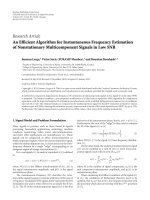
Consider the wireless system depicted in Figure 1,inwhich
the transmitter uses M-ary modulation.
Assuming a frequency-nonselective slow-fading channel,
the received signal r
c
(t) can be expressed as
r
c
(
t
)
= αe
−jφ
s
(
t
)
+ z
(
t
)
,0≤ t ≤ T,
(1)
in which s(t) represents the transmitted signal, α is the
fading amplitude, φ is the phase shift due to the channel,
z(t) denotes the additive white Gaussian noise, and T is the
signaling interval.
The fading amplitude α is modeled as a Nakagami-m r.v.,
whose probability density function (pdf) is expressed as
p
(
α
)
=
2m
m
α
2m−1
Γ
(
m
)
Ω
m
e
−mα
2
/Ω
u
(
α
)
,
(2)
in which u(
·) is the unit step function, Γ(·)denotesde
Gamma function, Ω is the average power of the transmitted
signal envelope, and m
≥ 1/2 is a parameter that controls
the intensity of the fading. Large values of m represent mild
fading whereas small values correspond to severe fading. The
special case of m
= 1 reduces the Nakagami-m fading to
Rayleigh fading.
The additive noise z(t) is modeled as a two-dimensional
Gaussian r.v. with zero mean and variance N
0
/2 per dimen-
sion. Without loss of generality, a normalized fading power
is considered; that is, E[α
2
] = 1, in which E[ · ] is the
expectation operator.
Assuming that the fading is sufficiently slow so that
the phase shift φ can be estimated from the received
signal without error, the receiver can perform the phase
compensation (multiplication of r
c
(t)bye
jφ
). Then, the
resulting received signal r(t) can be expressed as
r
(
t
)
= r
c
(
t
)
· e
jφ
= αs
(
t
)
+ z
(
t
)
· e
jφ
= αs
(
t
)
+ n
(
t
)
.
(3)
It is important to note that n(t)
= z(t) · e
jφ
is also a two-
dimensional Gaussian r.v. having zero mean and variance
N
0
/2 per dimension. This follows from the fact that the error
probability is unaffected by a rotation, since the pdf of the
white Gaussian noise, p
N
(n), is spherically symmetric [18,
page 247].
EURASIP Journal on Advances in Signal Processing 3
Input
bits
Tr an sm i tte r
Modulator
Channel
Phase
compensation
Receiver
Demodulator
Detector
Output
bits
s(t) r
c
(t)
αe
−jφ
z(t)
Figure 1: The system model.
The maximum a posteriori criterion [1] establishes that
the optimum detector, on observing r(t), sets
s(t) = s
k
(t)as
the received symbol whenever the decision function
P
(
s
i
(
t
))
p
r
(
r
(
t
)
| s
(
t
)
= s
i
(
t
))
, i
= 0, 1, , M − 1
(4)
is maximum for i
= k,inwhichp
r
(r(t) | s(t) = s
i
(t)) is
the conditional pdf of the observed signal r(t)givens(t)and
P(s
i
(t)) is the a priori probability of the ith transmitted signal
s
i
(t).
Based on the maximum a posteriori criterion and
considering equiprobable constellation symbols, two dif-
ferent strategies can be used for determining the most
probable transmitted symbol from the noisy observation
r(t). According to these strategies, two detectors can be
defined:
(i) detector I (DI): compare r(t) with all the constel-
lation symbols (multiplied by α) and choose as the
received symbol the closest one to r(t), that is, the one
that minimizes the metric
|r(t) − αs
i
(t)|;
(ii) detector II (DII): compare r(t)/α with all the constel-
lation symbols and choose as the received symbol the
closest one to r(t)/α that is, choose as the received
symbol the one that minimizes the metric
|r(t)/α −
s
i
(t)|.
For detector DII, after providing fading compensation
(division of r(t)byα), the channel can be seen as an additive
noise channel because
s
(
t
)
= arg min
s
i
(t)
αs
(
t
)
+ n
(
t
)
α
− s
i
(
t
)
=
arg min
s
i
(t)
|s
(
t
)
+ l
(
t
)
− s
i
(
t
)
|,
(5)
in which l(t)
= n(t)/α denotes the new additive noise
obtained from the ratio between a Gaussian r.v. N and a
Nakagami-m r.v. α. This new additive noise is modeled by
the r.v. L
= N/α, obtained from the random variables N and
α, whose CDF is presented in the next section.
3. Cumulative Density Function of L = N/α
The random variable N with zero mean and variance N
0
/2
that models the white Gaussian noise has a pdf given by
p
N
(
n
)
=
1
πN
0
e
−n
2
/N
0
,
(6)
while the pdf of the random variable α, which has Nakagami-
m distribution, is given by (2).
According to [19], the probability density function of a
random variable L defined as the ratio between two random
variables, L
= N/α,isgivenby
p
L
(
l
)
=
∞
−∞
|α|p
(
lα, α
)
dα.
(7)
Since the variables N and α are independent, the joint pdf
p(n, α)canbewrittenas
p
(
n, α
)
= p
N
(
n
)
p
α
(
α
)
=
2m
m
α
2m−1
Γ
(
m
)
Ω
m
e
−mα
2
/Ω
e
−n
2
/N
0
πN
0
u
(
α
)
,
(8)
and the joint pdf p(lα, α) can be obtained by substituting n
=
lα into (8).
Therefore, the marginal pdf p
L
(l) can be obtained using
(8)and(7) so that
p
L
(
l
)
=
∞
−∞
|α|2m
m
α
2m−1
Γ
(
m
)
Ω
m
e
−mα
2
/Ω
πN
0
e
−(l
2
α
2
)/N
0
u
(
α
)
dα
=
2
πN
0
m
m
Γ
(
m
)
1
Ω
m
∞
0
α
2m
e
−α
2
(m/Ω+l
2
/N
0
)
dα.
(9)
It is observed in (9) that the integral has the form
∞
0
x
2m
e
−ρx
2
dx,
(10)
and the corresponding result is obtained as follows:
∞
0
x
2m
e
−ρx
2
dx =
∞
0
x
2m
e
−(
√
ρx)
2
dx
=
∞
0
u
√
ρ
2m
e
−u
2
du
√
ρ
=
1
2ρ
(m+1/2)
Γ
m +
1
2
.
(11)
Thus,
∞
0
α
2m
e
−α
2
(m/Ω+l
2
/N
0
)
dα
=
1
2
Γ
m +
1
2
l
2
N
0
+
m
Ω
−(m+1/2)
.
(12)
Substituting the result from (9), it follows that the pdf
of the random variable L, that represents the new noise
4 EURASIP Journal on Advances in Signal Processing
(modeled as the ratio between two random variables), can
be written as [20]
p
L
(
l
)
=
m
m
√
πΩ
m
Γ
(
m +1/2
)
N
o
Γ
(
m
)
l
2
Ω + mN
o
N
o
Ω
−m−1/2
.
(13)
The cumulative density function (CDF) as a function of
l, P
L
(l), considering Ω = 1, is then obtained by calculating
the integral
P
L
(
l
)
=
l
−∞
p
L
(
x
)
dx
=
m
m
N
m
o
√
π
Γ
(
m +1/2
)
Γ
(
m
)
×
l
−∞
x
2
+ N
o
m
−(2m+1)/2
dx.
(14)
For noninteger values of m, the last improper integral in
(14) could be expressed as [21]
x
2
+a
−(2m+1)/2
dx=x ·
2
F
1
1
2
, m+
1
2
;
3
2
;
−
x
2
a
a
−(m+1/2)
,
(15)
in which
2
F
1
(a, b; c; x) is known as Gauss hypergeometric
function. Is is worth to mention that another type of
Lauricella hypergeometric function was used in [22]to
determine the BEP of Nakagami-q (Hoyt) fading channels
with spatial diversity.
The evaluation of the previous result as x approximates
−∞ is carried out by considering the integral form of
2
F
1
(
a, b; c; x
)
=
Γ
(
c
)
Γ
(
b
)
Γ
(
c −b
)
1
0
t
b−1
(
1
− t
)
c−b−1
(
1
− tx
)
a
dt, (16)
and taking the limit
lim
x →−∞
x·
2
F
1
1
2
, m +
1
2
;
3
2
;
−
x
2
2
. (17)
This limit can be calculated as follows:
lim
x →−∞
x ·
2
F
1
1
2
, m +
1
2
;
3
2
;
−x
2
=
Γ
(
3/2
)
Γ
(
m +1/2
)
Γ
(
1 − m
)
1
0
t
m−1/2
(
1
− t
)
−m
× lim
x →−∞
x
(
1+tx
2
)
1/2
dt
=−
Γ
(
3/2
)
Γ
(
m +1/2
)
Γ
(
1 − m
)
1
0
t
m−1
(
1
− t
)
−m
dt
=−
Γ
(
3/2
)
B
(
m,1− m
)
Γ
(
m +1/2
)
Γ
(
1 − m
)
,0<m<1,
(18)
in which B(m,1
−m) is the beta function evaluated in m and
1
− m,0<m<1[21].
The CDF of L for m>1 may be obtained by considering
B
x, y
=
Γ
(
x
)
Γ
y
Γ
x + y
, Γ
(
x
)
=
Γ
(
x +1
)
x
, x<0.
(19)
Applying these results in the evaluation of the function
P
L
(l)givenin(14), it follows that
P
L
(
l
)
=
Γ
(
m +1/2
)
√
πΓ
(
m
)
×
l
N
o
m
×
2
F
1
1
2
, m +
1
2
;
3
2
;
−
l
2
N
o
m
+
Γ
(
3/2
)
B
(
m,1
− m
)
Γ
(
m +1/2
)
Γ
(
1 − m
)
.
(20)
The expression of P
L
(l) for integer values of m can be
obtained by substituting the variable x
= tg(θ) in the integral
of (15). The corresponding result is
1
(
x
2
+ a
)
m+(1/2)
dx =
1
a
m
(m
−1)
k=0
(
−1
)
k
C
m−1,k
(
2k +1
)
x
√
x
2
+ a
2k+1
,
(21)
in which
C
m−1,k
=
(
m
− 1
)
!
k!
(
m − 1 − k
)
!
. (22)
By evaluating (21)asx approximates
−∞ and x = l
and substituting the result in (14), the function P
L
(l)canbe
written as
P
L
(
l
)
=
Γ
(
m +1/2
)
√
πΓ
(
m
)
×
(m−1)
k=0
(
−1
)
k
C
m−1,k
(
2k +1
)
×
⎧
⎨
⎩
l
l
2
+ N
0
m
2k+1
+1
⎫
⎬
⎭
.
(23)
4. BEP of M-QAM
The CDF P
L
(l) can be used for computing the BEP of a
square M-QAM system subject to Nakagami-m fading using
the result obtained in [9], in which Yoon and Cho used the
bit mapping consistency of an M-QAM constellation under
Gray coding to show that the BEP of a square M-QAM
system subject to additive white Gaussian noise (AWGN),
denoted by P
b
,canbewrittenas
P
b
=
1
log
2
√
M
log
2
√
M
k=1
P
b
(
k
)
,
(24)
in which P
b
(k)isgivenby
P
b
(
k
)
=
1
√
M
(1−2
−k
)
√
M−1
i=0
⎧
⎨
⎩
w
(
i, k, M
)
erfc
⎛
⎝
(
2i +1
)
3log
2
Mγ
2
(
M − 1
)
⎞
⎠
⎫
⎬
⎭
,
(25)
EURASIP Journal on Advances in Signal Processing 5
in which the weights w(i, k, M)are
w
(
i, k, M
)
=
(
−1
)
i2
k−1
/
√
M
·
2
K−1
−
i · 2
k−1
√
M
+
1
2
,
(26)
γ
= E
b
/N
0
denotes the signal-to-noise ratio per bit, x
denotes the largest integer smaller that x,erfc(·) denotes the
complementary error function and
d
=
3log
2
(
M
)
E
b
2
(
M − 1
)
(27)
represents the minimum distance between two M-QAM
symbol components.
It is important to note that the BEP of M-QAM modula-
tion subject to AWGN is expressed in terms of a weighted
sum of complementary error functions. The term erfc(
·)
in (25) corresponds to twice the probability of the additive
Gaussian noise exceeding (2i +1)
(3log
2
M · E
b
)/2(M − 1).
For non-Gaussian additive channels, the weights in (26)
(which incorporates the effect on the BEP of the bit positions
in a symbol with log
2
M bits) can be used in conjunction with
the cumulative density function (CDF) of the corresponding
additive noise for determining the BEP of an M-QAM
scheme.
Considering the Nakagami-m fading channel, the proba-
bility that the intensity of the new additive noise l(t) exceeds
3(2i +1)
2
log
2
(M)E
b
/(M − 1) can be written as
Prob
⎛
⎜
⎝
l ≥
3
(
2i +1
)
2
log
2
(
M
)
E
b
(
M
− 1
)
⎞
⎟
⎠
=
1 − P
L
⎛
⎜
⎝
3
(
2i +1
)
2
log
2
(
M
)
E
b
(
M
− 1
)
⎞
⎟
⎠
.
(28)
Using the previous result into the CDF obtained from (20),
it follows that
P
L
⎛
⎜
⎝
3
(
2i +1
)
2
log
2
(
M
)
E
b
(
M
− 1
)
⎞
⎟
⎠
=
Γ
(
m +1/2
)
√
πΓ
(
m
)
3
(
2i +1
)
2
log
2
(
M
)
m
(
M − 1
)
E
b
N
0
×
2
F
1
1
2
, m +
1
2
;
3
2
;
−
3
(
2i +1
)
2
log
2
(
M
)
m
(
M − 1
)
E
b
N
0
+
B
(
m,1
− m
)
2Γ
(
m
)
Γ
(
1 − m
)
.
(29)
Hence,
2Prob
⎛
⎜
⎝
l ≥
3
(
2i +1
)
2
log
2
(
M
)
E
b
(
M
− 1
)
⎞
⎟
⎠
=
2
⎧
⎪
⎨
⎪
⎩
1 −
Γ
(
m +1/2
)
Γ
(
m
)
√
π
3
(
2i +1
)
2
log
2
(
M
)
m
(
M − 1
)
E
b
N
0
×
2
F
1
1
2
, m +
1
2
;
3
2
;
−
3
(
2i +1
)
2
log
2
(
M
)
m
(
M − 1
)
E
b
N
0
−
B
(
m,1− m
)
2Γ
(
m
)
Γ
(
1 − m
)
⎫
⎪
⎬
⎪
⎭
.
(30)
Therefore, the probability P
b
(k) of the square M-QAM
can be written as
P
b
(
k
)
=
2
√
M
(1−2
−k
)
√
M−1
i=0
× w
(
i, k, M
)
⎧
⎨
⎩
1 −
Γ
(
m +
(
1/2
))
Γ
(
m
)
√
π
a
i
(
M
)
γ
m
×
2
F
1
1
2
, m +
1
2
;
3
2
;
−
a
i
(
M
)
γ
m
−
B
(
m,1− m
)
2Γ
(
m
)
Γ
(
1 − m
)
⎫
⎬
⎭
,
(31)
in which
a
i
(
M
)
=
3
(
2i +1
)
2
log
2
(
M
)
M − 1
.
(32)
Considering the representation of the beta function from
(19), the probability P
b
(k)canbewrittenas
P
b
(
k
)
=
2
√
M
(1−2
−k
)
√
M−1
i=0
× w
(
i, k, M
)
⎧
⎨
⎩
1
2
−
Γ
(
m +1/2
)
Γ
(
m
)
√
π
a
i
(
M
)
γ
m
×
2
F
1
1
2
, m +
1
2
;
3
2
;
−
a
i
(
M
)
γ
m
⎫
⎬
⎭
.
(33)
6 EURASIP Journal on Advances in Signal Processing
For integer values of m, P
b
(k) is obtained using the CDF
P
L
(l)givenin(23)
P
b
(
k
)
=
2
√
M
(1−2
−k
)
√
M−1
i=0
× w
(
i, k, M
)
⎧
⎨
⎩
1 −
Γ
(
m +1/2
)
√
πΓ
(
m
)
(m−1)
k=0
(
−1
)
k
C
m−1,k
(
2k +1
)
×
⎡
⎣
a
i
(M)γ
a
i
(M)γ + m
k+1/2
+1
⎤
⎦
⎫
⎬
⎭
.
(34)
5. BEP of the M-PAM Scheme
The signal waveforms of an M-ary pulse amplitude modula-
tion can be expressed as
s
(
t
)
= A
I
cos
2πf
c
t
,0≤ t<T,
(35)
in which A
I
is the amplitude of the in-phase component, f
c
is the carrier frequency and T is the symbol interval. In an
M-PAM scheme, log
2
M bits are used to select the amplitude
A
I
from the set {±d, ±3d, , ±(M − 1)d}, in which 2d is
the minimum distance between two distinct symbols, with
d
=
3log
2
M · E
b
(
M
2
− 1
)
,
(36)
in which E
b
is the bit energy. The received PAM signal can be
demodulated coherently.
In [4], a closed-form expression for the BEP of M-
PAM under additive white Gaussian noise (AWGN) has been
derived. In the following, results presented by Cho and Yoon
are used to obtain a closed-form expression for the BEP of
M-PAM subject to Nakagami-m fading.
Based on the consistency of the bit mapping of a Gray
coded signal constellation, Cho and Yoon have derived in [4]
an expression for the BEP of the square M-PAM scheme for
an AWGN channel. It is given by
P
b
=
1
log
2
(
M
)
log
2
(M)
k=1
P
b
(
k
)
,
(37)
with the probability P
b
(k)writtenas
P
b
(
k
)
=
(1−2
−k
)M−1
i=0
⎧
⎨
⎩
w
(
i, k, M
)
M
×erfc
⎛
⎝
(
2i +1
)
3log
2
Mγ
(
M
2
− 1
)
⎞
⎠
⎫
⎬
⎭
,
(38)
where
w
(
i, k, M
)
=
(
−1
)
i2
k−1
/M
·
2
k−1
−
i · 2
k−1
M
+
1
2
. (39)
Using the CDFs given in (20)and(23), the probability
P
b
(k) can be expressed as
P
b
(
k
)
=
2
M
(1−2
−k
)M−1
i=0
w
(
i, k, M
)
×
⎧
⎨
⎩
1 −
Γ
(
m +1/2
)
Γ
(
m
)
√
π
a
i
(
M
)
γ
m
×
2
F
1
1
2
, m +
1
2
;
3
2
;
−
a
i
(
M
)
γ
m
−
B
(
m,1− m
)
2Γ
(
m
)
Γ
(
1 − m
)
⎫
⎬
⎭
.
(40)
Using the beta function expression from (19), the probability
P
b
(k)canbewrittenas
P
b
(
k
)
=
2
M
(1−2
−k
)M−1
i=0
w
(
i, k, M
)
×
⎧
⎨
⎩
1
2
−
Γ
(
m +1/2
)
Γ
(
m
)
√
π
a
i
(
M
)
γ
m
×
2
F
1
1
2
, m +
1
2
;
3
2
;
−
a
i
(
M
)
γ
m
⎫
⎬
⎭
.
(41)
For integer values of m, P
b
(k)maybewrittenas
P
b
(
k
)
=
2
M
(
1−2
−k
)
M−1
i=0
w
(
i, k, M
)
×
⎧
⎨
⎩
1 −
Γ
(
m +1/2
)
√
πΓ
(
m
)
(m−1)
k=0
(
−1
)
k
C
m−1,k
(
2k +1
)
×
⎡
⎣
a
i
(M)γ
a
i
(M)γ + m
k+1/2
+1
⎤
⎦
⎫
⎬
⎭
,
(42)
in which the term a
i
(M)isgivenby
a
i
(
M
)
=
6
(
2i +1
)
2
(
M
2
− 1
)
log
2
M
(43)
and the signal-to-noise ratio per bit γ
= E
b
/N
0
.
6. BEP of I × J-QAM
In an arbitrary rectangular I × J-QAM scheme, the sig-
nal waveforms consist of two independently amplitude-
modulated carriers in quadrature, that can be expressed as
s
(
t
)
= A
I
cos
2πf
c
t
−
A
J
sin
2πf
c
t
,0≤ t<T,
(44)
in which A
I
and A
J
are the amplitudes of in-phase and
quadrature components, respectively, f
c
is the carrier fre-
quency and T is the symbol interval. In an arbitrary I
× J-
QAM scheme, log
2
(I · J) information bits are mapped into
EURASIP Journal on Advances in Signal Processing 7
a two-dimensional constellation symbol using the Gray code.
Among the log
2
(I · J) bits, log
2
I bits are mapped into the
in-phase component, the amplitude A
I
of which is selected
from the set
{±d
I
, ±3d
I
, , ±(I −1)d
I
}, in which 2d
I
is the
minimum distance between the in-phase components of two
distinct symbols. Similarly, log
2
J bits are mapped into the
quadrature component, the amplitude A
J
of which is selected
from the set
{±d
J
, ±3d
J
, , ±(I −1)d
J
}, in which 2d
J
is the
minimum distance between the quadrature components of
two distinct symbols. The demodulation of the received I
×J-
QAM signal can be achieved by performing two parallel M-
PAM demodulations.
For this modulation scheme, the function erfc(
·) in the
expression of P
b
(k) in the M-PAM modulation must be
substituted by
2Prob
⎛
⎜
⎝
l ≥
6
(
2i +1
)
2
log
2
(
I
· J
)
E
b
I
2
+ J
2
− 2
⎞
⎟
⎠
=
2
⎧
⎪
⎨
⎪
⎩
1 −
Γ
(
m +1/2
)
Γ
(
m
)
√
π
6
(
2i +1
)
2
log
2
(
I
· J
)
m
(
I
2
+ J
2
− 2
)
γ
×
2
F
1
1
2
, m +
1
2
;
3
2
;
−
6
(
2i +1
)
2
log
2
(
I
· J
)
m
(
I
2
+ J
2
− 2
)
γ
−
B
(
m,1− m
)
2Γ
(
m
)
Γ
(
1 − m
)
⎫
⎪
⎬
⎪
⎭
.
(45)
The corresponding BEP can be written as
P
b
=
1
log
2
(
I
· J
)
⎛
⎝
log
2
I
k=1
P
I
(
k
)
+
log
2
J
l=1
P
J
(
l
)
⎞
⎠
,
(46)
in which P
I
(k)andP
J
(k)aregivenby
P
I
(
k
)
=
2
I
(1−2
−k
)I−1
i=0
w
(
i, k, I
)
×
⎧
⎨
⎩
1 −
Γ
(
m +1/2
)
Γ
(
m
)
√
π
γa
i
(
I, J
)
m
×
2
F
1
1
2
, m +
1
2
;
3
2
;
−
γa
i
(
I, J
)
m
−
B
(
m,1− m
)
2Γ
(
m
)
Γ
(
1 − m
)
⎫
⎬
⎭
,
(47)
P
J
(
k
)
=
2
J
(1−2
−k
)J−1
j=0
w
j, k, J
×
1 −
Γ
(
m +1/2
)
Γ
(
m
)
√
π
×
γa
j
(I, J)
m
2
F
1
1
2
, m +
1
2
;
3
2
;
−
γa
j
(
I, J
)
m
−
B
(
m,1− m
)
2Γ
(
m
)
Γ
(
1 − m
)
,
(48)
in which
a
j
(
I, J
)
=
6
2j +1
2
log
2
(
I
· J
)
I
2
+ J
2
− 2
.
(49)
Using the beta function representation from (19), P
I
(k)
and P
J
(k) can be simplified as
P
I
(
k
)
=
2
I
(1−2
−k
)I−1
i=0
w
(
i, k, I
)
×
⎧
⎨
⎩
1
2
−
Γ
(
m +1/2
)
Γ
(
m
)
√
π
γa
i
(
I, J
)
m
×
2
F
1
1
2
, m +
1
2
;
3
2
;
−
γa
i
(
I, J
)
m
⎫
⎬
⎭
,
(50)
P
J
(
k
)
=
2
J
(1−2
−k
)J−1
j=0
w
j, k, J
×
⎧
⎨
⎩
1
2
−
Γ
(
m +
(
1/2
))
Γ
(
m
)
√
π
γa
j
(
I, J
)
m
×
2
F
1
1
2
, m +
1
2
;
3
2
;
−
γa
j
(
I, J
)
m
⎫
⎬
⎭
.
(51)
The expressions for the weights w(i, k, I)andw(j, k, J)
are given, respectively, by [9]
w
(
i, k, I
)
=
(
−1
)
i2
k−1
/
√
I
·
2
k−1
−
i · 2
k−1
√
I
+
1
2
,
(52)
w
j, l, J
=
(
−1
)
j2
l−1
/
√
J
·
2
l−1
−
j · 2
l−1
J
+
1
2
.
(53)
It is interesting to point out that the expressions derived
in the previous sections, written in terms of the hyperge-
ometric function, gamma and beta functions, converge to
those results obtained in the paper [23] when the parameter
m of the Nakagami-m distribution is unity, corresponding to
Rayleigh fading.
7. Results
This section presents numerical and Monte Carlo simula-
tions results for the BEP of various modulations schemes
subject to Nakagami-m fading. A computational complexity
of the proposed method is also carried out in Section 7.4
8 EURASIP Journal on Advances in Signal Processing
302520151050
SNR (dB)
m
= 0.51 (analytical)
m
= 0.6 (analytical)
m
= 0.8 (analytical)
m
= 0.95 (analytical)
m
= 0.51 (simulation)
m
= 0.6 (simulation)
m
= 0.8 (simulation)
m
= 0.95 (simulation)
10
−3
10
−2
10
−1
10
0
Bit error probability
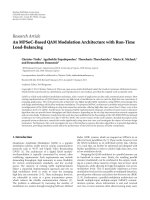
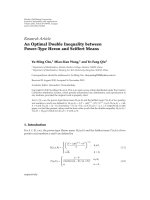
Figure 2: BEP for 64-QAM subject to Nakagami-m fading for
different values of m,0.5 <m<1.
302520151050
SNR (dB)
M
= 16 (analytical)
M
= 64 (analytical)
M
= 256 (analytical)
M
= 16 (simulation)
M
= 64 (simulation)
M
= 256 (simulation)
10
−4
10
−3
10
−2
10
−1
10
0
Bit error probability
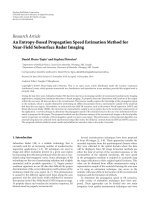
Figure 3: BEP for M-QAM subject to Nakagami-m fading for m =
0.95 and different values of M.
7.1. M-QAM Modulation Scheme. BEP curves for 64-QAM
modulation scheme obtained from (33)arepresentedin
Figure 2. They were obtained for different values of parame-
ter m of the Nakagami-m distribution. For a fixed SNR, it is
observed that the BEP increases as m decreases to 0.51. For
the 64-QAM scheme it is observed that about 5 dB must be
invested in the channel SNR in order to maintain a BEP of
10
−2
if the parameter m changes from 0.80 to 0.60. It is also
302520151050
SNR (dB)
M
= 16 (analytical)
M
= 64 (analytical)
M
= 256 (analytical)
M
= 1024 (analytical)
Shayesteh (16QAM)
M
= 16 (simulation)
M
= 64 (simulation)
M
= 256 (simulation)
M
= 1024 (simulation)
10
−4
10
−3
10
−2
10
−1
10
0
Bit error probability
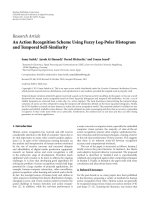
Figure 4: BEP for M-QAM subject to Nakagami-m fading for m =
1 and different values of M.
observed that for a 30 dB channel SNR, the BEP for m = 0.51
is about ten times higher than that one for m
= 0.95.
In Figure 3 BEP curves are grouped for m fixed and
different values of M.ItisobservedinFigure 3 that the 256-
QAM system is more susceptible to fading than the 16-QAM
scheme. It is an expected result because, for a given SNR, the
Euclidean distance between the components of two distinct
symbols in 256-QAM constellation is smaller than the one
for 16-QAM.
It is worth mentioning that Nakagami-m fading with
m
= 1 corresponds to Rayleigh fading. When m = 1and
M
= 16, the results obtained in this paper for the 16-QAM
modulation agree with the results obtained by Shayesteh and
Aghamohammadi in [15] for Rayleigh fading by using
P
16-QAM,Shay
=
1
2
+
1
8
Θ
γ,10
−
1
4
Θ
γ,0.4
·
1+
1
π
tg
−1
3Θ
γ,0.4
−
1
4
Θ
γ,3.6
·
1+
1
π
tg
−1
1
3
Θ
γ,3.6
,
(54)
in which γ
= E
b
/N
o
and Θ(γ, a) =
(a · γ)/(a · γ +1).
Results obtained for m
= 1inFigure 4 show that the
modulation schemes with larger constellations are more
susceptible to Rayleigh fading, which is usual in urban
environments. In spite of that susceptibility, schemes with
larger constellations are widely used when higher bit rates
are needed. From Figure 4 it is observed that the 16-QAM
EURASIP Journal on Advances in Signal Processing 9
302520151050
SNR (dB)
m
= 0.51 (analytical)
m
= 0.6 (analytical)
m
= 0.8 (analytical)
m
= 0.95 (analytical)
m
= 0.51 (simulation)
m
= 0.6 (simulation)
m
= 0.8 (simulation)
m
= 0.95 (simulation)
10
−2
10
−1
10
0
Bit error probability
Figure 5: BEP for 64-PAM subject to Nakagami-m fading for
different values of m.
302520151050
SNR (dB)
m
= 0.51 (analytical)
m
= 0.6 (analytical)
m
= 0.8 (analytical)
m
= 0.95 (analytical)
m
= 0.51 (simulation)
m
= 0.6 (simulation)
m
= 0.8 (simulation)
m
= 0.95 (simulation)
10
−1
10
0
Bit error probability
Figure 6: BEP for 256-PAM subject to Nakagami-m fading for
different values of m.
curve corroborates Shayesteh and Aghamohammadi results
obtained from (54).
7.2. M-PAM Modulation Scheme. BEP curves for the 64-
PAM modulation scheme obtained from (37)and(41)are
presented in Figure 5. The curves are presented for different
values of the parameter m of Nakagami-m distribution. For
302520151050
SNR (dB)
M
= 16 (analytical)
M
= 32 (analytical)
M
= 64 (analytical)
M
= 128 (analytical)
M
= 256 (analytical)
M
= 16 (simulation)
M
= 32 (simulation)
M
= 64 (simulation)
M
= 128 (simulation)
M
= 256 (simulation)
10
−6
10
−5
10
−4
10
−3
10
−2
10
−1
10
0
Bit error probability
Figure 7: BEP for M-PAM subject to Nakagami-m fading for m =
3.50 and different values of M.
a fixed SNR, it is observed that the bit error probability
increases as m decreases to 0.51.
Results for 256-PAM subject to Nakagami-m fading are
presented in Figure 6.AnSNRincreaseofabout3dBinthe
256-PAM scheme is needed to preserve the BEP level, P
b
=
0.1, when m decreases from 0.95 to 0.51.
BEP curves for M-PAM subject to Nakagami-m fading
for m
= 3.50 are presented in Figure 7. One can observe that
the BEP in the 64-PAM scheme varies more, for a fixed SNR,
when compared to the 256-PAM scheme.
7.3. I
×J-QAM Modulation Sche me. BEP curves for the I ×J-
QAM constellation are obtained from (46)to(53).
Results for the 16
×32-QAM scheme for m ranging from
0.51 to 0.80 and from 1.25 to 1.55 are presented, respectively,
in Figures 8 and 9. Comparing Figures 8 and 9, for the same
constellation dimension, it is possible to notice the influence
of the Nakagami-m fading intensity, controlled by m,on
the bit error probability. The BEP increases as parameter m
decreases.
It is observed from Figure 10 that the higher the constel-
lation dimension the higher the BEP. It is observed that to
keep the BEP in 10
−2
, an increase of 7.5 dB on the SNR must
be provided when the 4
× 8-QAM scheme is substituted by
the 16
× 32-QAM one to increase the transmission rate.
7.4. Computational Complexity Analysis. This section
presents a computational complexity analysis for signal
detection in the presence of fading by using the approach
in which the communication channel is seen as an additive
channel. The analysis is performed for two types of detectors,
10 EURASIP Journal on Advances in Signal Processing
302520151050
SNR (dB)
m
= 0.51 (analytical)
m
= 0.6 (analytical)
m
= 0.8 (analytical)
m
= 0.51 (simulation)
m
= 0.6 (simulation)
m
= 0.8 (simulation)
10
−2
10
−1
10
0
Bit error probability
Figure 8: BEP for 16 ×32-QAM subject to Nakagami-m fading for
different values of m, ranging from 0.51 to 0.80.
302520151050
SNR (dB)
m
= 1.25 (analytical)
m
= 1.35 (analytical)
m
= 1.45 (analytical)
m
= 1.55 (analytical)
m
= 1.25 (simulation)
m
= 1.35 (simulation)
m
= 1.45 (simulation)
m
= 1.55 (simulation)
10
−3
10
−2
10
−1
10
0
Bit error probability
Figure 9: BEP for 16 × 32-QAM subject to Nakagami fading for
different values of m, ranging from 1.25 to 1.55.
referred to as Detector DI and Detector DII, as described in
Section 2.
7.4.1. Detector DI. Considering an arbitrary M-ary modula-
tion scheme, after receiving r(t), the detector DI computes
the metrics
|r(t)−αs
i
(t)| for i = 0, 1,2 , M −1andcompares
them to obtain the minimum value.
302520151050
SNR (dB)
4
× 8-QAM (analytical)
8
× 16-QAM (analytical)
16
× 32-QAM (analytical)
32
× 64-QAM (analytical)
4
× 8-QAM (simulation)
8
× 16-QAM (simulation)
16
× 32-QAM (simulation)
32
× 64-QAM (simulation)
10
−3
10
−2
10
−1
10
0
Bit error probability
Figure 10: BEP for I × J-QAM subject to Rayleigh fading (m = 1)
and different values of I and J.
Table 1: Number of real operations required by detector DI to
obtain the estimate
s(t) of the transmitted symbol s(t)basedonthe
noisy observation r(t) considering M
= 4.
Operation Number
multiplication 8
subtraction 8
modulus 4
comparison 3
For each s
i
(t), the detector performs:
(i) one real-complex multiplication: αs
i
(t), that is, two
real multiplications,
(ii) one complex subtraction: r(t)
−αs
i
(t), that is, two real
subtraction,
(iii) one modulus operation.
Since there are M constellation symbols s
i
, the detector
performs 2M multiplications, 2M subtractions and M
modulus operations. At this point, the detector has M values
of metric. Then, M
− 1 comparisons are performed to find
the minimum value which corresponds to the most probable
s
i
(t). Ta bl e 1 summarizes the total number of operations
required for detector DI, considering M
= 4.
7.4.2. Detector DII. After receiving r(t), detector DII com-
putes the metrics
|r(t)/α − s
i
(t)| for i = 0, 1, 2, M − 1
and compares them to obtain the minimum value. It is
important to note that the detector calculates r(t)/α only
once. This corresponds to one complex-real division (two
real divisions).
EURASIP Journal on Advances in Signal Processing 11
Table 2: Number of real operations required by detector DII to
obtain the estimate
s(t) of the transmitted symbol s(t)basedonthe
noisy observation r(t) considering M
= 4.
Operation Number
division 2
subtraction 8
modulus 4
comparison 3
Table 3: Number of real multiplications required by detector DI
and the number of real divisions required by detector DII to obtain
the estimate
s(t) of the transmitted symbol s(t) based on the noisy
observation r(t) as a function of M.
Detector DI Detector DII
multiplications divisions
4-QAM 8 2
16-QAM 32 2
64-QAM 128 2
256-QAM 512 2
16-PAM 32 2
32-PAM 64 2
64-PAM 128 2
128-PAM 256 2
8×16-QAM 256 2
16
×32-QAM 1024 2
After that, for each s
i
(t) the detector performs:
(i) one complex subtraction (r(t)/α
− s
i
(t)), that is, two
real subtractions,
(ii) one modulus operation.
Finally, the detector DII has M values of metric. There-
fore, DII must perform M
− 1 comparisons to find the
minimum value and consequently the most probable s
i
(t).
Ta bl e 2 summarizes the total number of operations required
for detector DII considering M
= 4.
7.4.3. Performance Comparison. Tabl es 1 and 2 show that
both detection schemes perform the same number of
subtractions, comparisons, and moduli. The basic difference
is that detector DI requires 2M multiplications while detector
DII requires only 2 divisions.
According to Knuth [24], a multiplication or a divi-
sion of two n-bit numbers can be accomplished in
O(n log n log log n) steps. Current implementations of
those operations can actually be done using the same number
of clock cycles. Thus, it is reasonable to assign the same
complexity for both multiplication and division. Based on
those statements, one can conclude that detector DII has a
lower complexity when compared to that of detector DI. The
proposed approach becomes more attractive for higher order
modulation schemes. For instance, detector DII requires only
2 divisions for detecting a 256-QAM symbol while detector
DI requires 512 multiplications to perform the same task.
8. Conclusion
This paper presented an alternative method to obtain the
BEP of modulation schemes subject to Nakagami-m fading.
In the approach, the Nakagami-m fading channel is seen as
an additive noise channel whose noise is modeled as the
ratio between a Gaussian random variable and a Nakagami-
m random variable. Exact and closed-form expressions were
obtained for the BEP of the modulation schemes square
M-QAM, M-PAM, and rectangular I
× J-QAM, subject
to Nakagami-m fading. The mathematical expressions are
written in terms of the Hypergeometric function. The main
contribution of this paper is to show that this alternative
method can be used to reduce the computational complexity
for detecting signals in the presence of fading.
References
[1]J.G.Proakis,Digital Communications, McGraw-Hill, New
York, NY, USA, 3rd edition, 1995.
[2] J. Lu, K. B. Letaief, J. C I. Chuang, and M. L. Liou, “M-PSK
and M-QAM BER computation using signal-space concepts,”
IEEE Transactions on Communications, vol. 47, no. 2, pp. 181–
184, 1999.
[3] L L. Yang and L. Hanzo, “Recursive algorithm for the error
probability evaluation of M-QAM,” IEEE Communications
Letters, vol. 4, no. 10, pp. 304–306, 2000.
[4] K. Cho and D. Yoon, “On the general BER expression of
one- and two-dimensional amplitude modulations,” IEEE
Transactions on Communications, vol. 50, no. 7, pp. 1074–
1080, 2002.
[5] P M. Fortune, L. Hanzo, and R. Steele, “On the computation
of 16-QAM and 64-QAM performance in Rayleigh-fading
channels,” IEICE Transactions on Communications, vol. E75-B,
no. 6, pp. 466–475, 1992.
[6] L. Hanzo, R. Steele, and P. Fortune, “A subband coding,
BCH coding, and 16-QAM system for mobile radio speech
communications,” IEEE Transactions on Vehicular Technology,
vol. 39, no. 4, pp. 327–339, 1990.
[7] P. K. Vitthaladevuni and M S. Alouini, “BER computation of
4/M-QAM hierarchical constellations,” IEEE Transactions on
Broadcasting, vol. 47, no. 3, pp. 228–239, 2001.
[8] W.T.A.Lopes,W.J.L.Queiroz,F.Madeiro,andM.S.Alencar,
“Exact bit error probability of M-QAM modulation over
flat Rayleigh fading channels,” in Proceedings of SBMO/IEEE
MTT-S International Microwave and Optoelectronics Confer-
ence (IMOC ’07), pp. 804–806, Salvador, Brazil, January–
November 2007.
[9] D. Yoon and K. Cho, “General bit error probability of
rectangular quadrature amplitude modulation,” Electronics
Letters, vol. 38, no. 3, pp. 131–133, 2002.
[10] X. Dong, N. C. Beaulieu, and P. H. Wittke, “Error probabilities
of two-dimensional M-ary signaling in fading,” IEEE Transac-
tions on Communications, vol. 47, no. 3, pp. 352–355, 1999.
[11] J. W. Craig, “A new, simple and exact result for calculating the
probability of error for two-dimensional signal constellations,”
in Proceedings of Military Communications Conference (MIL-
COM ’91), pp. 571–575, November 1991.
[12] A. Maaref and S. A
¨
ıssa, “Exact closed-form expression for
the bit error rate of orthogonal STBC in Nakagami fading
channels,” in Proceedings of the 60th IEEE Vehicular Technology
12 EURASIP Journal on Advances in Signal Processing
Conference (VTC ’04), pp. 2493–2497, Los Angeles, Calif, USA,
September 2004.
[13] A. Maaref, “Performance analysis of orthogonal space-time
block codes in spatially correlated MIMO Nakagami fading
channels,” IEEE Transactions on Wireless Communications, vol.
5, no. 4, pp. 807–817, 2006.
[14] A. Maaref and S. A
¨
ıssa, “Adaptive modulation using orthogo-
nal STBC in MIMO Nakagami fading channels,” in Proceedings
of the IEEE International Symposium on Spread Spectrum Tech-
niques and Applications (ISSSTA ’04), pp. 145–149, Sydney,
Australia, August-September 2004.
[15] M. G. Shayesteh and A. Aghamohammadi, “On the error
probability of linearly modulated signals on frequency-flat
Ricean, Rayleigh, and AWGN channels,” IEEE Transactions on
Communications, vol. 43, no. 2, pp. 1454–1466, 1995.
[16] W. T. A. Lopes, F. Madeiro, and M. S. Alencar, “Closed-
form expression for the bit error probability of rectangular
QAM subject to Rayleigh fading,” in Proceedings of the 66th
IEEE Vehicular Technology Conference ( VTC ’07), pp. 915–919,
Baltimore, Md, USA, September-October 2007.
[17] W. T. A. Lopes and M. S. Alencar, “QPSK detection schemes
for Rayleigh fading channels,” in Proceedings of the IEEE
International Telecommunications Symposium (ITS ’02), Natal,
Brazil, September 2002.
[18] J.M.WozencraftandI.M.Jacobs,Principles of Communication
Engineering, John Wiley & Sons, New York, NY, USA, 1965.
[19] A. Papoulis, Probability, Random Variables and Stochastic
Processes, McGraw-Hill, New York, NY, USA, 1991.
[20] W. J. L. Queiroz, W. T. A. Lopes, F. Madeiro, and M. S.
Alencar, “Bit error probability of M-QAM and I
× J-QAM
modulation schemes in Nakagami fading,” in Proceedings of the
SBMO/IEEE MTT-S Internat ional Microwave and Optoelec-
tronics Conference (IMOC ’07), pp. 807–811, Salvador, Brazil,
January-November 2007.
[21] M. Abramowitz and I. A. Stegun, Handbook of Mathematical
Functions, Dover, New York, NY, USA, 1972.
[22] T. Q. Duong, H. Shin, and E K. Hong, “Error probability of
binary and M-ary signals with spatial diversity in Nakagami-
q (Hoyt) fading channels,” EURASIP Journal on Wireless
Communications and Networking, vol. 2007, Article ID 53742,
8 pages, 2007.
[23]W.T.A.Lopes,F.Madeiro,andM.S.Alencar,“UmNovo
M
´
etodo para o C
´
alculo da Probabilidade de Erro de Bit de
Esquemas de Modulac¸
˜
ao QAM Sujeitos ao Desvanecimento
Rayleigh,” Revista da Sociedade Brasileira de Telecomunicac¸
˜
oes,
vol. 19, no. 2, pp. 58–67, 2004.
[24] D. E. Knuth, The Art of Computer Programming: Seminumer-
ical Algorithms, vol. 2, chapter 4, Addison-Wesley, Reading,
Mass, USA, 1969.