Báo cáo hóa học: " Research Article Short Exon Detection in DNA Sequences Based on Multifeature Spectral Analysis" potx
Bạn đang xem bản rút gọn của tài liệu. Xem và tải ngay bản đầy đủ của tài liệu tại đây (714.54 KB, 8 trang )
Hindawi Publishing Corporation
EURASIP Journal on Advances in Signal Processing
Volume 2011, Article ID 780794, 8 pages
doi:10.1155/2011/780794
Research Ar ticle
Short Exon Detection in DNA Sequences Based on
Multifeature Spectral Analysis
Nancy Yu Song and Hong Yan
Department of Electronic Engineering, City University of Hong Kong, Kowloon, Hong Kong
Correspondence should be addressed to Nancy Yu Song,
Received 30 June 2010; Revised 26 August 2010; Accepted 31 October 2010
Academic Editor: Antonio Napolitano
Copyright © 2011 N. Y. Song and H. Yan. This is an open access article distributed under the Creative Commons Attribution
License, which permits unrestricted use, distribution, and reproduction in any medium, provided the original work is properly
cited.
This paper presents a new technique for the detection of short exons in DNA sequences. In this method, we analyze four
DNA structural properties, which include the DNA bending stiffness, disrupt energy, free energy, and propeller twist, using
the autoregressive (AR) model. The linear prediction matrices for the four features are combined to find the same set of linear
prediction coefficients, from which we estimate the spectrum of the DNA sequence and detect exons based on the 1/3 frequency
component. To overcome the nonstationarity of DNA sequences, we use moving windows of different sizes in the AR model.
Experiments on the human genome show that our multi-feature based method is superior in performance to existing exon
detection algorithms.
1. Introduction
Signals converted from DNA sequence are nonstationary.
The coding sequence of a prokaryotic gene is a contiguous
series of three-nucleotide codons. The codon for one amino
acid is immediately adjacent to the codon for the next amino
acid in the polypeptide chain. However, this may not be the
case for eukaryotic genes. Many eukaryotic genes comprise
blocks of exons from each other by blocks of intons. The
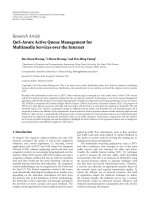
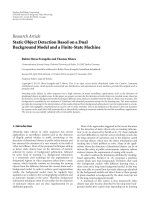
exons contain protein-coding instructions. Figure 1 shows a
eukaryotic gene which contains three exons separated by two
introns. In the transcription process, the gene sequence will
firstly be transcribed into pre-mRNA. Then all the intron
areas in the pre-mRNA will be spliced out and the exon areas
will be joined together. This generates a mature mRNA which
will be used afterwards to produce proteins [1].
The amount of genome sequence data is growing rapidly.
Biological interpretations need to keep pace with the fast
increase of raw sequence data. Biological experiments for
gene identification in DNA sequences are costly to conduct,
hence there exists a strong demand for fast and accurate
computer tools to analyze the sequences, especially for
finding genes and determining their functions [2]. In
eukaryotic organisms, the task of gene recognition also
includes distinguishing exons and introns. Moreover, this
task is more complex in vertebrates than in lower eukaryotes.
This is because vertebrate genes consist of multiple short
exons separated by introns that are 10 or 100 times longer on
average. Only 1–3% of the human genome is translated into
proteins. Most of the human exons are short. The average
length of human exons is 137 bp [3].
The 3-periodicity which exists in DNA transcripts espe-
cially the protein-coding regions in a DNA sequence has been
a known phenomenon for some time [4]. The periodicity
is caused by uneven distribution of codons and provides a
possible approach for exon identification. This paper focuses
on the detection of the regions with 3-periodicity along a
DNA sequence, but does not identify untranslated regions
(UTRs) or nonprotein coding regions. The problem of
classifying UTRs and gene expression regulatory elements in
a DNA sequence has been addressed in our previous work
[5, 6].
One direct approach of exon identification is to find
splice sites. A splice sites can be recognized by some
characteristic motifs. Several statistical models have been
used to approximate the distributions over sets of aligned
sequences, for example, based on the Markov Models
and the Hidden Markov Models [7]. Another approach
2 EURASIP Journal on Advances in Signal Processing
Exon1 Intron1 Exon2 Intron2 Exon3
Exon1 Exon2 Exon3
Figure 1: A eukaryotic gene and the splicing process.
to distinguishing exonic and intronic regions is based on
digital signal processing (DSP) methods. Main DSP methods
include the discrete Fourier transform, digital filters, entropy
measures and spectral analysis using parametric models
[8]. All these approaches look for a 3-periodic pattern in
the occurrences of A, C, G or T. The Fourier transform
has been widely used for sequence analysis [9]. However,
the spectrum obtained by the Fourier transform contains
windowing artifacts and spurious spectral peaks. Akhtar et
al. proposed an optimized period-3 method which is called
paired and weighted spectral rotation (PWSR) measure
which takes into account both computational complexity
and the relative accuracy of gene prediction [10]. Methods
employing digital filters have also been developed in exon
detections. Vaidyanathan and Yoon proposed a method
which deploys an antinotch digital filter to find the signal
energy at the 2π/3frequency[11]. Entropy measures are
also employed in exon detection. A complexity measure
based on the entropic segmentation of DNA sequences
into homogeneous domains is defined by Rom
´
an-Rold
´
an
et al. [12]. Nicorici and Astola proposed a method by
applying recursively an entropic segmentation method on
DNA sequences [13]. This method does not require prior
training. Parametric models such as autoregressive modeling
of DNA sequences were addressed by Chackravarthy et al.
[14]. Yan and Pham proposed an AR model-based sequence
analysis method to estimate the power spectral density [15].
The AR model-based analysis is able to produce stronger
power spectral density peaks and weaker artifacts than the
discrete Fourier transform (DFT). Choong and Yan further
proposed multiscale parametric spectral analysis for exon
detection based on the AR model [16]. This method is
proven to be better than the DFT and previous AR model-
based methods. Jiang and Yan also used wavelet subspace
Hilbert-Huang transform to identify exon regions [17]. G.
Tina and T. Tessamma, proposed to denoise the signals
in the coding regions using the discrete wavelet transform
[18].
A problem of signal processing-based methods for find-
ing the 3-periodicity is that it is very hard to identify short
exons which are very common in human genome sequence.
The 3-periodicity is essentially a very weak signal embedded
in the DNA sequence and it is difficult to detect this type of
signals computationally. If the exon region is short, it will be
even harder to find the periodic signals.
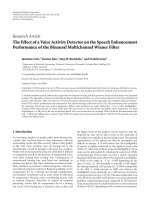
In this paper, we propose a method to tackle the short
exon identification problem based on multifeature spectral
analysis. A DNA sequence is converted into numerical repre-
sentations based on four DNA structural features, including
the DNA-bending stiffness, disrupt energy, free energy and
propeller twist. Then we perform AR model-based spectral
analysis of these features to detect short exon regions. Based
on experiment results, our multifeature spectral analysis
method is compared with the multiscale FBLP model [16],
the discrete wavelet transform denoise method [18]as
well as a simple PSD addition method in this paper. The
comparison shows that our method is superior in perfor-
mance to the three other methods for short exon detection
(Figure 2).
2. Methodology
2.1. Numerical Representation of a DNA Sequence. DNA is
the hereditary material in humans and almost all other
organisms. The structure of DNA is highly stable which
makes it a perfect carrier of hereditary information. The
information in DNA is stored as a code made up of four
chemical bases: adenine (A), cytosine (C), guanine (G) and
thymine (T). DNA bases pair up with each other, A with
T and C with G, forming units called base pairs. Hence a
DNA sequence is naturally represented by a string which
c o n s i s t s o f “ A ”, “ C ”, “ G ” a n d “ T ”. H o w e v e r , s i n c e D NA
sequence contains a series of symbolic values, it is very hard
to deal with it by signal processing methods. If the sequence
could be represented by numerical values, a lot of signal
processing algorithms could be applied to analyzing the
sequence.
Several methods can be used to convert a DNA sequence
into discrete-time signals. The most straightforward way is to
assign1toA,2toC,3toGand4toT.Anotherwayistouse
single-base binary representation. For a DNA sequence [n],
we can construct four indicator sequences as:
x
i
[
n
]
=
⎧
⎨
⎩
1ifx
[
n
]
= i
0otherwise
(
i
∈{A,C,G, T}
)
. (1)
A better way is to use the double-base (DB) curve represen-
tation [19]. There are four single nucleotide bases: A, G, C,
T. The DB curve representation is defined as:
x
b
1
b
2
(
n
)
=
n
i=1
s
(
i
)
, n = 1, 2, ,N,(2)
where N isthelengthoftheDNAsequenceandtheunit
numeric value s(n)isdefinedas
s
(
n
)
=
⎧
⎪
⎪
⎪
⎪
⎨
⎪
⎪
⎪
⎪
⎩
+1 for base b
1
,
−1forbaseb
2
,
0 for other bases,
(3)
EURASIP Journal on Advances in Signal Processing 3
DNA
sequence
Four numerical sequences of
structural features
Combine 4 linear prediction
matrices
AR model of each sequence
SVD filtering
Compute the AR coefficients
Compute the PSD
END
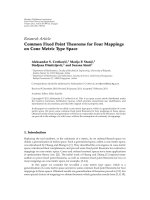
Figure 2: The flowchart of our algorithm for short exon detection.
where b
1
, b
2
∈{A, G, C, T} and b
1
/
=b
2
. Therefore the
nucleotide bases can be classified into six double-bases: AC,
AG,AT,CG,CTandGT.TheDBcurvereflectsthedifference
between two kinds of nucleotides along a DNA sequence.
Compared to the single-base binary representation in which
only the appearance of one kind of nucleotide is shown,
the DB curve representation is much more informative. The
drawback is that the number of signals to be processed
increases from four to six.
All the conversion methods mentioned above are based
on subjective assigned numbers. There is no biological
evidence which supports the numerical assignment. DNA
structural property values are obtained by physical models
or biological experiments. Hence it is more reasonable to
do the conversion according to DNA structural properties.
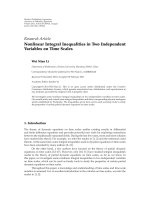
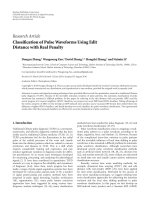
Figures 3(a) and 3(b) show the PSD obtained for base
pairs 6900–8100 of a DNA sequence with NCBI accession
number Z20656. The actual exon positions are indicated
by red rectangles. The shortest exon is only 27-bp long
located at relative position 430. It is not difficult to see
that there is no peak showing the existence of the 27-
bp long exon in Figure 3(a) which is obtained from the
indicator sequences while there is an obvious peak in the
same position in Figure 3(b) which is obtained from the
DNA propeller twist value. The result here shows that
DNA structural properties can provide better results than
simple numerical indicator sequences for the 1/3 frequency
detection.
In this paper, we carry out the conversion based on the
structural properties of DNA sequence. The four properties
used in the conversion are DNA-bending stiffness [20, 21],
disrupt energy [21, 22], free energy [21, 23] and propeller
twist [21, 24]. These four structural properties are selected
out of a total of 14 structural properties [21]. In the selection
process, firstly the DNA sequences are converted into numer-
ical values based on the 14 structural features, respectively.
The 14 structural features are A philicity, B-DNA twist,
bendability, bending stiffness, denaturation, disrupt energy,
free energy, GC trinucleotide content, nucleosome position-
ing, propeller twist, protein DNA twist, protein induced
deformability,stacking energy, and Z-DNA stabilizing energy
[21]. Then the power spectral density (PSD) of each signal is
analyzed. The area under the ROC curve (AUC) is used as the
evaluation criterion. A larger AUC value indicates a better
performance. We tested on the DNA sequence with NCBI
accession number Z20656. We set the AUC threshold to be
0.8 and selected 4 out of 14 structural properties for further
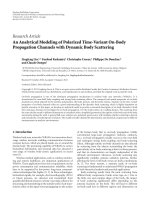
analysis. The ROC curves obtained by the 14 structural
properties are depicted in Figure 4.TheROCcurvesobtained
by the four selected properties are shown in red. The other
curves which are not selected for further computation are in
blue.
The physical meanings of the properties are as follows.
The bending stiffness is regarded as the string correlation
with the anisotropic flexibility of the DNA [20, 21]. The
values of bending stiffness are given in nm. The values stand
for the persistence length value that is derived from the
experimental data [21]. Regions with a high disrupt energy
valuewillbemorestablethanaregionwithalowerenergy
value [21, 22]. Regions with low free energy content will be
more stable than regions with higher free energy content
[21, 23
]. The dinucleotide propeller twist is the twist angle
measured in degrees [21, 24].
2.2. Moving Window-Based Approach for Nonstationary
Signal An alysis. If we convert a DNA sequence into a
digital signal, the signal is nonstationary in nature since
different regions of the sequence contain different frequency
components. Many traditional signal processing methods
including the DFT are based on the premise that the signal
is stationary. It is important to use nonstationary signal
processing methods to analyze a DNA sequence.
The solution to this problem is that we can deploy a
moving window. For each window location, we analyze only
the data within the window. The idea behind this approach
is that we assume that the signal is stationary within a
short piece of sequence though it is not stationary over
the entire sequence. The idea is similar to the spectrogram
based method widely used in speech signal processing.
However, we are only interested in the 1/3 frequency
component rather than the full frequency spectrum at
each base along the DNA sequence in the exon detection
process.
In addition, we analyze multiple input signals at the same
time since they all contain the 1/3 frequency component. A
moving window is applied to the four signals obtained from
the four DNA structural properties. The size of the window
will be several times as large as the fundamental repeating
unit, which in this case is three.
2.3. Multiscale Spectrum Analysis. According to the Heisen-
berg Uncertainty Principle, one cannot know what spectral
componentsexistatwhatinstancesoftimes.Whatonecan
know is which frequencies exist at what intervals of time.
In addition, the better the frequency resolution we have,
4 EURASIP Journal on Advances in Signal Processing
0
0.5
1
1.5
PSD
2
2.5
3
3.5
×10
4
0 200 400 600 800 1000 1200 1400
Multi-scale FBLP
Relative position in the sequence
(a)
0
0.5
1
1.5
PSD
2
2.5
3
×10
4
0 200 400 600 800 1000 1200 1400
Conversion based on propeller twist
Relative position in the sequence
(b)
Figure 3: (a) The PSD obtained from multiscale FBLP method applied to the indicator seqeunces. (b) The PSD obtained by applying the
AR modeling method to the DNA propeller twist value.
0
0.1
0.2
0.3
0.4
0.5
Sensitivity
0.6
0.8
0.9
1
0.7
00.20.40.60.81
ROC curves
1-specificity
Figure 4: ROC curves obtained from the 14 structural properties.
the worse time resolution we get and vice versa. When we
apply the principle to our problem, it becomes a tradeoff
between frequency resolution and position resolution. In
order to know what frequency content is contained in
a region, we have to apply a moving window along the
sequence. Of course, the better the location information
we have, the worse the frequency resolution we get and
vice versa. As a result, in order to obtain more accurate
information in both frequency and location aspects, we
process the signals using several different moving window
sizes.
As is already known, different window sizes may produce
different spectral estimation results. Large window sizes
may miss short exons but produce more accurate results
for long exons. Small window sizes may cause more false
alarms but will not miss short exons. Multiscale spectrum
analysis is equivalent to wavelet analysis [25]intermsof
joint frequency and position localization. We use the AR
model instead of wavelets here because the AR model can
provide more precise information about the 1/3 frequency
component for short signals. Also multiscale spectrum
analysis is proven to work better than fixed windows in
exon detection [16]. The purpose of deploying multiscale
is to overcome the drawbacks in using either small or
large window sizes and reinforcing their advantages. The
window size is chosen to be 30, 60, 90 and 120 in our
approach.
2.4. AR Model and PSD. An autoregressive (AR) model is a
spectral estimation technique. An AR model can overcome
short signal problems, give a higher resolution and produce
smaller artifacts for spectral estimation compared with the
DFT [15]. The details of the AR model are described
below.
Let S
= [y
1
, y
2
, y
3
, , y
t
, , y
n
]beastationarytime
series which follows an AR model of order. The AR model
in matrix form can be described as
y
= Ya + ε,(4)
where a is the AR model coefficients and ε is a noise sequence
which is assumed to be normally distributed, with zero mean
and variance σ
2
.
EURASIP Journal on Advances in Signal Processing 5
If we use the forward-backward linear prediction
method, (4)canbewrittenas:
⎡
⎢
⎢
⎢
⎢
⎢
⎢
⎢
⎢
⎢
⎢
⎢
⎢
⎢
⎢
⎢
⎢
⎢
⎢
⎢
⎢
⎢
⎣
y
p +1
y
p +2
.
.
.
y
[
n
]
y
[
1
]
y
[
2
]
.
.
.
y
n − p
⎤
⎥
⎥
⎥
⎥
⎥
⎥
⎥
⎥
⎥
⎥
⎥
⎥
⎥
⎥
⎥
⎥
⎥
⎥
⎥
⎥
⎥
⎦
=
⎡
⎢
⎢
⎢
⎢
⎢
⎢
⎢
⎢
⎢
⎢
⎢
⎢
⎢
⎢
⎢
⎢
⎢
⎢
⎢
⎢
⎢
⎣
y
p
y
p − 1
···
y
[
1
]
y
p +1
y
p
···
y
[
2
]
.
.
.
.
.
.
.
.
.
y
[
n
−1
]
y
[
n −2
]
··· y
n − p
y
[
2
]
y
[
3
]
··· y
p +1
y
[
3
]
y
[
4
]
··· y
p +2
.
.
.
.
.
.
.
.
.
y
n − p +1
y
n − p +2
···
y
[
n
]
⎤
⎥
⎥
⎥
⎥
⎥
⎥
⎥
⎥
⎥
⎥
⎥
⎥
⎥
⎥
⎥
⎥
⎥
⎥
⎥
⎥
⎥
⎦
×
⎡
⎢
⎢
⎢
⎢
⎢
⎢
⎢
⎢
⎢
⎢
⎢
⎢
⎢
⎢
⎢
⎢
⎢
⎢
⎢
⎢
⎢
⎢
⎢
⎣
a
1
a
2
a
3
.
.
.
.
.
.
.
.
.
a
p−1
a
p
⎤
⎥
⎥
⎥
⎥
⎥
⎥
⎥
⎥
⎥
⎥
⎥
⎥
⎥
⎥
⎥
⎥
⎥
⎥
⎥
⎥
⎥
⎥
⎥
⎦
+ ε
j
.
(5)
Equation (5) can be ill-conditioned or inconsistent in many
applications. In these cases, we can use singular value
decomposition (SVD) to overcome the problem. That is,
matrix Y is decomposed into three matrices as follows:
Y
p×[2×(n−p)]
= U
p×[2×(n−p)]
Λ
[2×(n−p)]×[2×(n−p)]
×V
T
[2
×(n−p)]×[2×(n−p)]
,
(6)
where Λ is a diagonal matrix containing singular values:
Λ
[2×(n−p)]×[2×(n−p)]
=
⎡
⎢
⎢
⎢
⎢
⎢
⎢
⎢
⎣
λ
1
00 0
0 λ
2
00
.
.
.
.
.
.
.
.
.
.
.
.
000λ
2×(n−p)
⎤
⎥
⎥
⎥
⎥
⎥
⎥
⎥
⎦
=
diag
λ
j
.
(7)
In order to reduce noise effect, we can rank singular values
as:
λ
1
≤ λ
2
≤···≤λ
2×(n−p)
. (8)
Then we replace small λ
j
values with zero.
The AR coefficients can then be found from the following
equation:
a
= V
[2×(n−p)]×[2×(n−p)]
Λ
−1
[2
×(n−p)]×[2×(n−p)]
U
T
p
×[2×(n−p)]
y,
(9)
where Λ
−1
[2
×(n−p)]×[2×(n−p)]
= diag(1/λ
j
).
The prediction order p is chosen to be N/2whereN refers
to window size. The reason for selecting this order is that
Lang and McClellan recommended that the number of AR
coefficients should be in the range of N/3andN/2forthe
best frequency estimation [26].
In our approach, a modified AR model-based spectral
estimation method is used. The idea is that since the four
signals are obtained based on the same DNA sequence, their
AR coefficients a
1
to a
4
, of the signals should be similar to
each other. Hence we can stack the four matrices obtained
from each model before doing singular value decomposition.
It is expected that a better noise filtering effect will be
achieved. The detailed method is described below:
Assume that the AR model for the DNA-bending stiff-
ness, disrupt energy, free energy and propeller twist are,
respectively,
y
1
= Y
1
a
1
+ ε,
y
2
= Y
2
a
2
+ ε,
y
3
= Y
3
a
3
+ ε,
y
4
= Y
4
a
4
+ ε.
(10)
That is, we establish an AR model in (4)and(5) for each of
the four structural properties.
Note that the original signals should be normalized to the
range of
−1 to 1 before constructing the matrices. Then we
combine the four matrices together as
Q
=
⎡
⎢
⎢
⎢
⎢
⎢
⎢
⎣
Y
1
Y
2
Y
3
Y
4
⎤
⎥
⎥
⎥
⎥
⎥
⎥
⎦
. (11)
Each of the Matrices Y
1
, Y
2
, Y
3
, Y
4
is composed of two
individual Toeplitz matrices. However, the combined matrix
Q is not Toeplitz matrix but a block Toeplitz matrix.
We apply singular value decompositions to, compute,
rank the singular values and zero the small ones. Then we
compute the noise-reduced Q by
Q
= UΛV
T
, (12)
where Λ is a new diagonal matrix containing processed
singular values.
6 EURASIP Journal on Advances in Signal Processing
Then we average the values in each descending diagonal
in each Toeplitz matrix and put the averaged value back
to their original position. After that, we carry out singular
value decomposition to X and compute the AR coefficients
according to (6), (7)and(9).
Finally, power spectral density (PSD) can be calculated
based on the following equation:
P
AR
(
ω
)
=
σ
2
1+
p
k
=1
a
k
exp
−
jωk
2
, (13)
where σ
2
is the variance of noise.
3. Experiment Results
In order to assess the performance of the proposed
algorithms, a total of 28 sequences with length between
20000 bp and 40000 bp are downloaded from NCBI Gen-
Bank database. There are 564 exons in the sequences.
The NCBI accession numbers for these DNA sequences
are AB006684, AB022785, AB044947, AB088096, AB088098,
AX000035, AX000057, AX259776, AX589170, AX698292,
AX814795, AX938514, CQ894214, AB088115, AB103596,
AB103602, AB103604, AB202086, AB202093, AB202094,
AB202095, AB202112, AF004877, AF026276, AF026801,
AF039401, AF178081, Z20656. The total sequence length is
743378 bp.
We have compared our exon detection results with
those from the discrete wavelet transform denoise method
[18] and the multiscale FBLP method [16]aswellasa
simple PSD addition method. Two evaluation criteria are
used in the comparison. The first one is the Receiver
Operating Characteristic (ROC) curve and the area under
the ROC curve (AUC). This criterion is used to evaluate
the sensitivity and specificity of each method and its overall
performance. The second evaluation criterion is the rate of
correct detection of short exons, each of which is no longer
than 70 bp.
In the simple PSD addition method, we compute the PSD
for each of the four DNA structural signals. Then the four
PSDs are added to obtain one PSD which is used for the ROC
curveanalysisaswellasshortexondetection.
To draw the ROC curve, we shall firstly quantize the
PSD values. Then set the threshold value to be the smallest
value of the quantized PSD. All the values greater than the
threshold value are considered to be the indication of exonic
areas while all the values lower than the threshold values
are considered to be the indication of intronic areas. Then
we compute true negative, false negative, true positive and
false positive values. After that, the specificity and sensitivity
values are computed as in
Speci f icity
=
Tr ue Ne gative s
True Negatives + False Positives
,
Sensitivity
=
Tr ue Po sitiv es
True Positives + False Negatives
.
(14)
Each time we will set the threshold value to be one
which is larger than the current one value to obtain new
Table 1: Area under the ROC curve (AUC) for human DNA
sequences.
Multiscale DWT
Simple addition Multifeature
FBLP de-noise
AUC 0.63 0.68 0.72 0.72
Table 2: Sensitivity and specificity at optimal cutoff point for
human DNA sequences.
Multiscale DWT
Simple addition Multifeature
FBLP de-noise
Sensitivity 0.32 0.42 0.57 0.59
Specificity 0.94 0.89 0.78 0.76
sensitivity and specificity values until we reach the largest
quantized value. Finally, we draw ROC curves based on all
the specificity and sensitivity values. It shall be pointed out
that we take logarithm of the PSD to amplify the signal before
quantization for the multiscale FBLP, simple addition and
multifeature spectral analysis methods.
The ROC curves for the four algorithms are shown in
Figure 5 and the AUC values are given in Ta b l e 1.Improve-
ment of the results is noticed as the AUC of our method is
larger than the other three methods. In Figure 5, although the
ROC curve obtained by multiscale FBLP method is higher
than that of our method in the interval [0, 0.12], our method
has an overall much better performance.
The optimal cutoff point is decided based on the Youden’s
index [27]. The sensitivity and specificity values are given
in Ta b l e 2 .FromTa b l e 2 , we observe that our method has
the highest sensitivity value while multiscale FBLP method
has the highest specificity value. Our method increases
the sensitivity by 0.27 with a 0.18 decrease of specificity
compared with the multiscale FBLP method and increases
the sensitivity by 0.17 with a 0.11 decrease of specificity
compared with the DWT denoise method. For the same
sensitivity, our method produces the best specificity. And
for the same specificity, our method produces the best
sensitivity. That is, overall our method performs the best as
it produces the largest area under the ROC.
The performances of short exon detection methods are
presented in Ta b le 3. The short exon positions are identified
first. Then every nucleotide within each short exon is
labeled positive or negative according to the optimal cutoff
point value obtained from previous steps. If the number
of nucleotides which are labeled positive composes 80%
or more of the exon region, the exon is considered being
detected. From Tab l e 3,itisobservedthatourmethodfor
short exon detection is superior to the other two methods.
We should also point out here that the detection results
of multifeature spectral analysis are not a simple combi-
nation of the detection results from four features analyzed
separately. From Ta b l e 3, it can be seen that the detection
results of multifeature spectral analysis surpasses that of the
simple addition method by 10.4%. The experiment results
demonstrate the effectiveness of our multifeature based
approach.
EURASIP Journal on Advances in Signal Processing 7
0
0.1
0.2
0.3
0.4
0.5
Sensitivity
0.6
0.8
0.9
1
0.7
00.20.40.60.81
ROC curve for human DNA sequences
1-specificity
Multi-scale FBLP
Wavelet De-noise
Simple addition
Multi-feature
Figure 5: ROC curves obtained by four methods for human DNA
sequences.
Table 3: Short exon detection results for human DNA sequences.
Multiscale DWT
Simple addition Multifeature
FBLP de-noise
Number of
exons
detected
9/135 0/135 44/135 60/135
Detection
success rate
6.7% 0.0% 32.6% 44.4%
Table 4: Area under the ROC curve (AUC) for mouse DNA
sequences.
Multiscale DWT
Simple addition Multifeature
FBLP de-noise
AUC 0.62 0.63 0.65 0.66
We also tested our method on 7 short mouse
DNA sequences with NCBI accession numbers AB025024,
AB040292, AB052362, AF040759, AF068865, AF203031, and
AJ298076. The total length of the 7 Mouse sequence is
175298 bp. There are 112 exons among which 13 exons
are no longer than 70 bp. From Ta b l e 5 ,wecanseethat
at the optimal cutoff point, our method can obtain the
largest sensitivity value while multiscale FBLP can obtain the
largest specificity value. From Figure 6,itisobservedthat
for the same sensitivity value, our method obtains the best
specificity value. For the same specificity value, our method
produces the best sensitivity value. Our method produces the
largest AUC value as shown in Ta b l e 4 and has the best overall
performance.
0
0.1
0.2
0.3
0.4
0.5
Sensitivity
0.6
0.8
0.9
1
0.7
00.20.40.60.81
ROC curve for mouse DNA sequences
1-specificity
Multi-scale FBLP
Wavelet De-noise
Simple addition
Multi-feature
Figure 6: ROC curves obtained by four methods for mouse DNA
sequences.
Table 5: Sensitivity and specificity at optimal cutoff point for
mouse DNA sequences.
Multiscale DWT
Simple addition Multifeature
FBLP de-noise
Sensitivity 0.31 0.49 0.53 0.54
Specificity 0.89 0.70 0.71 0.71
Table 6: Short exon detection results for mouse DNA sequences.
Multiscale DWT
Simple addition Multifeature
FBLP de-noise
Number of
exons
detected
2/13 0/13 2/13 4/13
Detection
success rate
15.4% 0.0% 15.4% 30.8%
4. Conclusion
Short exon detection is difficult because the spectral com-
ponent of period three is very weak in the exon regions.
In this paper, we have proposed a multifeature spectral
analysis method to solve this problem. Four discrete signals
are obtained from a DNA sequence based on four structural
properties, the DNA-bending stiffness, disrupt energy, free
energy and propeller twist. All these signals contain the
1/3 frequency component. We apply the AR model-based
spectral analysis to the four signals by combining their linear
prediction matrices and performing SVD-based filtering to
reduce noise. Moving windows with different sizes are used
to overcome the nonstationarity of DNA sequences. The
exon detection results from multifeatures are better than the
combination of the detection results from the four features
separately. In addition, we have compared the results from
8 EURASIP Journal on Advances in Signal Processing
the proposed method with those obtained from multiscale
FBLP [16] and discrete wavelet transform denoise [18]
methods. Experiment results show that our method is
superior in short exon detection to the existing signal
processing-based techniques. Further increase in detection
accuracyispossibleifwecombinetheproposedmethodwith
supervised machine learning algorithms and string matching
based techniques.
Acknowledgment
This work is supported by a Grant from the Hong Kong
Research Grant Council (Project CityU 123809).
References
[1] J. D. Watson, T. A. Baker, S. P. Bell et al., “RNA splicing,” in
Molecular Biology of the Gene, chapter 13, Cold Spring Harbor
Laboratory Press, Cold Spring Harbor, NY, USA, 6th edition,
2008.
[2] C. Math
´
e,M F.Sagot,T.Schiex,andP.Rouz
´
e, “Current
methods of gene prediction, their strengths and weaknesses,”
Nucleic Acids Research, vol. 30, no. 19, pp. 4103–4117, 2002.
[3] J. D. Hawkins, “A survey on intron and exon lengths,” Nucleic
Acids Research, vol. 16, no. 21, pp. 9893–9908, 1988.
[4] J. W. Fickett, “Recognition of protein coding regions in DNA
sequences,” Nucleic Acids Research, vol. 10, no. 17, pp. 5303–
5318, 1982.
[5]X.Xie,S.Wu,K M.Lam,andH.Yan,“PromoterExplorer:
an effective promoter identification method based on the
AdaBoost algorithm,” Bioinformatics, vol. 22, no. 22, pp. 2722–
2728, 2006.
[6]S.Wu,X.Xie,A.W C.Liew,andH.Yan,“Eukaryotic
promoter prediction based on relative entropy and positional
information,” Physical Review E,vol.75,no.4,ArticleID
041908, 7 pages, 2007.
[7] R. Durbin, S. Eddy, A. Krogh, and G. Mitchison, Biological
Sequence A nalysis: Probabilistic Models of Proteins and Nucleic
Acids, Cambridge University Press, Cambridge, UK, 1998.
[8] J.V.Lorenzo-Ginori,A.Rodr
´
ıguez-Fuentes, R. G.
´
Abalo, and
R. S. Rodr
´
ıguez, “Digital signal processing in the analysis of
genomic sequences,” Current Bioinformatics,vol.4,no.1,pp.
28–40, 2009.
[9] S. Tiwari, S. Ramachandran, A. Bhattacharya, S. Bhattacharya,
and R. Ramaswamy, “Prediction of probable genes by Fourier
analysis of genomic sequences,” Computer Applications in the
Biosciences, vol. 13, no. 3, pp. 263–270, 1997.
[10] M. Akhtar, E. Ambikairajah, and J. Epps, “Optimizing period-
3 methods for eukaryotic gene prediction,” in Proceedings of
the IEEE International Conference on Acoustics, Speech and
Signal Processing (ICASSP ’08), pp. 621–624, 2008.
[11] P. P. Vaidyanathan and B J. Yoon, “Gene and exon prediction
using allpass-based filters,” in Pr oceedings of the IEEE Inter-
national Workshop on Genomic Signal Processing and Statistics
(GENSIPS ’02), Raleigh, NC, USA, October 2002.
[12] R. Rom
´
an-Rold
´
an, P. Bernaola-Galv
´
an, and J. L. Oliver,
“Sequence compositional complexity of DNA through an
entropic segmentation method,” Physical Review Letters,vol.
80, no. 6, pp. 1344–1347, 1998.
[13] D. Nicorici and J. Astola, “Segmentation of DNA into
coding and noncoding regions based on recursive entropic
segmentation and stop-codon statistics,” EURASIP Journal on
Applied Signal Processing, vol. 2004, no. 1, pp. 81–91, 2004.
[14] N. Chakravarthy, A. Spanias, L. D. Iasemidis, and K. Tsakalis,
“Autoregressive modeling and feature analysis of DNA
sequences,” EURASIP Journal on Applied Signal Processing,vol.
2004, no. 1, pp. 13–28, 2004.
[15] H. Yan and T. D. Pham, “Spectral estimation techniques
for DNA sequence and microarray data analysis,” Current
Bioinformatics, vol. 2, no. 2, pp. 145–156, 2007.
[16] M. K. Choong and H. Yan, “Multi-scale parametric spec-
tral analysis for exon detection in DNA sequences based
on forward-backward linear prediction and singular value
decomposition of the double-base curves,” Bioinformation,
vol. 2, no. 7, pp. 273–278, 2008.
[17] R. Jiang and H. Yan, “Studies of spectral properties of short
genes using the wavelet subspace Hilbert-Huang transform
(WSHHT),” Physica A, vol. 387, no. 16-17, pp. 4223–4247,
2008.
[18] T. P. George and T. Thomas, “Discrete wavelet transform de-
noising in eukaryotic gene splicing,” BMC Bioinformatics,vol.
11, supplement 1, article S50, 2010.
[19]Y.Wu,A.W C.Liew,H.Yan,andM.Yang,“DB-Curve:
a novel 2D method of DNA sequence visualization and
representation,” Chemical Physics Letters, vol. 367, no. 1-2, pp.
170–176, 2003.
[20] A. V. Sivolob and S. N. Khrapunov, “Translational positioning
of nucleosomes on DNA: the role of sequence-dependent
isotropic DNA bending stiffness,” Journal of Molecular Biology,
vol. 247, no. 5, pp. 918–931, 1995.
[21]K.Florquin,Y.Saeys,S.Degroeve,P.Rouz
´
e, and Y. Van de
Peer, “Large-scale structural analysis of the core promoter in
mammalian and plant genomes,” Nucleic Acids Research,vol.
33, no. 13, pp. 4255–4264, 2005.
[22] K. J. Breslauer, R. Frank, H. Blocker, and L. A. Marky,
“Predicting DNA duplex stability from the base sequence,”
Proceedings of the National Academy of Sciences of the United
States of America, vol. 83, no. 11, pp. 3746–3750, 1986.
[23] N. Sugimoto, S I. Nakano, M. Yoneyama, and K I. Honda,
“Improved thermodynamic parameters and helix initiation
factor to predict stability of DNA duplexes,” Nucleic Acids
Research, vol. 24, no. 22, pp. 4501–4505, 1996.
[24] M. A. El Hassan and C. R. Calladine, “Propeller-twisting of
base-pairs and the conformational mobility of dinucleotide
steps in DNA,” Journal of Molecular Biology, vol. 259, no. 1,
pp. 95–103, 1996.
[25] P. Yiou, D. Sornette, and M. Ghil, “Data-adaptive wavelets and
multi-scale singular-spectrum analysis,” Physica D, vol. 142,
no. 3-4, pp. 254–290, 2000.
[26] S. W. Lang and J. H. McClellan, “Frequency estimation with
maximum entropy spectral estimator,” IEEE Transactions on
Acoustics, Speech, and Signal Processing, vol. 28, no. 6, pp. 716–
724, 1980.
[27] W. J. Youden, “Index for rating diagnostic tests,” Cancer,vol.
3, no. 1, pp. 32–35, 1950.