Frontiers in Guided Wave Optics and Optoelectronics Part 4 potx
Bạn đang xem bản rút gọn của tài liệu. Xem và tải ngay bản đầy đủ của tài liệu tại đây (3.55 MB, 40 trang )
6
Bismuth-doped Silica Fiber Amplifier
Young-Seok Seo and Yasushi Fujimoto
Korea Atomic Energy Research Institute
Korea
1. Introduction
To accommodate rapidly increasing quantities of information and communication, optical
fiber transmission technology with high-speed high-capacity is demanded. The
development of an optical gain medium and fiber amplifiers to cover the 1250~1650 nm
region, which is the entire optical telecommunication windows of silica fiber, becomes an
important issue for ultra-wide broadband optical communication. Bismuth-doped glasses
exhibit a broadband luminescence in the near infrared region. Thus, they are potential gain
media for extending the spectral bandwidth of the current erbium-doped silica fiber
amplifiers. There are several reports on an infrared luminescence from bismuth-doped
glasses such as germanate, phosphate, borate et al. (Meng et al., 2005ab; Peng et al., 2005abc;
Suzuki & Ohishi, 2006). According to their research, bismuth-doped glasses are therefore
very promising for creating broadband amplifiers for fiber telecommunication lines and
tunable or femto-second lasers.
There are two useful wavelengths for optical communication. One is the 1550 nm, erbium-
doped fiber amplifiers (EDFAs) working wavelength, which has minimum losses. EDFA
developments within the third telecommunication window have contributed to the rapid
growth of wavelength division multiplexing (WDM) transmission systems. The L-band
(1570~1605 nm) of EDFA can be used in WDM systems in conjunction with C-band
(1530~1560 nm). However, efforts to use WDM techniques to exploit this capability have
been hampered by nonlinear fiber effects such as four-wave mixing. In addition, the
amplification bandwidth of silica-based EDFA is as small as ~70 nm (Yamada et al., 1998). A
broadband amplifier with a gain bandwidth of more than 70 nm was reported by the
integration of EDFA with thulium-doped fiber amplifiers or fiber Raman amplifiers (FRAs)
(Yamada et al., 1998).
The other useful wavelength (1300 nm) for optical communication is O-band, between 1260
and 1360 nm, which is the natural zero-dispersion region of silica glass fiber where the
temporal distortion of transferred optical pulses can be minimized. For example,
praseodymium-doped fluoride fiber amplifiers (PDFFAs) and FRAs have been successfully
used for 1300 nm amplification, but it also suffer from narrow bandwidth (~25 nm) in
operating wavelength and low efficiency (Miyajima et al., 1991; Whitley, 1995). In addition,
a PDFFA normally made from fluoride glass, which is very brittle and cannot be fusion
spliced to the silica glass fiber. An alternative core fiber material and fiber amplifier for 1300
nm amplification is expected.
Frontiers in Guided Wave Optics and Optoelectronics
106
High-average-power lasers are widely used for material processing, thin film fabrication
with ablation, generation of extreme ultraviolet light sources for lithography, and various
scientific research purposes. As there are so many applications of high-power lasers,
demand is growing rapidly for more powerful lasers; therefore, the requirements for
thermally resistant laser media are becoming tougher. Some of the absorption energy
created in a laser medium by excitation with flash lamps or laser diodes is extracted as an
output of laser energy, but most of the absorption energy generates heat accumulation in the
medium. This heat accumulation causes a thermal lensing effect and a thermal birefringence
in the medium; of course, the excess heat accumulation leads to destruction of the medium.
Therefore, laser media must be operated under strict conditions during excitation.
Silica glass is one of the most attractive materials for high-peak-power or high-average-
power lasers because it has favourable thermal and mechanical toughness, high optical
transmittance from the ultraviolet to the infrared regions, and a low nonlinear refractive
index compared to the other commercial laser glasses. These properties are indispensable to
the laser driver for inertial confinement fusion because phosphate laser glasses have such
weak thermal shock toughness that they cannot work at a high repetition rate (Fujimoto et
al., 1999).
Bismuth-doped silica glass (BiSG) is a new material that emits a broadband fluorescence
peak at around 1250 nm with a bandwidth over 300 nm. We suggested BiSG which can
complement the problems of the other optical amplifiers (Fujimoto & Nakatsuka, 2001;
2003). It is important to understand the optical properties of the BiSG for technological
applications such as optical fiber amplifier and fiber laser. It is well known that bismuth ions
contribute to increase the refractive index of the glass and give no specific absorption band
in the visible and near infrared region. However, BiSG has three excitation bands at 500, 700
and 800 nm showing the luminescent bands at 750, 1120 and 1250 nm respectively. Its 800
nm absorption band makes this material have a potential to be pumped by commercialized
powerful laser diodes. In addition, cw lasing has been obtained in the spectral region
between 1150 and 1300 nm in a bismuth-doped aluminosilicate glass fiber (Dianov et al.,
2005; Dvoyrin et al, 2006; 2007).
We previously reported a new infrared luminescent BiSG that had a possibility of being a
high-power laser material and a possibility of being an optical fiber amplifier. Also, we
achieved optical amplification in a BiSG and bismuth-doped silica fiber(BiDF) at 1310 nm
with 810-nm excitation. BiSG has many attractive features, which make it suitable as a core
fiber material of an optical fiber. The near-infrared spectral regions with a wide
luminescence in the range from 1000 ~ 1600 nm and a long lifetime of about 100~600 μs of
luminescence make such a fiber promising for the development of lasers and amplifiers.
In this chapter, we demonstrate an optical amplification at the 1260~1360 nm region (O-
band) in various BiSG and fiber. The optical amplification was observed at five different
wavelengths between 1260 and 1360 nm with 810 nm excitation. The optical gain profile is
similar to the fluorescence spectrum and the amplification bandwidth is greater than 75 nm
in the 1300 nm region. The laser diode pumped fiber amplifier at 1310 nm showed gain
characteristics with a 5.0, 8.0-cm length BiDF and a wide-band tuned amplification through
an over 100-nm bandwidth. We also report on a simultaneous amplification results for BiSG
and fiber at two different wavelengths in the 1300 nm region. Simultaneous amplification of
25 nm bandwidth in four different wavelength regions was obtained. This technique can be
useful for WDM optical amplifiers at the second telecommunications window.
Bismuth-doped Silica Fiber Amplifier
107
2. Optical amplification in a BiSG
2.1 Sample preparation and experimental setup
The sample compositions (mol %) of BiSG are shown in Table 1. In the case of sample A,
bismuth-oxide (Bi
2
O
3
; 99.9 %), aluminum-oxide (Al
2
O
3
; 99.99 %) and silica powder (SiO
2
;
99.8 %) were mixed and kneaded in a mortar. The mixture compound of Bi
2
O
3
: 1.0 mol %,
Al
2
O
3
: 7.0 mol %, and SiO
2
: 92 mol % was put in an alumina crucible and then melted at
1750 °C for 50 hour in the air atmosphere. In the case of sample B, lithium oxide (Li
2
O) was
added and the mixture was put in an alumina crucible and then melted at 1700 °C for 30
hours. The composition of the sample B was Bi
2
O
3
(1.0 mol %), Al
2
O
3
(7.0 mol %), SiO
2
(92-x
mol %) and Li
2
O: (x = 1, 5, and 10 mol %). The samples were cut in the pieces (0.5 cm × 0.5
cm × 0.24 cm) and optically polished. The color of the prepared samples was reddish brown
but transparent, with a transmittance of ~90 % at 1300 nm region.
Bi
2
O
3
Al
2
O
3
SiO
2
Li
2
O
Sample
(mol %) (mol %) (mol %) (mol %)
A 1 7 92
1 7 91 1
B 1 7 87 5
1 7 82 10
Table 1. Glass composition of bismuth-doped silica glass and added in lithium oxide, Li
2
O.
Fig. 1. The experimental setup for the optical amplification in a bismuth-doped silica glass.
The experimental setup for optical gain measurement is shown in Fig. 1. The 810 nm
semiconductor laser (Unique Mode: UM2500-50-15) was used as an excitation source.
Distributed feedback (DFB) semiconductor lasers (Mitsubishi Electric Corp.: FU-436SDF-
EW41Mxx) with five different wavelengths were used as probe beams. The wavelengths of
the five DFB semiconductor lasers were 1272.5, 1297.6, 1307.5, 1322.8 and 1347.4 nm, and
these probe beams can be adjusted using a single laser driver. The probe laser beams were
combined with the excitation beam using an optical coupler (OFR: 810/1310 nm), and then
focused into the multi-mode fiber (MMF) with an output focusing lens (focuser). The
Frontiers in Guided Wave Optics and Optoelectronics
108
combined beam was focused into the BiSG sample surface by the focuser and the probe
beam was detected by an optical spectrum analyzer (Ando: AQ6317B) using a pigtail
focuser. The excitation beam is manually chopped to make the state of a probe beam
without excitation I
0
and a probe beam with excitation I. The optical gain coefficient was
defined as g = (1/l ) ln (I/I
0
), where l is the length of the BiSG sample.
The transmittance and the fluorescence spectra were measured using U-4100 spectrometer
(Hitachi Ltd.) and SS-25 spectrometer (JASCO Corp.) with 150 W Xe lamp excitation. The
transmittance of the new sample in the region of 1000 to 2500 nm was 90 % at maximum,
which is higher than previous result (Fujimoto & Nakatsuka, 2001). The fluorescence spectra
of BiSG samples with 800 nm excitation have a peak at ~1250 nm and the broad emission
with a FWHM of ~300 nm. The strong absorption at 300 nm is considered to be the
absorption edge of the Bi
2
O
3
-containing glass system (Sugimoto et al, 1996). However, we
could not find any luminescence derived from previously reported Bi
3+
luminescence and
the infrared emission was hardly observed from the sample without aluminum (Parke &
Webb, 1973; Weber & Monchamp, 1973).
2.2 Gain characteristics of the bulk-type BiSG
Fig. 2. Optical gain profiles of each sample at thickness 0.24cm.
We have measured the gain characteristics of the BiSG samples over a useful part of the 1300
nm optical communication window. The probe beam (1307.5 nm) and the excitation beam
(810 nm) were focused onto the sample surface. Between the two MMF pigtail focuser, we
measured amplified signals in BiSG samples with the maximum launched pump power (1.0
W) at 810 nm. Figure 2 shows the optical gain profile of two samples at 1307.5 nm. The
optical gain increases linearly with excitation power up to 1.0 W. In the case of sample A,
the maximum optical gain and the gain coefficient was 1.16 and 0.62 cm
-1
, respectively. The
absorbed energy was calculated as 42 % of excitation power, which is 0.42 W at 1.0 W
excitation for a 0.24 cm thick sample. If the excitation length such as fiber core material
becomes longer, the absorption will increase then the gain will be larger than that is
demonstrated in this experiment. In the case of sample B, the maximum optical gain and the
gain coefficient was 1.08 and 0.32 cm
-1
, respectively.
Bismuth-doped Silica Fiber Amplifier
109
The spectral dependence of the optical gain is important if optical fiber amplifier is to be
incorporated in broadband WDM system. As shown in Fig. 3, the measured spectral
dependence of the optical gain shows a close resemblance to the fluorescence spectrum, as
shown by the dotted line. The optical gain was observed at five wavelengths, 1272.5, 1297.6,
1307.5, 1322.8 and 1347.4 nm. The optical gain spreads widely between 1260 and 1360 nm. A
maximum optical gain and gain coefficient was 1.18 and 0.70 cm
-1
respectively at the 1272.5
nm wavelength region, which is closed to the peak wavelength of the fluorescence
spectrum. Moreover, the broad fluorescence spectrum suggests that optical gain in excess of
1.09 (0.35 cm
-1
) should be available over a bandwidth as large as ~75nm (Seo et al., 2006a).
Fig. 3. Optical gain as a function of different signal wavelength 1272.5, 1297.6, 1307.5, 1322.8
and 1347.4 nm. Points and curve represents experimental measurements and fluorescence
spectrum at 800 nm excitation, respectively.
3. Optical amplification in a 6.5-cm-long BiSG
3.1 Sample preparation and experimental setup
The composition of this sample was Bi
2
O
3
(1.0 mol %), Al
2
O
3
(7.0 mol %), and SiO
2
(92.0 mol
%). The BiSG can be drawn by pulling the melted material upward using an alumina bar. The
fabricated sample was cut in the same shape of 6.5-cm-long with an elliptical cross section (250
× 450 µm). The BiSG was optically polished at both ends to provide good optical transmission.
The experimental setup for optical amplification in a BiSG is shown in Fig. 4. For the probe
beam, a 1308 nm distributed feedback (DFB) semiconductor laser (Afonics: FXP0034, peak at
1308 nm) and four DFB semiconductor lasers (Mitsubishi Electric Corp.: FU-436SDF-
EW41Mxx) with different wavelengths 1272.5, 1297.6, 1322.8, and 1347.4 nm respectively,
were combined using a singlemode fiber (SMF) WDM coupler. And the probe beams can be
adjusted using a single driver. The DFB semiconductor laser of 1308 nm was used as the
anchor wavelength. The probe laser beam was combined with the excitation beam in the
optical coupler (OFR: 810/1310 nm) and then focused into the MMF with an output focusing
lens (focuser). The combined beam was focused into the BiSG sample by the focuser, and the
gained probe beam was detected by an optical spectrum analyzer (Ando: AQ6317B) using
another pigtail focuser.
Frontiers in Guided Wave Optics and Optoelectronics
110
Fig. 4. Experimental setup for optical amplification in a 6.5-cm-long bismuth-doped silica
glass
3.2 Gain characteristics of the rod-type BiSG
We measured the gain characteristics of the BiSG at 1300 nm optical communication
window. By pigtail focuser, the probe beam (1308 nm) and excitation beam (810 nm) were
focused onto the sample surface. The maximum optical gain was calculated to be 4.79 (6.80
dB) and therefore, gain coefficient g was 0.24 cm
-1
. The optical gain increases linearly with
excitation power up to 360 mW. The measured signal input/output power for BiSG was -8.3
dBm / -1.5 dBm (@ 1308 nm), exhibiting much lower power conversion efficiency. The
optical gain in the previous result with a bulk-type BiSG was 1.19 with excitation power of
2.0 W, though the sample thickness was 0.26 cm (Fujimoto & Nakatsuka, 2003). Because the
optical gain coefficient of bulk sample was 0.13 cm
-1
at 360 mW excitation power, the fiber
shape clearly affects the gain increment due to beam mode matching between the pump and
the probe. If the excitation length is longer, absorption power will increase greatly, and then
the gain will be larger than that demonstrated in this experiment.
Between the two MMF pigtail focusers, we measured optical amplification in the BiSG with
a threshold of 360 mW launched pump power at 810 nm. Figure 5 shows simultaneous
amplification at two wavelengths near 1300 nm second telecommunication window. The
wavelength of the excitation beam was 810 nm, and the sample length was 6.5 cm. The
probe wavelengths to measure the simultaneous amplification in the BiSG sample were
adjustable wavelengths (1272.5 nm, 1297.7 nm, 1322.8 nm and 1347.4 nm) and anchor
wavelength (1308 nm). For the four cases of amplification experiments, the maximum
optical gain at these wavelengths were 3.30 (5.19 dB), 3.18 (5.02 dB), 3.05 (4.84 dB) and 2.87
(4.58 dB) respectively and 3.12 (4.94 dB) at the anchor wavelength was obtained. The optical
gain shown in simultaneous measurements of two wavelengths suggests that it is possible
to realize WDM optical fiber amplifiers in O-band (1260~1360 nm) by using this gain
material.
The spectral dependence of optical gain is an important consideration if a fiber amplifier is
to be incorporated in a broadband WDM system. As shown in Fig. 6, the measured spectral
dependence of the optical gain coefficient appears to closely resemble the fluorescence
Bismuth-doped Silica Fiber Amplifier
111
Fig. 5. Simultaneously optical amplification properties at two wavelengths of 1300 nm
range: (a) 1308 nm and 1272.5 nm; (b) 1308 nm and 1297.6 nm; (c) 1308 nm and 1322.8 nm;
and (d) 1308 nm and 1347.4 nm.
Fig. 6. Optical gain coefficient as a function of different signal wavelengths: 1272.5, 1297.6,
1308.0, 1322.8 and 1347.4 nm. Points and curve represent experimental measurements and
fluorescence spectrum at 800 nm excitation, respectively.
Frontiers in Guided Wave Optics and Optoelectronics
112
spectrum, as represented by a dotted line. The optical gain spread widely from 1250 to 1360
nm. The maximum optical gain was obtained at 1272.5 nm. This wavelength is close to the
peak wavelength of the fluorescence spectra. Moreover, broad fluorescence spectrum
suggests that optical gain coefficient exceeding 0.165 cm
-1
should be available over a
bandwidth as large as 75 nm (Seo et al., 2006b).
4. Optical amplification in a multi-mode BiDF
4.1 Sample preparation and experimental setup
BiDF sample was fabricated by modified rod-in-tube method. The mixture compound of
this sample was Bi
2
O
3
: 1.0 mol %, Al
2
O
3
: 7.0 mol %, and SiO
2
: 92 mol %. Glass core was
inserted into a tube of glass cladding to form a preform, which was drawn by heating in the
drawing furnace. The fiber with refractive index difference, Δn~0.017, was drawn from the
perform. The 8.0 cm long sample was optically polished at both ends to provide good
optical transmission. Its core diameter and outer diameter was 13 μm and 230 μm,
respectively.
Fig. 7. Schematic diagram for optical gain measurement in bismuth-doped silica fiber.
The experimental setup for optical gain measurement in BiDF is shown in Fig. 7. An 810-nm
CW laser diode was used as the pump source. A 1308 nm distributed feedback (DFB) laser
diode and two laser diodes with different wavelengths were used as probe beam. The
wavelengths of the two laser diodes were 1297 nm and 1323 nm, respectively, and these
probe beams can be adjusted using a single driver. The probe laser beam was combined
with the excitation beam in the optical coupler (OFR 810/1310 nm), and focused on an end
of the fiber by an objective lens. The amplified probe signal was observed with an optical
spectrum analyzer, and an optical low path filter cut out the unused pump light.
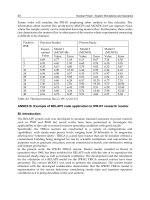
4.2 Gain characteristics of the multi-mode BiDF
Glass core was the optical amplification in an 8.0 cm long BiDF sample at single wavelength,
1308 nm, is shown in Fig. 8. The maximum optical gain was calculated to be 3.76 (5.8 dB)
and therefore, gain coefficient was 0.038 dB/mW. The optical gain increased linearly with
Bismuth-doped Silica Fiber Amplifier
113
Fig. 8. Optical gain profile of an 8.0 cm long bismuth-doped silica fiber.
Fig. 9. Simultaneous optical amplification properties at two wavelengths of 1300-nm range:
(a) 1308 nm and 1297 nm; (b) 1308 nm and 1323 nm.
excitation power up to 152 mW. The measured signal input/output power for BiDF was -29
dBm / -23 dBm (@ 1308 nm), exhibiting much lower power conversion efficiency. The
optical gain in the previous result with a bulk-type BiSG was 1.16 with excitation power of
1.0 W, though the sample thickness was 0.24 cm. Because the specific gain coefficient of the
bulk sample was 0.62 cm
-1
/W, the fiber shape affects the gain increment due to beam mode
matching between the pump and the probe.
Figure 9 shows simultaneous amplification at two wavelengths near the 1300 nm region.
The signal wavelengths to measure the simultaneous amplification in the BiDF were
adjustable wavelengths (1297 and 1323 nm) and anchor wavelength (1308 nm). For the two
cases of amplification experiments, the maximum gain coefficients at the adjustable
wavelengths (0.046 and 0.036 cm
-1
) and the anchor wavelength (0.036 and 0.034 cm
-1
) were
obtained. The optical gain shown in simultaneous measurements of two wavelengths
suggests that it is possible to realize WDM optical fiber amplifiers in O-band (1260~1360
nm). Performance of fiber amplifier largely depends on the fiber specification. Optical gain
Frontiers in Guided Wave Optics and Optoelectronics
114
in this experiment was much smaller than that for EDF or PDFFA. The smaller core cross
section gives promising potential to the practical gain performance. The gain characteristics
will be further improved by optimizing the fiber structure, such as a partially doped core
structure and deformed shape of first clad layer for efficient pumping (Seo et al., 2007a).
5. Optical amplification in a single-mode BiDF
5.1 Sample preparation and experimental setup
Fig. 10. Schematic diagram for the optical gain measurement of a bismuth-doped silica fiber.
BiDF with a refractive index difference, Δn~0.017, was drawn from the preform. Its core
diameter and outer diameter was 1.54 μm and 125 μm, respectively. The experimental setup
for the optical gain measurement in the BiDF is shown in Fig. 10. An 810-nm cw laser diode
was used as a pump source. A 1310 nm distributed feedback (DFB) laser diode and four
laser diodes with different wavelengths were used as a probe beam. The wavelengths of the
four DFB laser diodes were 1272, 1297, 1323 and 1347 nm, and these probe beams can be
adjusted by using a single laser driver. The probe laser beams were combined with an
excitation beam using a WDM coupler (810/1310 nm). BiDF was fusion spliced (FSM-40PM,
Fujikura) to output coupler with a SMF. The combined beam goes through into the BiDF,
and the gained probe beam was detected by an optical spectrum analyzer (Ando: AQ6317B).
5.2 Gain characteristics of the single-mode BiDF
The optical amplification in a 5.0-cm long BiDF sample at a single wavelength, 1310 nm, is
shown in Fig. 11. The maximum optical gain was calculated to be 9.6 dB and therefore, the
gain coefficient was 0.442 cm
-1
. The optical gain increased linearly with an excitation power
up to 100 mW. The measured signal input/output power for the BiDF was -30.0 dBm / -20.4
dBm (@ 1310 nm), exhibiting a much lower power conversion efficiency. The optical gain in
the previous result with a bulk-type BiSG was 1.16 with an excitation power of 1.0 W,
though the sample thickness was 0.24 cm (Seo et al, 2005; 2006a). Because the specific gain
coefficient of the bulk sample was 0.62 cm
-1
/W, the fiber shape clearly affects the gain
increment due to a beam mode matching between the pump and the probe. If the excitation
Bismuth-doped Silica Fiber Amplifier
115
length is longer, absorption power will increase greatly, and then the gain will be larger
than that demonstrated in this experiment.
Fig. 11. Optical gain profile of the bismuth-doped silica fiber at a length of 5.0 cm.
Figure 12 shows a simultaneous amplification at two wavelengths near the 1300 nm region.
The wavelength of the excitation beam was 810 nm, and the sample length was 5.0-cm. The
signal wavelengths to measure the simultaneous amplification in the BiDF were adjustable
wavelengths (1297 nm and 1323 nm) and an anchor wavelength (1310 nm). For the two cases
of amplification experiments, the maximum optical gain at these wavelengths were 7.99 dB
and 7.17 dB respectively and 8.69 dB at the anchor wavelength was obtained. The optical
gain shown from the simultaneous measurements of two wavelengths suggests that it is
possible to realize WDM optical fiber amplifiers in the O-band (1260~1360 nm). One of the
most fundamental parameters, the pump efficiency is defined as the net gain per unit pump
power. Net gain is obtained for over a 100-mW pump power. The pump efficiency is 0.095
dB/mW (Seo et al., 2007b).
Fig. 12. Simultaneous optical amplification properties at two wavelengths of the 1300-nm
range: (a) 1310 nm and 1297 nm; (b) 1310 nm and 1323 nm.
Frontiers in Guided Wave Optics and Optoelectronics
116
6. Conclusion
The BiSG can complement other optical fiber amplifiers by solving such problems as fusion
splicing and wideband amplification. Understanding the optical properties of BiSG is
important due to its potential technological applications in optical fiber amplifiers and fiber
lasers. The spectroscopic properties of the investigated BiSG are different from those of the
previously reported luminescence from Bi
3+
ions ((Parke & Webb, 1973; Weber &
Monchamp, 1973). The peaks of absorption and emission spectra of BiSG exist in the visible
and infrared regions, respectively. The absorption cross section of the
1
S
0
→
3
P
1
allowed
transition for Bi
3+
ions was estimated to be 2.4×10
-17
cm
2
; that for bismuth ions of BiSG is
1.2×10
-20
cm
2
at best. The Stokes shift between absorption and emission in a BiSG sample is
much larger than rare earth ions. Because of the large Stokes shift, population inversion can
be realized, and optical amplification occurs via the stimulated emission process.
The origin of light emission in a BiSG, which is still unclear, is the valence electrons of the
bismuth ions. We are considering more important reasons why aluminum ions are needed
to generate BiSG luminescence. Aluminum ions are needed to generate BiSG luminescence.
Aluminum is expected to have a special role in the formation of Bi luminescent center.
Therefore, discovering the aluminum status in BiSG, especially the aluminum coordination
state, will help us understand the unknown luminescent center. Aluminum coordination
state can be investigated by using
27
Al-NMR and XAFS. Co-doping of Al and Bi is
indispensable for the broadband infrared luminescence of BiSG. The aluminum ion has to
roles in BiSG: assisting the configuration of the peculiar luminescent center of Bi ion with
some coupling effect, and increasing compatibility with the silica network (Fujimoto &
Nakatsuka, 2006; Ohkura et al., 2007).
There are many attractive characteristics of BiSG for a laser application, such as, a long
emission lifetime (over 600 μs) and a high absorption cross-section which enable an effective
pumping and a short pulse generation. It is important to measure the quantum yield,
because the performance of a laser amplification and oscillation is very sensitive for the
quantum yield. The quantum yield is defined as the rate of the emitted photon number to
the absorbed photon number. The quantum efficiency of the BiSG was measured as 60-70 %
(Fujimoto et al, 1999).
BiSG has many attractive features that make it suitable for use in an optical fiber amplifier.
First, because BiSG is a silica-based material, it can be transformed to an optical fiber and
easily fusion connected to the silica fibers of a network system. Second, the peak wavelength
is at 1250 nm, and the bandwidth is 300 nm of FWHM, which is five or six times wider than
erbium-doped silica fibers. Third, as the simultaneous amplifying signals near the 1300 nm
region (~75 nm), BiSG fiber amplifier is considered a more effective solution for WDM
broadband systems. Fourth, a common commercial semiconductor laser (~808 nm) can be
used for excitation of this medium. As discussed above, BiSG is a promising candidate for
the core fiber material of an optical amplifier at a natural zero-dispersion wavelength, 1300
nm, of silica glass fiber (Fujimoto & Nakatsuka, 2001; 2003).
In conclusion, we have demonstrated optical amplification in a bismuth-doped silica glass
and BiDF at second telecommunication window. The amplification was obtained at five
different wavelength and the amplification bandwidth is greater than 75 nm (1272.4 ~ 1347.4
nm) in a 0.24 cm BiSG. And we demonstrated simultaneous optical amplification at two
wavelengths of the 1300 nm region in a BiSG. Simultaneous amplification was obtained at
four different wavelengths, and the amplification bandwidth was greater than 75 nm. This
Bismuth-doped Silica Fiber Amplifier
117
technique can be useful for WDM optical amplifiers at 1300 nm second telecommunication
windows. Therefore, this gain medium is expected to be useful for applications in ultrawide
broadband optical communication.
Also we reported optical amplification in a BiDF. The optical gain obtained in an 8.0-cm-
long multi-mode BiDF at 1308 nm with 810-nm excitation and discussed simultaneous
amplification at two wavelengths of the 1300 nm region. And we have demonstrated on the
optical amplification phenomenon in a 5.0-cm-long single-mode BiDF at 1310 nm and
discussed a simultaneous amplification at two wavelengths of the 1300 nm region. These
spectroscopic characteristics and the amplification observed at the 1300 nm range have
shown that such fibers are good candidates for cw and pulsed fiber lasers and fiber
amplifiers for a spectral range of 1100~1400 nm.
7. References
Dianov, E. M.; Dvoyrin, V. V.; Mashinsky, V. M.; Umnikov, A. A.; Yashkov, M. V. &
Guryanov, A. N. (2005). CW bismuth fibre laser, Quantum Electronics, Vol. 35, 1083-
1084, ISSN 1063-7818
Dvoyrin, V. V.; Mashinsky, V. M.; Bulatov, L. I.; Bufetov, I. A.; Shubin, A. V.; Melkumov, M.
A.; Kustov, E. F.; Dianov, E. M.; Umnikov, A. A.; Khopin, V. F.; Yashkov, M. V. &
Guryanov, A. N. (2006). Bismuth-doped-glass optical fibers—a new active medium
for lasers and amplifiers, Opt. Lett., Vol. 31, No. 20, 2966-2968. ISSN 0146-9592
Dvoyrin, V. V.; Mashinsky, V. M. & Dianov, E. M. (2007). Yb-Bi pulsed fiber lasers, Opt. Lett.,
Vol. 32, No. 5, 451-453, ISSN 0146-9592
Fujimoto, Y.; Murata, K. & Nakatsuka M. (1999). New material for high average power laser
based on silica glass, Fusion Eng. Des., Vol. 44, 431-435, ISSN 0920-3796
Fujimoto, Y. & Nakatsuka, M. (2001). Infrared luminescence from bismuth-doped silica
glass, Jpn. J. Appl. Phys., Vol. 40, No. 3B, L279-L281, ISSN 0021-4922
Fujimoto, Y. & Nakatsuka, M. (2003). Optical amplification in bismuth-doped silica glass,
Appl. Phys. Lett., Vol. 82 No. 19, 3325-3326, ISSN 0003-6951
Fujimoto, Y. & Nakatsuka, M. (2006).
27
Al NMR structural study on aluminum coordination
state in bismuth doped silica glass, J. Non-Cryst. Solids, Vol. 352, 2254-2258, ISSN
0022-3093
Meng, X.; Qui, J.; Peng, M.; Chen, D.; Zhao, Q.; Jiang, X. & Zhu, C. (2005). Infrared
broadband emission of bismuth-doped barium-aluminum-borate glasses, Opt.
Express, Vol. 13, No. 5, 1635-1642, ISSN 1094-4087
Meng, X.; Qui, J.; Peng, M.; Chen, D.; Zhao, Q.; Jiang, X. & Zhu, C. (2005). Near infrared
broadband emission of bismuth-doped aluminophosphate glass, Opt. Express, Vol.
13, No. 5, 1628-1634, ISSN 1094-4087
Miyajima, Y.; Sugawa, T. & Fukasaku, Y. (1991). 38.2dB amplification at 1.31 µm and
possibility of 0.98 µm pumping in Pr
3+
-doped fluoride fibre, Electron. Lett., Vol. 27,
No. 19, 1706-1707, ISSN 0013-5194
Ohkura, T.; Fujimoto, Y.; Nakatsuka, M. & Seo, Y. (2007). Local structures of bismuth ion in
bismuth-doped silica glasses analyzed using Bi LIII X-ray absorption fine structure,
J. Am. Ceram. Soc., Vol. 90, No. 11, 3596-3600, ISSN 0002-7820
Parke, S. & Webb, R. S. (1973). The optical properties of thallium, lead and bismuth in oxide
glasses, J. Phys. Chem. Solids, Vol. 34, 85-95, ISSN 0022-3697
Frontiers in Guided Wave Optics and Optoelectronics
118
Peng, M.; Qiu, J.; Chen, D.; Meng, X.; Yang, I.; Jiang, X. & Zhu, C. (2004). Bismuth- and
aluminum-codoped germanium oxide glasses for super-broadband optical
amplification, Opt. Lett., Vol. 29, No. 17, 1998-2000, ISSN 0146-9592
Peng, M.; Qiu, J.; Chen, D.; Meng, X. & Zhu, C. (2005). Broadband infrared luminescence
from Li
2
O-Al
2
O
3
-ZnO-SiO
2
glasses doped with Bi
2
O
3
, Opt. Express, Vo. 13, No. 18,
6892-6898, ISSN 1094-4087
Peng, M.; Qiu, J.; Chen, D.; Meng, X. & Zhu, C. (2005). Superbroadband 1310 nm emission
from bismuth and tantalum codoped germanium oxide glasses, Opt. Lett., Vol. 30,
2433-2435, ISSN 0146-9592
Peng, M.; Wang, C.; Chen, D.; Jiang, X. & Zhu, C. (2005). Investigations on bismuth and
aluminum co-doped germanium oxide glasses for ultra-broadband optical
amplification, J. Non-Cryst. Solids, Vol. 351, 2388-2393, ISSN 0022-3093
Seo, Y.; Fujimoto, Y. & Nakatsuka, M. (2005). Amplification in a bismuth-doped silica glass
at second telecommunication windows, Conference on Lasers and Electro-Optics,
CThR6, ISBN 1-55752-7709, 22-27 May 2005, Baltimore, Maryland, U.S.A., Optical
Society of America
Seo, Y.; Fujimoto, Y. & Nakatsuka, M. (2006). Optical amplification in a bismuth-doped silica
glass at 1300 nm telecommunications window, Opt. Commun., Vol. 266, No. 1, 169-
171, ISSN 0030-4018
Seo, Y.; Fujimoto, Y. & Nakatsuka, M. (2006). Simultaneous amplification at two
wavelengths near 1300 nm in a 6.5-cm-long bismuth-doped silica glass, IEEE
Photon. Technol. Lett., Vol. 18, No. 18, 1901-1903, ISSN 1041-1135
Seo, Y.; Lim, C.; Fujimoto, Y. & Nakatsuka, M. (2007). 9.6 dB Gain at a 1310 nm Wavelength
for a Bismuth-doped Fiber Amplifier, Journal of the Optical Society of Korea, Vol. 11,
No. 2, 63-66, ISSN 1226-4776
Seo, Y.; Lim, C.; Fujimoto, Y. & Nakatsuka, M. (2007). Bismuth-doped silica glass as a new
laser material, J. Korean Phys. Soc., Vol. 51, No. 1, 364-367, ISSN 0374-4884
Sugimoto, N.; Kanbara, H.; Fujiwara, S.; Tanaka, K. & Hirao, K. (1996). Ultrafast response of
third-order optical nonlinearity in glasses containing Bi
2
O
3
, Opt. lett., Vol. 21, No.
20, 1637-1639, ISSN 0146-9592
Suzuki, T. & Ohishi, Y. (2006). Ultrabroadband near-infrared emission from Bi-doped Li
2
O–
Al
2
O
3
–SiO
2
glass, Appl. Phys. Lett., Vol. 88, 191912-1-191912-3, ISSN 0003-6951
Weber, M. J. & Monchamp, R. R. (1973). Luminescence of Bi
4
Ge
3
O
12
: Spectral and decay
properties, J. Appl. Phys., Vol. 44, No. 12, 5495-5499, ISSN 1066-7814
Whitley, T. J. (1995). A review of recent system demonstrations incorporating 1.3-µm
praseodymium-doped fluoride fiber amplifiers, J. Lightwave Technol., Vol. 13, No. 5,
744-760, ISSN 0733-8724
Yamada, M.; Mori, A.; Kobayashi, K.; Ono, H.; Kanamori, T.; Oikawa, K.; Nishida, Y. &
Ohishi, Y. (1998). Gain-Flattened Tellurite-Based EDFA with a Flat Amplification
Bandwidth of 76 nm, IEEE photon. Technol. Lett., Vol. 10, No. 9, 1244-1246, ISSN
1041-1135
Yamada, M.; Ono, H. & Ohishi, H. (1998). Low-noise, broadband Er
3+
-doped silica fibre
amplifiers, Electron. Lett., Vol. 34, No. 15, 1490-1491, ISSN 0013-5194
7
Radio-over-Fibre Techniques and Performance
Roberto Llorente and Marta Beltrán
Universidad Politécnica de Valencia
Spain
1. Introduction
Radio-over-fibre (RoF) techniques have been subject of research during the last decades and
find application in optical signal processing (photonic analogue-to-digital converters,
photonic-microwave filters, arbitrary waveform generation), antenna array beamforming,
millimetre-wave and THz generation systems, or photonic up- and down-converting links
for applications such as broadband wireless access networks, electronic warfare and
RADAR processing, imaging and spectroscopy or radio-astronomy (Seeds & Williams, 2006;
Capmany & Novak, 2007). In these applications a radio signal typically in the millimetre-
wave band is transmitted through optical fibre employing laser sources and electro-optical
devices.
The use of optical fibre links to distribute telecommunication standards is the more
successful application of RoF technology, usually known as hybrid fibre-radio (HFR)
networks (Jager & Stohr, 2001). HFR networks have been deployed in the last decade due to
the increasing demand of high-bitrate communication services in today’s access network.
This demand is based on the steady market introduction of services requiring the
transmission of massive data quantities, like high-definition movie distribution, on-line
gaming and rich Internet experience by example (Merill Lynch, 2007).
The HFR concept applied to the enhancements of community antenna television (CATV)
networks reflected in the so-called hybrid-fibre coax (HFC) network, in which a combination
of digital and analogue channels is distributed from a central location to many users
distributed geographically (Darcie & Bodeep, 1990; Wilson et al., 1995). In HFC networks the
last mile connection is provided through coaxial cable whilst in HFR networks the last mile
connection is always a wireless link. This is not a minor difference, as the wireless
environment is much more hostile than cable imposing restrictive RoF link performance
requirements in terms of linearity, noise and power handling capabilities, key parameters to
guarantee a spurious free dynamic range (SFDR) for the whole link high enough to cope
with geographical dispersion of users and complex modulation formats used by current
wireless standards. A simplified schematic of a HFR network is shown in Fig. 1.
RoF technology allows centralising the required RF signal processing functions in one
shared location (Central Office, CO) and then to use optical fibre to distribute the RF signals
to the remote access units (RAU). This allows important cost savings as the RAUs can be
simplified significantly, as they only need to perform optoelectronic conversion and filtering
and amplification functions. It is possible to use wavelength multiplexing techniques
(WDM) in order to increase capacity and to implement advanced network features such as
Frontiers in Guided Wave Optics and Optoelectronics
120
dynamic allocation of resources. This centralised and simplified RAU scheme allows lower
cost system operation and maintenance, which are reflected into major system OPEX
savings, especially in broadband wireless communication systems where a high density of
RAUs is necessary.
Core
Network
Optical Fibre
Central
Office
WDM
coupler
BS
∙∙∙
Residence
Building
Wireless
users
WiMAX, UWB,
UWB
WiMAX
Radio
Transmitter
LD
Ext. E/O
Radio
Transmitter
O/E
Amp
Splitter
1xN
Hub
LD
RAU
RAU
RAU
BPF
Fig. 1. Simplified schematic of a RoF system. LD: Laser diode. BS: Base Station. RAU:
Remote Access Unit. BPF: Band-pass filter. Amp: Electrical amplifier.
The CO and the RAU perform electro-optical (E/O) and opto-electronic (O/E) conversion of
wireless signals respectively. E/O conversion is achieved employing either directly
modulated laser sources or external electro-optic modulators. O/E conversion is done
employing photodetectors or photoreceivers (Seeds & Williams, 2006). Regarding the RF
transport, when the signal is transported directly at the frequency of operation there are
benefits regarding cost, complexity and upgradeability, as there is no need for complex RF
signal processing at the RAU involving up/down conversion or base-band mux/demux
(Capmany & Novak, 2007; Jager & Stohr, 2001).
RoF techniques and complete transmission systems have been demonstrated for frequencies
up to 120 GHz (Hirata et al., 2003). As mentioned before, the most successful application of
RoF technologies has been the transmission of wireless standards over optical fibre links in
centralized architectures, also known as distributed antenna systems (DAS) for both indoor
and outdoor applications. The broad bandwidth of the optical fibre facilitates standard-
independent multiservice operation for cellular systems, such as GSM (Owaga et al., 1992),
UMTS (Persson et al., 2006), wireless LAN (WiFi 802.11 a/b/g/n) (Chia et al., 2003; Niiho et
al., 2004; Nkansah et al., 2006) and also for emerging technologies WiMAX (Pfrommer et al.,
2006) and Ultra-wideband (UWB) (Llorente et al., 2007). Available commercial systems
however are typically limited to frequency ranges between 800-2500 MHz. Demonstrations
of such DAS systems include their deployment to provide uniform wireless coverage in
important sportive events such as the 2000 Olympic games and 2006 world cup (Rivas &
Lopes, 1998; Cassini & Faccin, 2003). For indoor applications where picocell configurations
Radio-over-Fibre Techniques and Performance
121
are envisaged, advanced multi-function devices such as waveguide electro-absorption
modulator (Wake et al., 1997) or polarization independent asymmetric Fabry-Perot
modulators (Liu et al., 2003; Liu et al., 2007) are used as detector/modulator.
Two key factors limiting the overall transmission performance in RoF systems are the
optical source and the electro-optic modulation technique employed. Regarding the laser
source, at frequencies used for major wireless standards (GSM, WiFi 802.11 a/b/g, UMTS)
and also WiMAX up to 5-6 GHz, directly modulated semiconductor lasers are preferred due
to lower cost (Qian et al., 2005). For higher frequencies, the required performances can be
satisfied only by externally modulated transmitters. Devices with bandwidth handling
capabilities in excess of these required by near-term WIMAX deployments, in particular
distributed feedback (DFB) lasers offering the required bandwidth and performances, exist
commercially, but normally at a high cost taking into account the number of devices
required for typical applications. Recently, a lot of research efforts have been devoted to the
development of low-cost/high-performance transmitters, for instance uncooled lasers
(Ingham et al., 2003; Hartmann et al., 2003) or vertical-cavity surface-emitting lasers
(VCSEL) (Persson et al., 2006; Chia et al., 2003). Probably, the most restrictive requirement
for wireless services provision over RoF systems is the SFDR. Nowadays SFDRs in excess of
100 dB·Hz
2/3
have been demonstrated experimentally, providing enough dynamic range to
be employed in real applications (Seeds & Williams, 2006).
2. Ultra-wideband radio-over-fibre
2.1 Optical generation
The basic elements of RoF systems are broadband laser sources either employing direct or
external modulation, a suitable transmission media such as multi-mode fibre (MMF), single-
mode fibre (SMF) or plastic optical fibre (POF), and broadband photodetectors or
photoreceivers (Seeds & Williams, 2006; Capmany & Novak, 2007; Dagli, 1999). The laser
source and modulation method is the key element in the performance of RoF applications.
The generation of the optical signal to be transmitted in the RoF system is of special
difficulty in the case of UWB signals. UWB is a radio technology intended for cable
replacement in home applications within a range of tens of meters (picocell range), with
high-definition video and audio communications a potential application (Duan et al., 2006).
UWB is also attractive in many other applications including medicine, sensor networks, etc.
UWB radio offers: High data rate capability (>1 Gbit/s), low radiated power spectral density
(PSD) minimising the interference, low-cost equipment commercially available. UWB is
available in two main implementations: Multi-band orthogonal frequency-division
multiplexing (MB-OFDM) and impulse radio. The ECMA standard (ECMA-368, 2007) uses
MB-OFDM in 528 MHz individual sub-bands, whilst the impulse-radio implementation
employs short pulses (in the range of hundreds of picoseconds) modulated in amplitude,
time, polarity or shape to fill a desired bandwidth. MB-OFDM generally shows superior
performance to the impulse-radio approach in terms of multi-path fading and intersymbol
interference (ISI) tolerance, whilst impulse-radio is able to provide simultaneously
communications, localization and ranging to a sub-centimetre resolution.
Currently, UWB uses the unlicensed band from 3.1 to 10.6 GHz mainly for indoor
communications (FCC 04-285, 2004; ECMA-368, 2007) and the 24 GHz band for vehicular
short-range radar applications (SARA Group, 2009), with a bandwidth larger than 20% of
the centre frequency or a 10-dB bandwidth of at least 500 MHz as in FCC regulation (FCC
Frontiers in Guided Wave Optics and Optoelectronics
122
04-285, 2004) or at least 50 MHz as in ETSI regulations (ETSI, 2008) and a maximum radiated
PSD of -41.3 dBm/MHz to guarantee spectral coexistence with other wireless narrowband
services complementary in terms of range and bitrate such as WiMAX. Nevertheless, the
whole UWB band 3.1-10.6 GHz is not available worldwide due to coexistence concerns
(WiMedia, 2009). Outside the United States, available effective bandwidth is 1.5 GHz which
only supports hundreds of Mbit/s. However, the unlicensed 60 GHz band enables UWB
multi-Gbit/s wireless communications worldwide, as shown in Fig. 2, while challenges
related to wireless channel and transceiver design have to be addressed (Daniels & Heath,
2007).
Australia
Canada
USA
57
58
59
60
61
62
63
64
65
66
59.4
62.9
(*)
Europe
Japan
Fig. 2. International frequency allocations in the 60 GHz band (as of January 2009). (*) (ECC,
2009)
RoF distribution of UWB signals, termed UWB-over-fibre, has received great interest to
extend the UWB range exploiting the advantages of the broad bandwidth, low loss, light
weight, and immunity to electromagnetic interference offered by optical fibres.
In this section, different techniques for generating impulse-radio UWB signals in the optical
domain is reported, featuring frequencies ranging from baseband up to millimetre-wave
bands, including 24 GHz and 60 GHz. Some laser source characteristics are also discussed.
2.1.1 Impulse-radio ultra-wideband baseband
For UWB-over-fibre systems, it is desirable to generate UWB signals directly in the optical
domain, avoiding the use of additional E/O and O/E conversions and exploiting the
advantages provided by optics such as broadband processing, light weight, small size, and
immunity to electromagnetic interference. Many techniques have been proposed to generate
impulse-radio UWB signals in the 3.1-10.6 GHz band in the optical domain. These
techniques have mainly focused on generating Gaussian monocycle and doublet pulse
shapes, which have been demonstrated to provide better bit error rate (BER) and multipath
performance among different pulse types (Chen & Kiaei, 2002).
RoF distribution of UWB signals in the band from 3.1 to 10.6 GHz for high-definition
audio/video broadcasting in optical access networks, e.g. in fibre-to-the-home (FTTH)
networks has been proposed (Llorente et al., 2008). The performance of both MB-OFDM and
impulse-radio UWB implementations at 1.25 Gbit/s is experimentally analysed and
compared for different SMF links, ranging from 25 km up to 60 km. Both UWB
implementations exhibit error-free operation (BER< 10
-9
) up to 50 km without dispersion
compensation. The impulse radio technology exhibits degraded performance compared
Radio-over-Fibre Techniques and Performance
123
with OFDM although other optimized impulse-radio generation and detection schemes
could lead to different results. OFDM-UWB degrades quickly with fibre length, due to the
carrier suppression effect (Schmuck, 1995).
Several demonstrations on optical generation of impulse-radio UWB in the band from 3.1 to
10.6 GHz including fibre and/or wireless transmission have been reported achieving 65 cm
wireless distance at 500 Mbps data employing on-off keying (OOK) amplitude modulation
(Abtahi et al., 2008); 20 cm at 1.025 Gbit/s OOK-modulated data after up to 10 km of
dispersion-compensated SMF (Hanawa et al., 2009); 5 cm at 1.6875 Gbit/s OOK-modulated
data after 24 km of SMF (Pan & Yao, 2009a); at 1.625 Gbit/s data employing pulse-position
modulation (PPM) after up to 200 m of SMF (Shams et al., 2009a), or 37 km of SMF with no
wireless transmission (Shams et al., 2009b); and at 781.25 Mbit/s data employing binary
phase-shift keying (BPSK) modulation after 30 km of SMF (Yu et al., 2009). In addition,
techniques have been reported capable of pulse shape modulation (PSM) (Dong et al., 2009),
or reconfigurable for multiple modulation formats (Pan & Yao, 2009b).
Photonic generation of Gaussian monocycle pulses based on balanced photodetection of
data Gaussian pulses has been proposed (Hanawa et al., 2007; Beltrán et al., 2008). Data
Gaussian pulses are first generated by intensity modulation of an electrical data sequence
with optical Gaussian pulses from a pulsed laser. This technique is shown in Fig. 3. Optical
Pulsed
Laser
ODL
DATA
Gaussian
Monocycles
BPD
PD
PD
Intensity
Modulator
Fig. 3. Gaussian monocycle pulse generation based on balanced photodetection. ODL:
Optical delay line. BPD: Balanced photodetector. PD: Photodetector.
(a)
(b)
Amplitude (V), 2 mV/div
Time (s), 200 ps/div
0 2 4 6 8 101214161820
-90
-80
-70
-60
-50
-40
-30
Power (dBm)
Fre
q
uenc
y
(
GHz
)
Fig. 4. Monocycle pulses generated employing the technique in Fig. 3; (a) the temporal
waveform and (b) its spectrum (resolution bandwidth: 30 kHz).
Frontiers in Guided Wave Optics and Optoelectronics
124
data pulses are split into two equal parts to drive the two inputs of the balanced
photodetector. Optical delay is employed to adjust the relative time delay between the two
signals. The pulse width of Gaussian pulses and the time-delay difference are adjusted so as
to generate the desired UWB bandwidth. This approach has been experimentally
demonstrated employing an actively mode-locked fibre laser and a Mach-Zehnder
modulator (MZM) (Beltrán et al., 2008). To control the pulse width, a spool of standard SMF
is included after the MZM. Fig. 4 shows monocycles generated based on balanced
photodetection exhibiting a UWB 10-dB bandwidth of 6 GHz at 1.25 Gbit/s.
Gaussian monocycle pulses can also be generated based on differential photoreception of
data Gaussian pulses (Beltrán et al., 2009b) targeting to reduce cost and complexity. Fig. 5
shows this technique. Again, data Gaussian pulses are first generated by intensity
modulation of an electrical data sequence with optical Gaussian pulses from a pulsed laser.
Optical data pulses are photodetected and amplified by an electrical amplifier providing
complementary outputs. The two outputs are combined after adjusting their relative time
delay to generate monocycles. The pulse width of Gaussian pulses and the time-delay
difference are adjusted so as to generate the desired UWB bandwidth. This approach has
been experimentally demonstrated employing an actively mode-locked fibre laser and a
Pulsed
Laser
DATA
Gaussian
Monocycles
Intensity
Modulator
Differential
Photoreceiver
TIA
PD
EDL
Fig. 5. Gaussian monocycle pulse generation based on differential photoreceiver. PD:
Photodetector. TIA: Transimpedance amplifier. EDL: Electrical Delay Line.
(a)
(b)
Time (s), 500 ps/div
Amplitude (V), 15 mV/div
0.0 2.8 5.6 8.4 11.2 14.0
-90
-80
-70
-60
-50
-40
-30
-20
Frequency (GHz)
Power (dBm)
Fig. 6. Monocycle pulses generated employing the technique in Fig. 5; (a) the temporal
waveform and (b) its spectrum (resolution bandwidth: 300 kHz).
Radio-over-Fibre Techniques and Performance
125
MZM. To control the pulsewidth, a spool of standard SMF is included after the MZM. Fig. 6
shows monocycles generated based on differential photoreception exhibiting a UWB 10-dB
bandwidth of 3.8 GHz at 1.244 Gbit/s.
The photonic techniques for Gaussian monocycle generation shown in Fig. 3 and Fig. 5 are
capable of providing high-quality pulses covering the whole UWB band with simple and
flexible configuration compared with other techniques employing custom fibre Bragg
gratings, nonlinear optical processes or spectrum shaping components.
UWB generation requires a pulse width in the order of hundreds of picoseconds to generate
a suitable UWB bandwidth and a multi-gigahertz pulse repetition rate equal to the target
data rate of the system. Gain-switched laser diodes, as used in (Hanawa et al., 2007;
Kaszubowska-Anandarajah et al., 2008), passive or active mode-locked fibre lasers, e.g.
(PriTel, 2009), and emerging optically pumped passively mode-locked vertical-external-
cavity surface-emitting lasers (VECSEL) can provide repetition rates suitable for UWB
systems. In contrast to mode-locked lasers, gain switched lasers are simpler and more
compact. However, timing jitter and also fluctuations of other pulse parameters are larger
than for mode-locked lasers. Optically pumped VECSELs have the potential for very
compact and cheap. In addition, suitable pulses for UWB applications could also be
generated by modulating a continuous-wave light source, e.g. (Wu et al., 2007).
2.1.2 Impulse-radio ultra-wideband in the millimetre-wave band
For UWB optical transmission in RoF operating in the millimetre-wave bands, 24 GHz and
60 GHz, broadband optical frequency up-conversion centralized in the CO appears as a cost-
effective solution instead of employing broadband electrical mixing at each RAU. A number
of techniques have been reported for millimetre-wave impulse-radio UWB signal generation
based on optical up-conversion. These techniques have been demonstrated in the 24 GHz
band regulated for vehicular radar and also used in communications. One approach (Kuri et
al., 2006) up-converts electrical rectangular pulses based on a complex self-heterodyne
technique employing an arrayed waveguide grating (AWG) and a special MZM with high
extinction ratio to suppress the residual RF carrier to meet the UWB emission mask. Another
approach (Guennec & Gary, 2007) up-converts monocycle or doublet pulses generated by
electrical transmitters commercially available by modulation in a MZM biased in nonlinear
regime. This technique is simple, however it requires high-frequency electro-optic devices
which make it difficult to be upgraded to higher frequency bands. The approaches
demonstrated in (Fu et al., 2008; Li et al., 2009) serve as both frequency up-conversion and
optical amplification and up-convert monocycle pulses generated employing electrical
Gaussian pulses and a frequency discriminator. The former method is based on nonlinear
polarization rotation in a semiconductor optical amplifier (SOA) exhibiting limited
performance at high frequencies, whilst the latter method employs a more complex
architecture based on a fibre optical parametric amplifier (OPA) but can be extended to
higher frequency bands. An approach based on up-conversion of optical pulses in a MZM
biased in non-linear regime has also been demonstrated (Chang et al., 2008). Optical
monocycle and doublet pulses are generated by driving a dual-parallel MZM with electrical
Gaussian pulses. In this demonstration, the performance of the millimetre-wave UWB signal
after fibre transmission is analyzed showing the doublet pulse has better tolerance to fibre
dispersion than the monocycle pulse.
Gaussian monocycle pulses do not meet the FCC spectrum mask in the 3.1-10.6 GHz band.
However, these pulses have been demonstrated to be suitable for further frequency up-
Frontiers in Guided Wave Optics and Optoelectronics
126
conversion (Guennec & Gary, 2007). Optical up-conversion to 20 GHz of the generated
baseband monocycles shown in Fig. 4 based on the technique in (Guennec & Gary, 2007)
was also demonstrated in (Beltrán et al., 2008). A simpler approach to generate UWB
monocycles in the millimetre-wave band based on frequency up-conversion of data
Gaussian optical pulses in a MZM at the CO and monocycle shaping at RAUs has been
proposed (Beltrán et al., 2009a; Beltrán et al., 2009c). This technique is depicted in Fig. 7.
Pulsed
Laser
DATA
mm-wave
UWB
monocycles
Intensity
Modulator
MZM
LO
Fibre Link
O/E & Shaping
CO
RAU
BPF
Fig. 7. Millimetre-wave impulse-radio UWB-over-fibre based on up-conversion in a Mach-
Zehnder modulator at the CO and monocycle shaping at the RAU. LO: Local oscillator.
This method has been demonstrated in two proof-of-concept experiments by modulating
Gaussian optical pulses from an actively mode-locked fibre laser with data in a MZM to
generate data Gaussian pulses whose pulse width is subsequently controlled by standard
SMF. A second MZM driven by a local oscillator (LO) signal and biased at quadrature point
(linear regime) generating an optical double-sideband signal with carrier is employed for
up-conversion. The millimetre-wave signal is so obtained after photodetection and filtering
at the RAU. In order to verify appropriate operation, the millimetre-wave signal is down-
converted with the same LO signal employed for up-conversion in an electrical mixer
(conventional homodyne detection) and further low-pass filtered, with no fibre and no air
transmission.
In the first experiment (Beltrán et al., 2009a), monocycle shaping is based on balanced
photodetection as shown in Fig. 3. UWB monocycles are generated at 19 GHz, exhibiting a
single-sideband 10-dB bandwidth of 2.5 GHz at 622 Mbit/s, as shown in Fig. 8. Also shown
(a)
(b)
12 14 16 18 20 22 24 26
-75
-70
-65
-60
-55
-50
-45
-40
-35
PSD (dBm/MHz)
Frequency (GHz)
Amplitude (V), 178 mV/div
Time (ns), 500 ps/div
‘1’ ‘0’ ‘1’
Fig. 8. (a) RF spectrum of UWB monocycles at 19 GHz generated in the setup in Fig. 1 with
monocycle shaping as in Fig. 3. The FCC UWB mask is shown as a dashed line translated to
19 GHz; (b) down-converted data monocycles.
Radio-over-Fibre Techniques and Performance
127
in Fig. 8 is the down-converted signal. The monocycles bear OOK-modulated data so that
they are suitable for simultaneous vehicular radar and communications in the 24 GHz band
to provide traffic safety applications.
Monocycle shaping based on differential photoreception as shown in Fig. 5 is performed in
the second experiment (Beltrán et al., 2009c). This technique does not increase significantly
the complexity of RAUs. UWB monocycles are generated at 16.85 GHz, exhibiting a single-
sideband 10-dB bandwidth of 2.5 GHz and bearing OOK-modulated data at 1.244 Gbit/s, as
shown in Fig. 9. Also shown in Fig. 9 is the down-converted signal.
Time (s), 100 ps/div
Amplitude (V), 35 mV/div
(a)
(b)
10 12 14 16 18 20 22 24
-80
-75
-70
-65
-60
-55
-50
-45
-40
-35
Frequenc
y
(
GHz
)
PSD (dBm/MHz)
Fig. 9. (a) RF spectrum of UWB monocycles at 16.85 GHz generated in the setup in Fig. 7
with monocycle shaping as in Fig. 5. The FCC UWB mask is shown as a dashed line
translated to 16.85 GHz; (b) eye diagram of down-converted data monocycles.
As can be observed in Fig. 8 and Fig. 9, the RF residual carrier does not limit the UWB
emission mask. This enables the simultaneous wireless transmission of the two spectral
sidebands improving receiver sensitivity at expense of reduced spectral efficiency. The two
sidebands could be also filtered separately enabling a simultaneous dual-band generation.
Fig. 10 shows a UWB-over-fibre system where optical data monocycles are frequency up-
converted in a MZM in nonlinear regime. This approach has been proposed and
demonstrated in a proof-of-concept experiment for millimetre-wave UWB generation in the
60 GHz band (Beltrán et al., 2009b). Electrical Gaussian monocycles are converted to optical
domain by external modulation in a MZM to generate optical data monocycles. In the
experiment, electrical OOK-modulated monocycles are generated as shown in Fig. 5. Fig.
11 (a) shows the so-obtained optical data monocycles. A low-frequency LO of 14.25 GHz
multiplied by 2 is applied to a second MZM biased at minimum transmission point to
generate an optical double-sideband signal with a suppressed carrier (optical carrier
suppression modulation), resulting in UWB monocycles at 57 GHz after photodetection and
filtering at the RAU. The millimetre-wave signal is down-converted by electrical homodyne
detection employing the LO signal multiplied by 4 and further low-pass filtered to verify
appropriate operation, with no air transmission.
UWB monocycles are generated at 57 GHz, exhibiting a 10-dB bandwidth of 3.8 GHz at
1.244 Gbit/s, as shown in Fig. 11 (b). In this technique it is required to filter the residual RF
carrier frequency for wireless transmission in practice. Further transmission over 100 m of
Frontiers in Guided Wave Optics and Optoelectronics
128
standard SMF is demonstrated with no performance degradation. Fig. 11 (c) shows the
demodulated signal after fibre transmission. This UWB RoF system has been proposed for
multi-Gbit/s high-definition video/audio distribution within in-vehicle networks, e.g. in
aircrafts, where also fibre interconnects RAUs along the vehicle. The impulse-radio UWB
approach offers also ranging and localization functionalities of special interest for
localization of users potentially interfering and for radio tagging and passenger
identification applications.
UWB
MZM
f
LO
Fibre
Link
PD
CO
RAU
BPF
Wireless Receiver
LNA
x2
MZM
CW
Data
Monocycles
HPA
DCA
x4
4∙f
LO
Fig. 10. Setup of the photonic 60 GHz impulse UWB-over-fibre based on up-conversion of
data optical monocycles in a Mach-Zehnder modulator in nonlinear regime. CW:
Continuous-wave laser. LO: Local oscillator. PD: Photodetector. LNA: Low-noise amplifier.
BPF: Band-pass filter. HPA: High-power amplifier. DCA: Digital communications analyzer.
(a)
(b)
(c)
Time (s), 500 ps/div
Power (W), 200uW/div
56.0 56.8 57.6 58.4 59.2 60.0
-90
-80
-70
-60
-50
-40
-30
Frequency (GHz)
PSD (dBm/MHz)
Amplitude (V), 30 mV/div
Time (ns), 100 ps/div
Fig. 11. Measurements in the setup in Fig. 10; (a) optical data monocycles; (b) RF spectrum of
UWB monocycles at 57 GHz; (c) eye diagram of down-converted data monocycles.
In the techniques in Fig. 7 and Fig. 10, biasing the MZM employed for up-conversion at
minimum transmission point requires half of the LO frequency and reduces the RF power
fading effect due to fibre chromatic dispersion (Ma et al., 2007), however higher power is
required in the system to not degrade performance with respect to bias at quadrature point.
In addition, in both techniques baseband signal is also available after photodetection, which
could be provided via a wired connection and a user could employ a simple, low-cost
receiver to detect the signal by filtering out the millimetre-wave signal. Also, the baseband
signal could meet the UWB mask in the 3.1-10.6 GHz band and be radiated employing an
antenna with a suitable frequency response (Pan & Yao, 2009a).
2.1.3 Pulsed laser source characterization
As described in the previous section, optical generation of impulse-radio signals can be
achieved employing pulsed laser sources. The overall RoF performance depends directly on
Radio-over-Fibre Techniques and Performance
129
the characteristics of the specific pulsed laser employed. In particular, polarization stability
i.e. the variation of polarization over time is of special importance when external
modulation is employed.
The polarization stability of a pulsed laser source can cause spectrum distortion. The
experimental setup for the characterization of the polarization stability of a femtosecond
pulsed laser is depicted in Fig. 12. A computer controls the process of capture and storage of
data.
Pulsed
Laser
PC
Polarizer
Polarization
Analyzer
OSA
Fig. 12. Experimental setup to characterize the polarization stability of pulsed lasers. PC:
Polarization controller. OSA: Optical spectrum analyzer.
The polarization stability and the distortion of the laser spectrum are evaluated for linear
horizontal polarization (LH) with an orientation of 0º (launched polarization) adjusted by
the polarization controller in Fig. 12. In practice, the orientation adjusted is ~3.6º (LH+3.6º).
The optical spectrum analyzer captures the spectrum with 0.05 nm resolution bandwidth
and -80 dBm sensitivity. The evaluation is performed at different wavelengths at which the
spectrum gets distorted for different launched polarizations. The measurement time is 24 h.
Fig. 13 (a) shows the orientation
ψ
(LH+
ψ
) calculated from the normalized Stokes vector
(S1, S2, S3) given by the polarization analyzer as a function of time. Abrupt changes in the
behaviour are due to abrupt temperature changes (disconnection/connection of conditioned
air) in the laboratory measurement environment. Fig. 13 (b) is a plot of Poincare sphere
showing the evolution over time of the normalized Stokes vector. From the Stokes vector
other parameters characterizing polarization such as the degree of polarization (DOP),
(a)
(b)
(c)
0 3 6 9 12 15 18 21 24
3
4
5
6
7
8
9
10
Orientation (degrees)
Time
(
h
)
1555 1560 1565 1570
-6
-5
-4
-3
-2
-1
0
Normalized power (dB)
Wavelength (nm)
Fig. 13. Characterization of the polarization stability of a femtosecond pulsed laser; (a)
Orientation; (b) Poincare sphere; (c) spectra over 1 h.