Solar energy 2012 Part 8 pdf
Bạn đang xem bản rút gọn của tài liệu. Xem và tải ngay bản đầy đủ của tài liệu tại đây (1.73 MB, 30 trang )
Floating Solar Chimney Technology
203
The exit temperature of the first sector is the inlet temperature for the second etc. and finally
the exit temperature of the final M
th
sector is the T
03
, i.e. the inlet stagnation temperature to
the air turbines.
The solar chimney heat transfer analysis during a daily 24 hours cycle, is too
complicated to be presented analytically in this text however we can use the results of
this analysis in order to have a clear picture of the operational characteristics of the
SAEPs. Using the code of the heat transfer analysis for moving mass flow
M
m
, the daily
variation of the exit temperature T
03
can be calculated. Using these calculated daily
values of the T
03
and by the thermodynamic cycle analysis for the optimal mass flow
M
m
the daily power profile of the electricity generation can be calculated.
With this procedure the 24 hour electricity generation power profile of a SAEP with a solar
collector of surface area A
c
=10
6
m
2
and a FSC of H=800m height and d=40m internal
diameter for an average day of the year has been calculated. The SAEP is installed in a place
with annual horizontal solar irradiation W
y
=1700 KWh/m
2
.
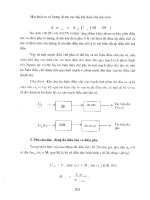
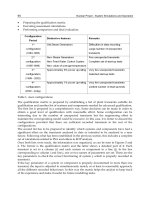
In the following figure three electric power profiles are shown with or without artificial
thermal storage.
0 5 10 15 20 25
40
60
80
100
120
140
160
180
200
solar time in hours
produced power % of average
SAEP of H=800m, d=40m, Ac=1.0 sqrKm, Wy=2000KWh/sqm
Ground only
10%of area covered by tubes
25% covered by tubes
Fig. 13. The average daily SAEP’s electricity generating profiles
The relatively smooth profile shows the electric power generation when only the ground
acts as a thermal storage means. While the smoother profiles are achieved when the
greenhouse is partly covered (~10% or ~25% of its area) by plastic black tubes of 35cm of
diameter filled with water, i.e. there is also additional thermal storage of an equivalent
water sheet of 35·π/4=27.5 cm on a small part of the solar collector.
The daily profiles show that the SAEP operates 24hours/day, due to the greenhouse ground
(and artificial) thermal storage. That is a considerable benefit of the FSC technology
compared to the rest solar technologies and the wind technology which if they are not
equipped with energy mass storage systems they can not operate continuously.
Solar Energy
204
As shown in the produced curves on the previous figure, with a limited (~10%) of the
greenhouse ground covered by plastic tubes (35 cm) filled with water, the maximum daily
power is approximately 140% of its daily average, or the daily average is 70 % of its
maximum power.
Taking into consideration the seasonal power alteration and assuming that the average
annual daily irradiation at a typical place is approximately 70% of the average summer daily
irradiation, the annual average power can be estimated as a percentage of the maximum
power production (at noon of summertime) as the product of 0.77·0.70=0.49.
The maximum power is equal to the rating of the power units of the SAEP (Air turbine,
electric generator, electric transformer etc.), while the average power multiplied by 8760
hours of the year defines the annual electricity generation. Therefore the capacity factor of a
SAEP equipped with a moderate artificial thermal storage can be as high as ~49%.
Without any artificial thermal storage the average daily power is approximately 0.55 of its
maximum thus the capacity factor is ~37% (0.55·0.70≈0.385).
This means that in order to find the annual energy production by the SAEP we should
multiply its rating power by ~3250÷4300 hours. However we should take into consideration
that the SAEPs are operating continuously (24x365) following a daily and seasonal varying
profile.
5. The major parts and engines of Floating Solar Chimney technology
5.1 The solar collector (Greenhouse)
The solar collector can be an ordinary circular greenhouse with a double glazing transparent
roof supported a few meters above the ground. The periphery of the circular greenhouse
should be open to the ambient air. The outer height of the greenhouse should be at least 2
meters tall in order to permit the entrance of maintenance personnel inside the greenhouse.
The height of the solar collector should be increased as we approach its centre where the
FSC is placed. As a general rule the height of the transparent roof should be inversely
proportional to the local diameter of the circular solar collector in order to keep relatively
constant the moving air speed. The circular greenhouse periphery open surface can be equal
or bigger than the FSC cut area.
Another proposal with a simpler structure and shape the greenhouse can be of a rectangular
shape of side DD. The transparent roof could be made of four equal triangular transparent
roofs, elevating from their open sides towards the centre of the rectangle, where the FSC is
placed. Thus the greenhouse forms a rectangular pyramid.
The previous analysis is approximately correct and can be figured out by using an
equivalent circular greenhouse external diameter
4/
c
DDD
π
≈⋅
.
The local height of each inclined triangular roof is almost inversely proportional to the local
side of the triangle in order to secure constant air speed.
Both solar collector structures are typical copies of ordinary agriculture greenhouses
although they are used mainly for warming the moving stream of air from their periphery
towards the centre where the FSC of the SAEP is standing. Such greenhouses are
appropriate for FSC technology application combined with special agriculture inside them.
In desert application of the FSC technology the solar collectors are used exclusively for air
warming. Also in desert or semi desert areas the dust on top of the transparent roofs of the
conventional greenhouses could be a major problem. The dust can deteriorate the
transparency of the upper glazing and furthermore can add unpredictable weight burden on
Floating Solar Chimney Technology
205
the roof structure. The cleaning of the roof with water or air is a difficult task that can
eliminate the desert potential of the FSC technology.
Furthermore in desert or semi-desert areas the construction cost of the conventional solar
collector (a conventional greenhouse) could be unpredictably expensive due to the
unfavourable working conditions on desert sites.
For all above reasons another patented design of the solar collectors has been proposed by
the author.The proposed modular solar collector, as has been named by the author, will be
evident by its description that it is a low cost alternative solar collector of the circular or
rectangular conventional greenhouse which can minimize the works of its construction and
maintenance cost on site.
We can also use and follow the ground elevation on site, and put the FSC on the upper part
of the land-field therefore the works on site for initial land preparation will be minimized.
The greenhouse will be constructed as a set of parallel reverse-V transparent tunnels made
of glass panels as shown in the next figure (14). The maximum height of the air tunnel
should be at least 190cm in order to facilitate the necessary works inside the tunnel, as it is
for example the hanging of the inner crystal clear curtains.
Fig. 14. A part of the triangular tunnel of two panels (a)glass panel, (b)ground support,
(c)glass panel connector (d)glass plastic separator
An indicative figure of a greenhouse made of ten air tunnels is shown in next figure. Among
the parallel air tunnels it is advisable that room should be made for a corridor of 30-40cm of
width for maintenance purposes.
By above description it is evident that the modular solar collector is a low cost alternative of
a conventional circular greenhouse for the FSC technology in desert or semi-desert areas
that minimize the works on site and lower the construction costs of the solar collector and its
SAEP. Furthermore the dust problem is not in existence because the dust slips down on the
inclined triangular glass panels.
The average annual efficiency of the modular solar collector made by a series of triangular
warming air tunnels with double glazing transparent roofs is estimated to be even higher
than 50%. Thus its annual efficiency will follow the usual diagram of efficiency (or it will be
even higher).
The total cut area of all the triangular air tunnels should be approximately equal to the cut
area of the FSC for constant air speed. The central air collecting corridor cut should also
follow the constant air speed rule for optimum operation and minimum construction cost.
Solar Energy
206
Fig. 15. Modular solar collector with ten air tunnels (a)Triangular tunnel, (b)Maintenance
corridor (c)Central air collecting tube, (d)FSC
5.2 The Floating Solar Chimney (FSC)
A small part of a typical version of the FSC on its seat is taking place in the figure(16) below.
Upper Ring of
the heavy base
Strong fabric of
the heavy base
Lower ring of the
heavy base
Accordion type
folding lower
part
Seat of the
floating solar
chimney
Lifting Tube
Filled with lifting
Gas
Supporting Ring
Inflated or
Aluminum tube
Inner fabric wall
Upper Ring of
the heavy base
Strong fabric of
the heavy base
Lower ring of the
heavy base
Accordion type
folding lower
part
Seat of the
floating solar
chimney
Lifting Tube
Filled with lifting
Gas
Supporting Ring
Inflated or
Aluminum tube
Inner fabric wall
Fig. 16. A small part of a typical version of the FSC on its seat
Floating Solar Chimney Technology
207
The over-pressed air tubes of the fabric structure retain its cylindrical shape. While the
lifting tubes (usually filled with NH
3
) supply the structure with buoyancy in order to take
its upright position without external winds. Both tubes can be placed outside the fabric wall
as they are shown in the figure or inside the fabric wall. When the tubes are inside the fabric
core they are protected by the UV radiation and the structure has a more compact form for
the encountering of the external winds unpredictable behavior. But inside the warm air
friction losses are increased and in order to have the same internal diameter the external
diameter of the fabric core should be greater. In the first demonstration project both shapes
could be tested in order that the best option is chosen.
Therefore the FSCs of the SAEPs are free standing fabric structures and due to their
inclining ability they can encounter the external winds. See the next indicative figure (17)
describing its tilting operation under external winds.
Direction of Wind
Main
Chimney
made of
parts
Heavy
Mobile Base
Folding Lower
Part
Chimney
Seat
Direction of Wind
Main
Chimney
made of
parts
Heavy
Mobile Base
Folding Lower
Part
Chimney
Seat
Fig. 17. Tilting operation of the FSC under external winds
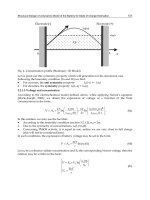
However in areas with annual average strong winds the operating heights of the inclining
fabric structures are decreasing. The following figure (18) presents the operating height loss
of the FSCs as function of the average annual wind speed, for Weibull average constant
k≈2.0. The net buoyancy of the FSC is such that will decline 60
0
degrees when a wind speed
of 10 m/sec appears.
For example using the diagram in figure (18), for an average wind speed of 3 m/sec and a
net lift force assuring a 50% bending for a wind speed of 10 m/sec, the average operating
height decrease is only 3.7%.
As a result we can state that the best places for FSC technology application are the places of
high average horizontal solar irradiation, low average winds and limited strong winds. The
mid-latitude desert and semi-desert areas, that exist in all continents, combine all these
properties and are excellent places for large scale FSC technology application.
Solar Energy
208
Fig. 18. FSC’s operating height average decrease under external winds.
5.3 The air turbines
The air turbines of the SAEPs are either of horizontal axis placed in a circular pattern around
their FSCs or with normal axis placed inside the FSCs (near the bottom). The later case with
only one air turbine is most appropriate for the FSC technology, while the former is more
advisable for concrete solar chimney technology applications.
The air turbines of the solar chimney technology are caged (or ducted) air turbines. These air
turbines are not similar to wind turbines that transform the air kinetic energy to rotational
energy, therefore their rotational power output depends on the wind speed or the air mass
flow. The caged air turbines transform the dynamic energy of the warm air, due to their
buoyancy, to rotational. Therefore their rotational power output does not depend on the
mass flow only but on the product of the mass flow and the pressure drop on the air turbine.
Therefore the warm air mass flow, as we have noticed already, is possible to remain
approximately constant during the daily operation (in order that an optimal operation is
achieved) while its rotational power and its relative electric power output vary during the
daily cycle. The varying quantity is the pressure drop of the air turbine. This pressure drop
depends on the warm air temperature i.e. the warm air proportional buoyancy and the FSC
height.
The air turbines are classified according to the relation between their mass flows and their
pressure drops. The wind turbines are class A turbines (large mass flow small pressure
drop). The useful classes for solar chimney application are the class B and C. The class B are
the caged air turbines with lower pressure drop and relatively higher mass flow and made
without inlet guiding vanes, while the class C air turbines are with higher pressure drops
and relatively lower mass flows and should be made of inlet guiding vanes in order that
optimal efficiency is achieved.
Considering that the floating or concrete solar chimney SAEPs can have the same heights
(between 500m÷1000m) the defining factor for air turbines with or without inlet guiding
vanes is the solar collector diameter.
1 1.5 2 2.5 3 3.5 4
0
1
2
3
4
5
6
7
8
Áverage annual wind speed in m/sec
weibull constant k=2; decline 50 % for v=10 m/sec
decrease in FSC Height %
Floating Solar Chimney Technology
209
For the expensive concrete solar chimney the respective solar collectors are made with high
diameters in order to minimize the construction cost of their SAEPs. While the low cost
floating solar chimneys can be designed with smaller solar collectors for minimal cost and
optimal operation.
The diameters of the solar collectors are proportional to the increase of the warm air
temperatures ΔT=T
03
-T
0
, thus proportional also to the buoyancies and to the pressure drops
on the air turbines.
Therefore the Floating Solar Chimney SAEPs can be designed with air turbines of class B
(i.e. without inlet guiding vanes). These caged air turbines are lower cost units per
generated electricity KWh in comparison with class C air turbines which are appropriate for
concrete solar chimney SAEPs.
5.4 The electric generators
There are two types or electric generators which can be used in SAEPs, the synchronous and
the induction or asynchronous electric generators.
The synchronous electric generators for FSC technology should have a large number of pole-
pairs pp. The frequency of the generated electricity by the multi-pole synchronous electric
generator should be equal to the grid frequency f.
The generated electricity frequency of the synchronous generators f
el
is proportional to its
rotational frequency f
g
i.e. f
el
= pp·f
g
. Thus in case of varying f
g
an electronic drive is
necessary, for adjusting the generated electric frequency f
el
to the grid electric frequency f.
A multi-pole (high value of pp) synchronous electric generator combined with an electronic
drive can be a reasonable solution in order to avoid the adjusting gear box.
In order to control the set to operate the whole SAEP under optimal conditions we either
control its electronic drive unit or its air turbine blade pitch.
The induction generators are of two types. The squirrel cage and the double fed or wound
rotor induction generators. The squirrel cage induction generators rotate with frequencies
close to their synchronous respective frequencies f/pp defined by the grid frequency and
their pole-pairs. For given pole-pairs (for example for four pole caged induction generators
pp=2) the induction generator should engage itself to the air turbine through an appropriate
gear box that is multiplying its rotational frequency in order that the generator rotational
speed matches to the frequency (f/pp)·(1+s), where s is the absolute value of the slip and it
is a small quantity in the range of 0.01 for large generators.
The electric power output of the squirrel cage induction generator is approximately
proportional to the absolute value of the slip s near their operating point. Thus even high
power variations can be absorbed with small rotational frequency variations. Therefore the
squirrel cage induction generators engaged to the air turbines with proper gear boxes are
supplying the grid always with the proper electric frequency and voltage without any
electronic control. The only disadvantage of the squirrel cage induction generators is that
they always produce an inductive reactive power. This reactive power should be
compensated using a parallel set of capacitors creating a capacitive reactive power.
The wound rotor or doubly fed induction generators are characterized by the fact that their
rotors are supplied with a low frequency electric current. With proper control of the voltage
and frequency of the rotor supply we can make them operate as zero reactive power units.
The electronic system supplying the rotor with low frequency current is a power electronic
unit of small power output (~3% of the power output of the generator). However the doubly
fed induction generators with these small electronic supplies of their rotors are more
Solar Energy
210
expensive than the squirrel cage induction generators with reactive power compensating
capacitors.
The SAEPs with normal axis air turbines have enough space underneath the air turbine to
accommodate a large diameter multi-pole generator with a large number of pole pairs in
order to avoid the rotation frequency adjusting gear box.
I believe that the large scale application of the FSC technology will boost the research and
production of large diameter multi-pole squirrel caged or wound rotor induction generators
in order to avoid the sensitive and expensive adjusting gear boxes and to lower the cost of
large electronic drives of multi-pole synchronous generators.
5.5 The gear boxes
The gear box is a essential device for adjusting the frequency of the rotation of the air
turbines f
T
to the electric frequency f of the grid through the relation
f = pp·f
T
·rt. The rt is the rate of transmission of the gear box i.e the generator rotates with
frequency f
g
= f
T
·rt .
When conventional electric generators with a few pole pairs (low pp) are used, as electricity
generating units, gear boxes with a proper rate of transmission rt are necessary. However if
multi-pole electric generators are used with high pole-pair values (pp
h
) then the gear boxes
can be avoided ( if pp
h
=pp·rt).
The gear boxes are mechanical devices made of gears of various diameters and
combinations in order to transform their the mechanical rotation incoming and out-coming
characteristics (i.e.the frequency of rotation f
in ,
f
out
and the torque Tq
in
and Tq
out
) by the
relations f
in
/f
out
=Tq
out
/Tq
in
=rt=rate of transmission.
The gears demand a continuous oil supply and have a limited life cycle. Thus the gear boxes
being huge and heavy devices of high maintenance and sensitivity, if possible they should
not be preferred.
The electric power production by the SAEPs, is calculated as a function of the inlet air speed
υ (i.e. the air mass m
) in the air turbines by a relation of the form:
()
2
03 03te 03 4 2 4
p
g
H
m T T m (T -T -C T )
pp
Pc c
c
⋅
=⋅⋅ − =⋅⋅ ⋅ −
(9)
Where T
O3
, T
O3te
are functions of mass flow m
and FSC top exit temperature T
4
.
We have shown that T
4
is the (appropriate) root of a fourth order polynomial equation:
432
14 24 34 44 5
TTTT 0wwwww
⋅
+⋅+⋅+⋅+= (7)
where w
1
, w
2
, w
3
, w
4
and w
5
are functions of the geometrical, the thermal and ambient
parameters of the SAEP, the air turbine efficiency η
T
and the equivalent horizontal solar
irradiance G.
The mass flow m
and the warm air speed υ are proportional (
t
mA
ρ
υ
=
⋅⋅
) Thus:
P=Function (υ)
The efficiency of the air turbine is in general a function of the ratio υ / υ
tip
i.e. η
T
(υ / υ
tip
) where υ
tip
is the blades’ end rotational speed.
The air turbines of the SAEPs with their geared electric generators are generating electric
power following the air turbine characteristics given by the two operating functions P (υ),
Floating Solar Chimney Technology
211
and η
T
(υ / υ
tip
). Considering that υ
tip
= π· f
T
· d
T
,
where f
T
is the air turbine frequency of
rotation and d
T
the turbine diameter.
The electric frequency for the geared electric generators is equal to f
n
where: f
n
= f
t
·rt·pp, rt is
the gear box transmission ratio and pp the number of their pole pairs. Hence:
Tn
tip
df
rt pp
π
υ
⋅
⋅
=
⋅
(18)
For optimal power production by a SAEP, for an average solar irradiance G, the maximum
point of operation of P(υ) should be reached for an air speed υ for which the efficiency
η
T
(υ / υ
tip
) is also maximum.
The value of υ
m
for maximum electric power can be defined by the SAEP operating function
for η
T
=constant (usually equal to 0.8) and a given solar irradiance G.
The value of the ratio (υ / υ
tip
)
m
for maximum air turbine efficiency can be defined by the
turbine efficiency function η
T
(υ / υ
tip
).
Thus the appropriate υ
tip
is defined by the relation:
,
m
tip m
tip
m
υ
υ
υ
υ
=
⎛⎞
⎜⎟
⎝⎠
(19)
Where the index m means maximum power or efficiency.
Thus for υ
tip,m
the maximum power production under the given horizontal solar irradiance
G is generated. Taking into account that υ
tip
and f
n
are proportional, f
n
should vary with the
horizontal solar irradiance G.
However as we have stated the mass flow for maximum power output by the SAEP is
slightly varying with varying G, thus we can arrange the optimum control of the SAEP for
the average value of G.
A good choice for this average G is a value of 5÷10% higher than the annual average G
y,av
,
defined by the relation G
y,av
=W
y
/8760.
Following the previous procedure for the proposed G, if the air turbine efficiency function
η
T
(υ / υ
tip
) is known or can be estimated, the value of υ
tip,m
can be calculated.
The frequency f of the produced A.C. will follow f
n
by the relation f = (1+s)·f
n
, where s is the
absolute value of the operating slip. Taking into consideration that the absolute value of slip
s, for large induction generators, is less than 1%, f≈f
n
.
Thus the gear box transmission ratio will be defined by the approximate relation:
,
T
tip m
d
f
rt
pp
π
υ
⋅
⋅
≈
⋅
(20)
If the air turbine efficiency function η
T
(υ / υ
tip
) is not known we can assume that for caged
air turbines without inlet guiding vanes their maximum efficiency is achieved for
υ
tip
,
m
=( 6÷8)·υ.
Thus:
(6 8)
T
m
df
rt
p
p
π
υ
⋅⋅
≈
⋅
⋅"
(21)
Solar Energy
212
Where: υ
m
= the air speed for maximum efficiency of the SAEP (derived by the SAEP basic
equation for the chosen value of G), d
T
= the caged air turbine diameter (smaller by 10% of
the FSC diameter usually), f=the grid frequency (usually 50 sec
-1
), pp=2 (usually the
generators are four pole machines).
6. Dimensioning and construction cost of the Floating Solar Chimney SAEPs
6.1 Initial dimensioning of Floating Solar Chimney SAEPs
The floating solar chimneys are fabric structures free standing due to their lifting balloon
tube rings filled with a lighter than air gas. The inexpensive NH
3
is the best choice as lifting
gas for the FSCs. As we will see later the FSCs are low cost structures, in comparison with
the respective concrete solar chimneys.
The annual electricity generation by the SAEPs (E) is proportional to their FSC’s height (H),
their solar collector surface area (A
c
) and the annual horizontal irradiation at the place of
their installation W
y
i.e. E=c·H·A
c
·W
y
.
As for the concrete solar chimney SAEPs, due to their concrete solar chimneys high cost, it is
obvious that in order to minimize their overall construction cost per produced KWh, it is
preferable to use one solar chimney, of height H and internal diameter d, and a large solar
collector of surface area A
c
.
In case of the floating solar chimney SAEPs, generating the same annual amount of
electricity, a farm of N similar SAEPs should be used. Their FSCs will have the same height
(H) and their solar collectors a surface area A
c
/N. If the internal diameters of these FSCs are
/
FSC
ddN≈ then both Power Plants they will have the same efficiency and power
production. Usually /
FSC
ddN> therefore the FSC farm has higher efficiency and
generates more electricity than the concrete solar chimney SAEP for the same solar collector
area.
We have several benefits by using farms of FSC technology as for example:
•
The handling of FSC lighter than air fabric structures is easy if their diameters are
smaller. The diameter d
FSC
should not be less than 1/20 of FSC height H.
•
This choice will give us the benefit of using existing equipment (electric generators,
gear-boxes, etc.) already developed for the wind industry.
•
The smaller surface areas of the solar collectors will decrease the average temperature
increase ΔT of the moving air mass, and consequently it is advisable that simpler and
lower cost air turbines should be used (class B instead of class C air turbines i.e. caged
air turbines without inlet guiding vanes).
The following restrictions are prerequisite for a proper dimensioning of the Floating Solar
Chimney SAEPs.
•
The FSC height H should be less than 800m.
•
Their internal diameter should be less than 40m
•
The solar collector active area should be less than 100 Ha (i.e. 10
6
m
2
)
If the solar collectors are equipped with artificial thermal storage the SAEP will have a
rating power of P
r
=W
y
·η·A
c
/4300. For maximum height 800m, and d=40m the SAEP annual
efficiency is η≈1%. In desert places W
y
can be as high as 2300 KWh/m
2
. Thus P
r
for the
maximum solar collector surface area of 10
6
m
2
is less than 5MW.Generators and respective
gear-boxes up to 5MW are already in use for wind technology. Furthermore if we choose an
internal diameter of 40m for the FSC, it can be proven that for rating power less than 5MW,
Floating Solar Chimney Technology
213
the optimal air turbine should be of class B, i.e. without the inlet guiding vanes. The air
turbine will be placed onto the normal axis inside the bottom of the FSC. A useful notice
concerning the dimensioning of the SAEPs is that for constant FSC height H, rating power
and annual horizontal irradiation the solar collector equivalent diameter D
c
and the FSC
internal diameter d are nearly proportional.Let us apply the dimensioning rules in the case
of desert SAEPs, considering for example that the annual horizontal irradiation is not less
than 2100 KWh/m
2
.Let us consider that the FSC height H is varying, while the solar
collector area is remaining constant to1.0Km
2
and the FSC internal diameter is also constant
and equal to 40m. The rating power of the respective SAEPs, with artificial thermal storage,
is shown on the following table(2).
Solar collector area in Km
2
FSC internal
diameter d in m
FSC height
H in m
Rating power
P
r
in MW
1.0 40 180 1.0
1.0 40 360 2.0
1.0 40 540 3.0
1.0 40 720 4.0
1.0 40 800 4.5
Table 2. Dimensions and rating of SAEPs of 1Km
2
with artificial thermal storage
In the following table (3) initial dimensions of the SAEPs of FSC height 720m installed on
the same area for rating power 1MW, 2MW, 3MW and 4 MW are shown.
Solar collector area in
Km
2
Minimum FSC internal
diameter d in m
FSC height H
in m
Rating power
P
r
in MW
0.25 36 720 1.0
0.50 36 720 2.0
0.75 36 720 3.0
1.0 36 720 4.0
Table 3. Dimensions and rating of SAEPs of 720m height with artificial thermal storage
6.2 Estimating the direct construction cost of Floating Solar Chimney SAEPs
The direct construction cost of a Floating Solar Chimney SAEP with given dimensions is the
sum of the costs of its three major parts, the solar collector cost (C
SC
), the FSC cost (C
FSC
) and
the Air turbines gear boxes and generators cost (C
TG
).The construction cost of the solar
collector is proportional to its surface area. A reasonable rough estimate of modular solar
collectors including the cost of their collecting corridors is:
C
SC
=6.0·A
c
in EURO (A
c
in m
2
) (22)
The construction cost of the FSC is the sum of the cost of its fabric lighter than air cylinder,
and the cost of the heavy base, the folding accordion and the seat. A reasonable rough
estimation of above costs is:
Solar Energy
214
C
FSC
=60·H·d+ 300·d
2
in EURO (H, d in m) (23)
The construction cost of the Turbo-Generators is proportional to the rating power P
r
of the
SAEP a reasonable rough estimation for this cost is:
C
TG
=300·P
r
in EURO (P
r
in KW) (24)
The estimating rough figures are reasonable for SAEPs of rating power of 1÷5 MW. Any
demonstration SAEP and maybe the first few operating SAEPs possible will give us a
construction cost up to ~100% higher than the estimated by the previous rough formulae but
gradually the direct construction cost of the SAEPs should have even lower construction
costs than estimated by the given rough formulae. In the following tables (4,5) the
construction costs of the previously dimensioned SAEPs are given.
Taking into consideration that the rating power multiplied by 4300 hours (for solar collectors
reinforced with artificial thermal storage) will give the annual electricity generation, the
construction cost per produced KWh/year is also presented in the tables (4,5).
Solar
collector
area in Km
2
FSC
internal
diameter d
in m
FSC
height H
in m
Rating
power P
r
in MW
Construction
cost in million
EURO
Construction
cost in EURO
per produced
KWh/year
1.0 40 180 1.0 7.2 1.54
1.0 40 360 2.0 8.0 0.85
1.0 40 540 3.0 8.7 0.62
1.0 40 720 4.0 9.4 0.50
1.0 40 800 4.5 9.8 0.47
Table 4. Direct construction cost of various SAEPs
Solar
collector
area in Km
2
Minimum
FSC internal
diameter d
in m
FSC height
H in m
Rating
power P
r
in MW
Construction
cost in million
EURO
Construction
cost in EURO
per produced
KWh/year
0.25 36 720 1.0 2.75 0.64
0.50 36 720 2.0 5.45 0.63
0.75 36 720 3.0 7.35 0.57
1.0 36 720 4.0 9.15 0.53
Table 5. Direct construction cost of various SAEPs
7. Floating Solar Chimney versus concrete chimney SAEPs
The optimum dimensions and power ratings of the concrete solar chimney SAEPs are far
higher than the Floating Solar Chimney dimensions and rating. In order for them to be
compared we should consider a concrete solar chimney SAEP with given dimensions and
construction cost and a Floating Solar Chimney SAEP farm generating annually the same
electricity and having the same solar chimney height.
In a paper presented in 2005 (Shlaigh et al., 2005) it was mentioned the estimates on the
construction cost of large SAEPs of concrete solar chimneys (Solar Updrafts Towers as they
Floating Solar Chimney Technology
215
name them). According to these estimates concerning a 30 MW SAEP with a concrete solar
chimney of 750 m height and 70 m of internal diameter and a solar collector of 2900m
diameter( i.e. 6.6 Km
2
of surface area) the SAEP will generate 99 million KWh/year and will
have a construction cost of 145 million EURO (2005 prices). Prof Jorg Schlaigh in a recent
speech was estimating the construction cost of a similar concrete solar chimney SAEP of a
solar chimney of 750m height and 3Km diameter to be 250÷300 million EURO (prices 2010).
Let us compare this concrete chimney SAEP with a farm of 9 Floating Solar Chimney SAEPs
each one with a solar collector of surface area 740000m
2
(all of them together will cover
approximately the same land area of the concrete solar chimney SAEP of 6.6Km
2
).
Furthermore let as assume that all of them have the same FSC of ~750m height and an
internal diameter of ~40m. Let us also assume that the power rating of each FSC SAEP is
~3MW.
Although it is reasonable to assume that with these assumptions both electricity generating
power plants will generate the same KWh of electricity per year (~99million KWh/year), the
FSC farm could generate30% more electricity. This is the result of having a higher overall
solar chimney cut in the farm of nine SAEPs, or equivalently the FSC farm will have an
equivalent solar chimney diameter of 120m (
120 40 9( )m m SAEPs=⋅ ). Thus the warm air
speed, in the FSCs, is lower than the air speed within the concrete chimney, therefore the
kinetic energy losses of the exit air are lower in the FSCs and the efficiency of the FSC farm
is higher.
Using the previous construction cost relations the estimated construction cost of each
Floating Solar Chimney SAEP of the farm is ~6million EURO (2010 prices). Thus the whole
FSC farm will have a construction cost of 54 million EURO.
The final result is that the capital expenditure for the Floating Solar Chimney farm, for
similar electricity generation with the concrete solar chimney solar updraft tower, is 3 to 5
times smaller.
8. Direct production cost of electricity KWh of the FSC technology
8.1 Direct production cost analysis
The direct production cost of MWh of any electricity generating power plant is the sum of
three costs:
•
The capital cost related to the capital expenditure (CapEx) on investment
•
The operation and maintenance cost
•
The fuel cost
•
The CO
2
emission cost
For renewable technology PPs the fuel and the carbon dioxide emission costs are zero.
The base load continuous operating technologies are dominating the electricity generation
and their average estimated direct production cost per MWh is, without any carbon
emission penalty within the range of 55÷60 EURO (EU area 2009).
The onshore wind turbine farms have succeeded to generate electricity almost with the same
cost in average. However it is generating intermittent electricity thus it can enter to the grid
up to 45% in power and cover the 15÷20 of the electricity demand.
Let us calculate the direct production cost of the solar chimney technology.
The assumptions we use are the following for FSC and concrete solar chimney SAEPs:
•
The life cycle of both SAEPs is high (minimum 40 years)
Solar Energy
216
• The CapEx is a long term loan repaid in 40 equal installments
•
The interest rate of above loans is 6% (2009)
•
The fabric FSCs should be replaced every 6÷10 years. This cost goes along with the
maintenance cost.
•
The initial construction period of the concrete chimney SAEPs is 3÷5 years while the
period for FSC SAEPs is 1÷2 years. The repayments will start after those periods.
•
Thus the annual repayment installment will be equal to 7% for the FSC farm and 7.5%
for the concrete solar chimney PP (with the cost of initial grace period to be included)
•
The rest operation and maintenance cost of both SAEPs is in the range of 5.0 EURO per
generated MWh.
•
The land lease is not included in the calculation because it is a negligible cost for desert
or semi desert installation
In order to calculate the FSC technology average direct production cost we can use the
figures of the previous paragraph for the SAEP farm of 9 similar units. The dimensions of
which are H=750m, d=40m and A
c
=740000m
2
. Each one of these SAEPs will have a rating
power of 3MW and an annual generating ability of ~12.9GWh/year. Thus their construction
cost was estimated to 6 million. The Annual repayment amount for each FSC SAEP will be
420000 EURO or a capital cost of 32.3 EURO per produced MWh/year.
For the concrete SAEP we consider as a moderate estimation the amount of 200 million
EURO construction cost with an annual generation of ~100 GWh/year. Thus the annual
repayment cost will be 15 million EURO or a capital cost of ~150EURO per MWh/year.
The fabric structure of the FSC should be replaced every 6÷10 years. Its replacement cost is
estimated to be 50·H·d=1.5 million EURO (present value) or a maximum of 250000
EURO/year i.e. 19.2EURO MWh/year (for 6 year replacement period).
The rest operation and maintenance cost for both SAEPs is ~5 EURO per produced MWh.
Thus the direct production cost of MWh/year by the two technologies is:
•
FSC technology ~56.5 EURO/MWh
•
Concrete solar chimney technology ~155 EURO/MWh
Both SAEP technologies operate 24 hours/day year round and they can replace the base
load fossil fueled power plants (Coal, Natural Gas and Nuclear).
8.2 Direct production cost comparison
The following table (6) gives the comparison of the major electricity generating technologies.
The figures for the rest technologies are average values of collected official data, released by
EU authorities in various publications.
The conventional base load electricity generating technologies are the coal and the natural
gas fueled technologies of combined cycle and the nuclear fission technology.The first two
technologies are emitting greenhouse gases and should sooner or later be replaced by
alternative zero emission technologies, while the third-one although it is of zero emission
technology it is considered to be dangerous and health hazardous technology. A necessary
condition for the replacement of the base load electricity generating technologies by
alternative renewable technologies is that these alternative technologies should operate
continuously and their sources should be unlimited. The nuclear fusion technology is an
alternative but its progress is slow, while the global warming threat demands urgent
actions. That goes too for the promising carbon capture and storage technology, besides the
problems related to carbon dioxide safe sequestration
Floating Solar Chimney Technology
217
Fuel or Method of
Electricity Generation
MWh Direct
Production Cost
in EURO
Investment in EURO
per produced
MWh/year
Mode of operation
and Capacity factor
Coal fired (not
including carbon
emission penalties)
55-60 200
Combined cycle base
load 85%
Coal fired with CCS
(Carbon capture and
storage)
80-100 300-400
Combined cycle base
load 85%
Natural Gas fired
(not including carbon
emission penalties)
60-65 150 Combined cycle 85%
Nuclear Fission 65-75 400÷450 Base load 95%
Wind parks onshore 60 500 Intermittent 30%
Wind parks offshore 75 650 Intermittent 30%
Concentrating Solar
CSP
180 2000
Continuous with
thermal storage 30%
Photo Voltaic PV 280 3000 Intermittent 15-17%
Solar Chimney concrete 155 ~2000 Continuous ~50%
Floating Solar Chimney ~60 ~500 Continuous ~50%
Biomass 55-75 500-÷700 Continuous 85%
Geothermal 50-70 500-÷800
Continuous 90%
(limited resource)
Hydroelectric 50-60 500÷800
Continuous (load
following, limited
resource)
Table 6. A cost comparison of electricity generating technologies
The wind and solar technologies are appropriate technologies if they are equipped with
massive energy storage systems for continuous operation. With today’s technology only the
solar concentrating power plants (CSP) can be equipped with cost effective thermal energy
storage systems and generate continuous electricity. However their MWh direct production
cost is three times higher in comparison with the respective cost of the existing base load
technologies. The FSC technology is by nature equipped with ground thermal storage and
operates continuously. Due to its low investment cost and its almost equal direct production
cost to the conventional base load electricity technologies it is an ideal candidate to replace
the fossil fueled base load technologies.
9. Large scale application of the FSC technology in deserts
9.1 Desert solar technologies
The mid-latitude desert or semi desert areas of our planet are more than enough in order to
cover the present and any future demand for solar electricity. According to most
conservative estimations, a 3% of these areas with only 1% efficiency for solar electricity
generation can supply 50% of our future electricity demand. Also these kinds of lands exist
in all continents and near the major carbon emitting countries (USA, China, EU and India).
Solar Energy
218
The desert solar technologies for continuous electricity generation are the following:
•
The photo voltaic (PV) large scale farms equipped with batteries
•
The concentrating solar power plants (CSP) equipped with thermal storage tanks
•
The concrete solar chimney SAEPs or Solar Up-draft Towers
•
The floating solar chimney (FSC) farms
The following table (7) is giving us a comprehensive comparison of these desert solar
technologies (OM means operation and maintenance).
Desert
Technology of
continuous
operation
Major benefits Major problems
MWh Direct
production cost
in EURO
Investment per
produced
MWh/year
PV with
energy storage
batteries
-Demands no
water
-Low OM care
and cost
-The replacement
cost of the
batteries
Very high
280
Very high
>3000
CSP with
thermal
storage
-Low cost
thermal storage
-Demands water
for its operation
-Demands OM
personnel on site
High
180
High
>2000
Solar up-draft
Tower
(concrete solar
chimney)
- No water
demand
-High operating
life
-Low OM care
and cost
-High initial cost
-High
construction
period on site
High
155
High
>2000
Floating Solar
Chimney
-No water
demand
-Easy and fast
deployment on
site
-Low OM care
-Periodic
replacement of
the FSC fabric
parts
Low
60
Low
500
Table 7. Comparison of desert solar technologies
9.2 The Desertec project
The Desertec project is a proposal to EU for using the desert or semi desert areas in MENA
area (Middle East and North Africa) in order to generate solar electricity. Using an
appropriate area of 300KmX300Km in MENA with only 1% efficiency up to 50% of its
present and future electricity demand can be generated.
The transmission of the generated electricity to the EU can be achieved by using UHVDC
(Ultra High Voltage Direct Curent) lines. Using the existing technology up to 6.4 GW of
electricity power can be transmitted by only one UHVDC line of two conductors (±800KV
and 4000A).
The UHVDC lines can be overhead, underground or undersea lines with different
construction costs but the same safety and reliability.
Floating Solar Chimney Technology
219
The farm of desert power plants generates AC electricity (up to 6.4 GW). This AC electricity
is converted to DC electricity, at a special power station near the farm. Through a UHVDC
line the DC electricity is transmitted to the chosen place of EU, where a reverse converter
power station is transforming the DC to AC electricity with the suitable characteristics for
the EU local grid.
The losses of the UHVDC transmission (including the losses of two converting power
stations) are not more than ~5% per 2000 Km of transmission distance. Their construction
cost for 2000Km average distance between MENA and EU areas, depends on the mode of
the UHVDC line and will range between 1÷2 Billion EURO.
The following table shows a comparison cost for an electricity generation system of 6.4GW
installed in MENA area and transmitting its electricity power to a EU grid for a distance of
2000Km. It is assumed that due to the energy storage systems of all the desert power plants
their capacity factor is more or less similar ( ~50%). This practically means that the desert
solar farms would generate electricity of ~6.4GW X (8760/2)hours≈28000GWh/year, of
which ~95% or ~26500 GWh/year (or 26.5 TWh/year) will be transmitted to the EU chosen
place.
In order to cover 40÷50% of the present and future EU electricity demand i.e. 1060÷1500
TWh/year we should build a set of 40 to 56 independent solar farms of 6.4GW that can be
installed in appropriate MENA areas and connected through UHVDC lines to the proper
places of EU countries. In order to build 40-56 farms we should invest capital of the amounts
as shown in the next table (8) for respective technologies.
Desert Technology
of continuous
operation
Investment cost
(including UHVDC lines
cost of 1.5 billion EURO)
for the solar farm of
6.4GW in billion EURO
Investment cost for
building 40÷56
similar solar farms
in billion EURO
MWh direct
production cost in
EURO (26.5 TWh
supplied to EU )
PV with energy
storage batteries
>85.5
3420
4778
>285
CSP (parabolic
through or tower)
with thermal
storage
57.5
2300
3220
185
Solar up-draft
Towers
57.5
2300
3220
160
Floating Solar
Chimney
15.5
620
868
65
Table 8. Cost comparison of solar desert farms of 6.4 GW
The maximum desert or semi desert area for the installation of one solar farm of 6.4GW is
not more than 1600 Km
2
or a square area ~(40Km X 40Km). Thus the maximum neaded area
in order to cover the 40÷50% of the present and future EU electricity demand, with zero
emission solar electricity, is 64000÷90000Km
2
(i.e. a square area of 250Km X 250Km up to
300Km X 300Km)
Solar Energy
220
This maximum area is indispensable for solar chimney farms (concrete or floating) of 1%
efficiency. As for the rest solar technologies a much smaller desert area is adequate.
However the maximum area needed is not more than 2% of proper desert or semi desert
area in MENA territory.
By the presented data it is evident that the FSC technology has tremendous benefits in
comparison with its solar competitors for desert application.
Its major benefits are:
•
Low investment cost
•
Low KWh direct production cost (almost the same with the fuel consuming base load
electricity generating technologies)
•
24hours/day uninterrupted operation due to the ground thermal storage
•
The daily power profile can be as smooth as necessary using low cost additional
thermal storage
•
Demands no water for its operation and maintenance
•
Easy and fast deployment on site
•
It uses recycling and low energy production materials (mainly plastic and glass)
•
Minimum personnel on site during its construction and operation
Large scale desert application of the Floating Solar Chimney technology can be one of the
major tools for global warming elimination and sustainable development.
10. Climate change warning
Climate change indications due to the global warming threat are accelerating. Climate change
policies should be agreed upon and urgent measures should be taken. Global warming due to
greenhouse gases emissions (CO
2
, CH
4
etc.) is a reality scientifically documented.
Intergovernmental Panel on Climate Change (IPCC) is a Nobel Priced UN committee
studying carefully and objectively the global warming due to greenhouse gases produced by
human activity on earth. The major producer is the fossil fuels used in residential, industrial,
and transportation activities, of which the major-one is the electricity generation of fossil
fueled power plants. According to IPCC estimations the global average temperature
increase on earth will follow the pattern shown in the next figure (19) depending on our
future model of energy use, electricity generation scenarios and greenhouse gases
concentration. According to mentioned estimations, pertaining the existing technology and
applying an internationally agreed upon strict policy on greenhouse gas emissions, the
scenario most likely to come up is an eventuality between I and II.
According to mentioned scientifically documented estimations, global temperatures in
excess of 1.9 to 4.6
0
C warmer than pre-industrial would appear and it will be possibly
sustained for centuries.
The major global warming effects on our planet, according to IPCC are:
•
Anthropogenic warming and sea level rise would continue for centuries even if the
greenhouse gas concentrations were to be stabilized
•
Eventual melting of the Greenland ice sheet, would raise the sea level by 7 m compared
to 125,000 years ago
•
Due to precipitation changes fertile land devastation is possible to appear in many areas
•
The existing atmospheric models can not exclude the appearance of extreme
catastrophic atmospheric phenomena such as: very strong typhoons, tornados, snow or
hail storms etc.
Floating Solar Chimney Technology
221
Fig. 19. IPCC scenarios of global temperature increase
The energy sector is the major source of the greenhouse gases due to its fossil fuelled
technologies of electricity generation, transportation, industrial activities etc. For the year of
2010 an estimated quantity of 29,000 Mt of carbon dioxide will be spread all over the
environment from fossil fuel combustion of which:
•
36.4 % from electricity generation
•
20.8 % from the industry
•
18.8 % from transport and
•
14.2 % from household, service and agriculture and
•
9.8 % from international bunkers
The mechanism of Kyoto protocol aims to create an “objective” over the external cost at least
for the threatening carbon dioxide (CO
2
) emissions through trading their rights.
The cost of the emitted CO
2
, sooner or later it will reach at prices 20-30 EURO per ton of CO
2
and after the year 2012 for EU the fossil fuelled PPs should pay for each ton of CO
2
emitted
by them. Taking into consideration that 1 Kg of coal has a thermal energy of ~8.14 KWh,
thus a modern coal fired power plant with efficiency ~45% will generate by this ~ 3.66 KWh
and will emit to the environment 3.667 Kg of CO
2
. Thus in a modern coal fired plant
approximately 1.0 Kg of CO
2
is emitted per generated KWh. For the lignite coal fired power
plants this figure is 50% higher and for modern combined cycle natural gas power plants
could be 50% smaller.
11. Conclusion
Although electricity generation is a major carbon dioxide producer we should notice that
electricity can replace all the energy activities related to fossil fuelled technologies. Thus a
solution to the global warming is possible if we succeed to generate zero emission clean
electricity.
Solar Energy
222
The renewable electricity generating technologies is a major tool, some believe that it should
be the exclusive technology, towards the aim of eliminating the greenhouse emissions
threatening the future on our planet.
It is possible to mitigate global warming if the world-wide consumption of fossil fuels can
be drastically reduced within the next 10 to 15 years. I believe that the only viable scenario
that could lead to a successful and real reduction of fossil fuels is the large scale application
of the FSC technology in desert or semi desert areas. This means that we should start
building, for the next 30 years, Floating Solar Chimney SAEP desert farms of overall rating
power ~160 GW/year, that could generate ~720 TWh/year.
Thus for the next 30 years we will build SAEP desert farms generating more than 21600
TWh/year solar electricity that could replace fossil fuelled generated electricity. The global
investment cost for this choice will not exceed the amount of 360 billion EURO/year or 11.5
trillion EURO for the next 30 years. These investments in electricity generation are
reasonable taking into consideration that the future electricity demand could reach the
45000 TWh. The necessary land for the 30 years FSC power plants is 1.000.000 Km
2
(1000 Km
X 1000 Km)
12. References
[1] Bernades M.A. dos S., Vob A., Weinrebe G., 2003 “Thermal and technical analyses of solar
chimneys” Solar Energy 75 ELSEVIER, pp. 511-52.
[2] Backstrom T, Gannon A. 2000, “Compressible Flow Through Solar Power Plant Chimneys”.
August vol 122/ pp.138-145.
[3] Gannon A. , Von Backstrom T 2000, “Solar Chimney Cycle Analysis with System loss and
solar Collector Performance”, Journal of Solar Energy Engineering, August Vol
122/pp.133-137.
[4] Papageorgiou C. 2004 “Solar Turbine Power Stations with Floating Solar Chimneys”. IASTED
proceedings of Power and Energy Systems, EuroPES 2004. Rhodes Greece, july
2004 pp,151-158
[5] Papageorgiou C. 2004, “External Wind Effects on Floating Solar Chimney” IASTED
Proceedings of Power and Energy Systems, EuroPES 2004, Conference, Rhodes
Greece ,July 2004 2004 pp.159-163
[6] Papageorgiou C. 2004, “Efficiency of solar air turbine power stations with floating solar
chimneys” IASTED Proceedings of Power and Energy Systems Conference Florida,
November 2004, pp. 127-134.
[7] Papageorgiou C. "Floating Solar Chimney" E.U. Patent 1618302 April. 29, 2009.
[8] Pretorius J.P., Kroger D.G. 2006,“Solar Chimney Power Plant Performance“, Journal of Solar
Energy Engineering, August 2006, Vol 128 pp.302-311
[9] Pretorius J., "Optimization and Control of a Large-scale Solar Chimney Power Plant" Ph.D.
dissertation, Dept. Mechanical Eng., Univ. Stellenbosch 7602 Matieland, South
Africa 2007.
[10] Schlaich J. 1995, “The Solar Chimney: Electricity from the sun” Axel Mengers Edition,
Stutgart
[11] J. Schlaich J. e.al 2005, “Design of commercial Solar Updraft Tower Systems-Utilization of
Solar Induced Convective Flows for Power Generation” Journal of Solar Energy
Engineering Feb. 2005 vol 127, pp. 117-124R.
[12] White F. “Fluid Mechanics” 4th Edition McGraw-Hill N.York 1999
11
Organic Solar Cells Performances Improvement
Induced by Interface Buffer Layers
J. C. Bernède
1
, A. Godoy
2
, L. Cattin
1
, F. R. Diaz
3
,
M. Morsli
1
and M. A. del Valle
3
1
Université de Nantes, Nantes Atlantique Universités, LAMP, EA 3825, Faculté des
Sciences et des Techniques, 2 rue de la Houssinière, BP 92208, Nantes, F-44000
2
Facultad Ciencias de la Salud, Universidad Diego Portales. Ejército 141. Santiago de Chile
3
Facultatd de Quimica, PUCC, Casilla 306, Correo 22, Santiago,
1
France
2,3
Chile
1. Introduction
The energy sector has a constrained future, since increasing demand coincides with “prise
de conscience” of the negative implications of fossil energy use. Global warming is finally a
clear evidence of the fundamental idea of the “old” Newtonian physics: there is no action
without reaction. Fundamental principle neglected by the occidental world during the last
century. That is to say, we cannot continue to emit continuously carbon dioxide, nitrogen
dioxide… and others pollutants produced from the burning of fossil energies into our
environment without suffering the consequences. Some environmental scientists have
highlighted this problem for some time [Lüthi et al., Nature, 2008], but only now are some
governments giving the issue the attention that it deserves. Man-made climate change is one
of the greatest threats our world faces. Renewable energies issued from our natural
environment, such as wind power, solar thermal, photovoltaic, geothermal heat, marine and
hydro power…, can help reduce our dependence on fossil energies. The present review is
dedicated to photovoltaic energy and more precisely to some specific photovoltaic devices
based on organic materials.
Photovoltaic cells belong to the family of the optoelectronic devices. As evidenced by their
denomination, such devices use the optical and electronic transport properties of different
materials to either produce electromagnetic radiation (light emitting diodes) or to generate
electricity (photovoltaic cells -PV cells). Photovoltaic cells also called solar cells are used to
generate electrical power. A PV cell is a device based on the photoconductive properties of
semiconductor materials -for carriers generation- coupled with the ability of these
semiconductors to form junctions -for carriers separation. The photoconductivity is the
process in which electromagnetic energy is absorbed by a material and converted to
excitation energy of electric charge carriers so that the material becomes quite conductor.
When irradiated by a light, PV cells produce electrical energy across any connected external
load. When irradiated without load a PV cell produces a maximum photogenerated voltage
V
oc
, the open-circuit voltage. When shorted, the PV cell produces the maximum short circuit
Solar Energy
224
current I
sc
. When connected to a load the power output of the cell is given by the voltage
current product VxI. The maximal power generated possible is V
oc
xI
sc
. In fact the maximum
power a PV cell is able generating depends on the dark I-V characteristics, that is to say on
the diode properties of the junction constituting the device. When the load value is
optimised, the maximum power provided by the cell is Pm = V
m
xI
m
. A figure of merit called
the fill factor, FF, for the PV cells is given by:
FF = V
m
xI
m
/ V
oc
xI
sc
(1).
Up to now, inorganic materials are used in photovoltaic cells. Crystalline, polycrystalline
and amorphous silicon represent more than 95 % of the world production, while CdTe and
Cu(In,Ga)Se
2
(CIGS) are now emerging in the market. Crystalline (or polycrystalline)
devices allow achieving efficiencies up to 25%. However, efficient crystalline (or
polycrystalline) devices are difficult and expensive to produce and the pay-back time of
such modules is around three years. Traditionally, optoelectronic devices were grown using
inorganic compounds. However, some years ago, research devoted to organic light emitting
diodes (OLEDs) encounter an unexpected success [Jain et al., Semiconductors and semimetals,
2007] and they are now available on the market. Moreover it has been shown that the
quantum efficiency of the electron transfer from an excited polymer to fullerene (C
60
) is very
high [Xiong Gong et al. Sciences, 1992]. So, since the pioneering work of Tang [Tang, Appl.
Phys. Lett., 1986] the interest devoted to organic solar cells has been raising very fast, which
has undergone a gradual evolution of the energy conversion efficiency, η, from less than 1%
to more than 5% [Kim et al., Sciences, 2007, Xue et al., J. Appl. Phys., 2005]. These significant
progresses demonstrate that organic solar cells are a potential avenue to low cost next
generation solar cells. However, some efforts are still necessary to improve the cell efficiency
and lifetime. To overcome the quite narrow absorbance domain of the organic photoactive
layer, several approaches such as low band gap organic material, incorporation of metal
nanostructures, use of inorganic optical spacer between the active layer and the electrode
can be used. It is also well known that carriers exchange at interfaces organic
material/electrode can greatly influence device performance. In the present review, based
on our recent studies, we will discuss more specifically possible device improvement
through interface optimisation. The plan of the manuscript is as follow, after recalling some
generality on organic solar cells and the classical interface theory in semiconductors, impact
of electrode/organic interface properties on cells performances will be discussed using
different published results, and more specifically studied from our last results. All the
results will be critically discussed in the context of how to improve the fundamental
understanding of interface behavior to enhance solar cells performance.
2. A short comparison with organic light emitting diodes
As said above, the development of efficient organic displays based on organic light emitting
devices (OLEDs) has shown that organic electronic components are viable. Those displays
are now developed using low cost technology and these new technologies development for
OLED can be tested for PV solar cells realisation [Bernède et al., Current Trends in polymer
Sciences, 2001]. Basically the underlying principle of a photovoltaic solar cell is the reverse of
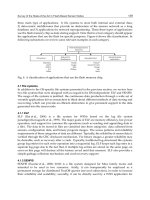
the principle of OLED Figure 1.
Organic Solar Cells Performances Improvement Induced by Interface Buffer Layers
225
L
U
M
O
e
-
⊕
IP
χ
Φ
TCO
Eg
Φ
Al
Vacuu
m l
eve
l
TCO Organic material aluminium
H
O
M
O
E
F
E
F
Light
T
CO
Al
Organic material
G
l
ass
subst
r
ate
+ In
p
ut -
T
CO
Al
O
r
g
ani
c
mat
e
rial
G
l
ass
subst
r
ate
+ Out
p
ut -
Light
Φ
TCO
TCO Organic material aluminium
LUMO
e
-
⊕
IP
χ
Eg
Φ
Al
Vacuu
m l
eve
l
H
O
M
O
E
F
E
F
Fig. 1. Principle of an OLED (left) and a solar cell (right) (Band scheme without contact)
In OLED, electrons are injected at the low work function electrode (cathode), while holes are
injected at the high work function electrode (anode). At some point in the organic, the
electron and hole meet and recombine with light emission. The reverse happens in a PV cell,
when light is absorbed an exciton forms. After exciton dissociation, the electron must reach
the low work function electrode and the hole the high work function electrode.
In fact, when the organic material is put into contact with electrode, the shape of the band
scheme depends on the conductance of the organic material Figure 2.
When the cells are short circuited, the Fermi levels of the electrodes align. If the organic is an
insulator, the field profile changes linearly through the cell (fig. 2b). If the organic is a p-type
semiconductor a depletion layer forms on the side of the metal with small work function, we
have Schottky contact (fig. 2c). Usually the former scheme is used in OLEDs, the organic
films used being quite insulating and the latter scheme is often used in solar cells, the
organic active layers being semiconducting.
Almost all organic optoelectronic devices have a planar layered structure, where the organic
active layer(s) is (are) sandwiched between two different electrodes. One of them must be
Solar Energy
226
transparent. A transparent conductive oxide (TCO) is used, usually indium tin oxide (ITO)
because it allows achieving better results. The other electrode is very often aluminium, even
if calcium has a better work function, because Al is stable in air while Ca is not. From the
above comparison it can be concluded that a device which exhibits high electro-luminescent
properties will be a poor solar cell and vice versa. However in both devices families the
properties of the contact electrode/organic material are determinant to the efficiency of the
devices, and the progress in that field for one device family is very helpful for the other
family.
a: before contact b: after contact, with an insulating organic material
c: after contact, with an organic p-type semiconductor material
Fig. 2. Band scheme of TCO/organic/Al structure
3. Different organic solar cells families
Organic semiconductors, such as macromolecules dyes, dendrimers, oligomers, polymers…,
are all based on conjugated π electrons. Conjugated systems are based on an alternation
between single and double bonds. The main property related to this conjugation is that π
electrons are more mobile than σ electrons. Therefore the π electrons can move by hopping.
These π electrons allow light absorption, in the case of solar cells, and emission, in the case
of OLEDs. Molecular π-π* orbitals correspond respectively to the Highest Occupied
Molecular Orbital (HOMO) and Lowest Unoccupied Molecular Orbital (LUMO). For sake of
simplicity, such organic material can be regarded as a semiconductor-like material, where
the band gap corresponds to the difference between the LUMO and the HOMO.
Photons absorption by inorganic semiconductors produces free electrons and holes, the
charge separation is more difficult in organic semiconductors. When a photon of
Al
OTC
Vacuum level
Organic Solar Cells Performances Improvement Induced by Interface Buffer Layers
227
appropriate energy is incident upon organic semiconductor it can be absorbed to produce an
excited state called exciton, that is to say an electron-hole pair in a bound state which is
transported as a quasi-particle. In organic materials excitons are strongly bounded as a
consequence of their low dielectric constant. Organic solar cells belong to the class of
photovoltaic cells known as excitonic solar cells [Thompson, Fréchet, Angnew. Chem. Int. Ed.,
2008]. The excitons can have appreciable life-time before recombination. To produce
photocurrent the electron-hole pair of the exciton must be separated. If not, they can
recombine either radiatively (luminescence is a loss mechanism in photovoltaic cells) or
non-radiatively with heat production. Therefore after light absorption and exciton
formation, the carriers should be separated. Even if not well understand the dissociation
occurs at defects, impurities, contacts or any other inhomogeneities. The separation occurs
in the electric field induced around the inhomogeneity. If the ionisation takes place at a
random defect in a region without an overall electric field, the generated carriers will be lost.
To avoid such loss, exciton dissociation should occur in high electric field region associated
with a contact or a junction. To produce an internal electric field which occupy a substantial
volume of the device, the usual method is to juxtapose two materials with different
appropriate properties. One of these materials is an electron donor and the other one is
called electron acceptor. The interface between these two materials is called heterojunction.
Therefore it is clear that the active donor-acceptor pair governs the separation mechanism.
While in the case of inorganic materials the both materials of the heterojunction are clearly
identified, the electron acceptor is the n-type material related to its electron excess and the
electron donor is the p-type material related to its hole excess, it is not so simple in the case
of organic materials. The donor or acceptor nature of an organic semiconductor depends on
its carrier mobility which is determined by intrinsic properties of this material. Moreover, it
is known that the donor or acceptor character of a material in an organic couple depends
also on their relative HOMO and LUMO values. For instance, CuPc, which is a usually an
electron donor, has been also used as electron acceptor with a triphenylamine derivative
used as donor [Chen et al., Sol. Energy Mater. Sol. Cells, 2006]. Therefore an organic material
with intermediary HOMO and LUMO values can be used as an electron donor for one
organic material and as an electron acceptor for another organic material. In figure 3 we can
Fig. 3. Relative position of the HOMO and LUMO of CuPc/1,4-DAAQ/PTCDA.
CuPc 1,4-DAAQ PTCDA
3,9 eV
5,7 eV
3,5 eV
5,2 eV
Vacuum level
4,8 eV
6,9 eV