báo cáo hóa học:" Research Article TRII: A Probabilistic Scoring of Drosophila melanogaster Translation Initiation Sites" pdf
Bạn đang xem bản rút gọn của tài liệu. Xem và tải ngay bản đầy đủ của tài liệu tại đây (2 MB, 15 trang )
Hindawi Publishing Corporation
EURASIP Journal on Bioinformatics and Systems Biology
Volume 2010, Article ID 814127, 14 pages
doi:10.1155/2010/814127
Research Ar ticle
TRII: A Probabilistic Scoring of
Drosophila melanogaster
Translat ion Initi ation Sites
Michael P. Weir
1
and Michael D. Rice
2
1
Department of Biology, Wesleyan University, Middletown, CT 06459, USA
2
Department of Mathematics and Computer Science, Wesleyan University, Middletown, CT 06459, USA
Correspondence should be addressed t o Michael P. Weir,
Received 29 April 2010; Revised 23 August 2010; Accepted 14 October 2010
Academic Editor: Yufei Huang
Copyright © 2010 M. P. Weir and M. D. Rice. This is an open access article distributed under the Creative Commons Attribution
License, which permits unrestricted use, distribution, and reproduction in any medium, provided the original work is properly
cited.
Relative individual information is a measurement that scores the quality of DNA- and RNA-binding sites for biological machines.
The development of analytical approaches to increase the power of this scoring method will improve its utility in evaluating
the functions of motifs. In this study, the scoring method was applied to potential translation initiation sites in Drosophila to
compute Translation Relative Individual Information (TRII) scores. The weight matrix at the core of the scoring method was
optimized based on high-confidence translation initiation sites identified by using a progressive partitioning approach. Comparing
the distributions of TRII scores for sites of interest with those for high-confidence translation initiation sites and random sequences
provides a new methodology for assessing the quality of translation initiation sites. The optimized weight matrices can also be used
to describe the consensus at translation initiation sites, providing a quantitative measure of preferred and avoided nucleotides at
each position.
1. Introduction
Understanding how biological machines work in the con-
text of genomes, transcriptomes, and proteomes requires
appropriate languages and representations for successful
modeling of their biological processes. Information theory
provides one of the foundations for this goal and underlies
sequence motif-finding algorithms such as MEME [1]. For
example, information theory gives us powerful ways to
analyze and score sequence motifs in RNAs that are targeted
by biological machines such as the spliceosome or ribosome
[2–4]. The approach reveals, for each nucleotide p osition
in the motif, which nucleotide choices ar e preferred and
which are avoided. For any single RNA sequence, the
collective deviations from the preferred nucleotides must be
sufficiently small for the machine to successfully function on
that RNA.
In this study, several analytical approaches are integrated
to increase the power of these scoring methods using
Drosophila translation initiation sites as a model setting.
As an int roduction, we describe first the information theo-
retic basis for these scoring methods. Motifs of functional
importance can be quantitatively assessed through their
sequence conservation, measured as information content in
sets of aligned sequences [2, 5, 6]. The information at each
nucleotide position p for a set of n aligned RNA sequences is
defined by the expression
information
p
=
2 −
− f
p
(
α
)
log
2
f
p
(
α
)
|
α = A, C, G, or U
−
γ.
(1)
The summation represents the uncertainty based on the fre-
quencies of occurrence f
p
(A), , f
p
(U) of the nucleotides
A, ,U at position p. The sampling correction factor γ
depends on n and decreases toward 0 as the value of n
increases [3].
It is sometimes important to take into account non-
random background nucleotide frequencies. For example,
the mean frequencies of each nucleotide in Drosophila
cDNAs deviate significantly from 0.25 [3], and this fact
may influence how spliceosomes or ribosomes perceive RNA
molecules. The relative information (often called relative
2 EURASIP Journal on Bioinformatics and Systems Biology
entropy) at each nucleotide position p is defined by the
expression
information
b
p
=
f
p
(
α
)
log
2
f
p
(
α
)
b
(
α
)
|
α = A, C, G, or U
−
γ,
(2)
where b(α)isthebackgroundfrequency of nucleotide α in a
selected set of sequences.
The information values defined above are based o n
groups of aligned sequences. The theory can be extended
to allow assessment of individual sequences. Measurement
of individual information allows scoring of how well an
individual sequence conforms to a conserved motif [7]. For
example, it has b een used to score conserved motifs such
as splice sites [3]. Individual information is defined with
respect to a reference set R of aligned sequences as follows.
Assume that R consists of n aligned sequences, each of length
m. Suppose that s
1
, , s
m
denotes the nucleotides in a test
sequence s.Then,theindividual information of s is defined
by
score
(
s
)
=
2 + log
2
f
p
s
p
−
γ | 1 ≤ p ≤ m
,(3)
where f
p
(s
p
) denotes the frequency of occurrence of
nucleotide s
p
at position p in the set R,andγ denotes
the sampling correction factor discussed above. In essence,
the reference set R is used to create a weight matrix of
values
{2 + log
2
( f
p
(r
p
)) − γ} which are used to calculate the
individual information score based on which nucleotide s
p
is
present at each p osition p in the test sequence s.Themore
representative the reference sequences used to construct the
weight matrix, the better the dynamic range of the individual
information scoring system: sequences with a good match to
a motif will have higher scores, and sequences with poorer
matches will have lower scor es ( s ee discussion of matrix
optimization below).
Nonrandom background nucleotide frequencies can be
taken into account using relative individual information
(sometimes called “individual relative entropy”) which is
defined as follows:
score
b
(
s
)
=
⎧
⎨
⎩
log
2
⎛
⎝
f
p
s
p
b
s
p
⎞
⎠
−
γ | 1 ≤ p ≤ m
⎫
⎬
⎭
,(4)
where b(s
p
)isthebackgroundfrequency of nucleotide s
p
.
For example, when relative individual information is used
to score splice sites [3], background nucleotide frequencies
based on the full set of cDNAs were u sed.
Relative individual information scoring of individual
DNA and RNA sequences has been discussed prev iously [7],
and forms t h e basis for motif finding algorithms such as
MEME [1] which are based on Markov models that encap-
sulate the notion of individual information. In this study,
we developed methods to use relative individual information
to score translation initiation sites using Drosophila as a
model system. When applied to translation initiation, we
refer to relative individual information scores as TRII scores
(Translation Relative Individual Information). As presented
below, the ability to score individual sequences presents
an opportunity to analyze distributions of TRII scores for
sets of sequences of interest. By appropriate choices of
control test TRII score distributions, this approach allows
one to interpret score distributions for sites of interest in a
probabilistic manner. Analysis of score distributions provides
insights into translation initiation: potential initiation sites
with TRII scores that resemble high-confidence start sites
can be considered likely initiation sites whereas sites similar
to random sequences are likely to be weak or nonfunctional
for translation initiation. We also discuss how the methods
described in this paper can be applied to the initiation
context scoring method of M i y asaka [8] which has been
used, for example, to predict and score translation initiation
sites in a recent ribosome profiling study based o n deep
sequence analysis in yeast [9]. In contrast to TRII scoring,
which measures deviations from background frequencies
at each nucleotide position (4), the Miyasaka method is
based on d eviations from the preferred nucleotide at each
position.
2. Results and Discussion
2.1. Identification of High-Confidence Tr anslation Initiation
Sites. An initial goal of this analysis was to define sets
of high-confidence translation start sites whose TRII score
distributions could be used as standards for analysis of TRII
score distributions of other test sets. Previous studies have
tended to rely on “curated” gene sets to define training sets
of high-confidence translation initiation sites. Instead, we
developed a bioinformatics approach to identify large sets of
initiation sites in which we could have high confidence.
In prev ious studies [3, 4], we showed that progressive
partitioning of large genomic datasets can identify special
subsets of sequences with stronger conservation of sequence
motifs. For example, splice sites adjacent to longer introns
or exons have particularly high sequence conservation [3]. In
the current analysis, we studied a set of annotated translation
start sites (annAUGs) in 8,607 Drosophila cDNAs that were
sequenced by t he Berkeley Drosophila Genome Project [10–
12]. Partitioning this set of cDNAs based on the number of
upstream AUGs (upAUGs) present in the annotated 5
UTR
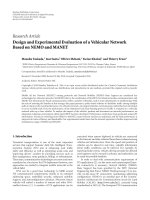
revealed a striking result (Figure 1). Relative information
levels near annAUGs are much higher in subsets of cDNAs
with fewer upAUGs. This is particularly pronounced, for
example, at nucleotide position
−3 (the 3rd nt upstream of
the AUG found at positions 1, 2 and 3; Figure 1). Consistent
with this result, the presence of upAUGs in 5
UTRs has been
associated previously with weak contexts of translation start
codons in sev eral organisms [13].
We hypothesized that the depressed relative informa-
tion levels at annAUGs associated with upAUGs might be
explained by the presence of annAUGs that are weak or
nonfunctional translation initiation sites. For example, weak
or nonfunctional annAUG sites might be expected if there
is translation initiation at upAUGs followed by translation
EURASIP Journal on Bioinformatics and Systems Biology 3
0
0.1
0.2
0.3
0.4
0.5
0.6
Relative information
Nucleotide position
−12 −10 −8 −6 −4 −21 3 5 7
(a)
0
0.1
0.2
0.3
0.4
0.5
0.6
0.7
−6 −5 −4 −3 −2 −1
Frequency
Nucleotide position
Acontent
0-upAUGs
All cDNAs
≥ 1
≥ 2
≥ 3
≥ 4
≥ 5
≥ 6
≥ 7
≥ 8
(b)
Figure 1: Progressive partitioning of annotated start sites based on number of upstream AUG codons. Nucleotide position −3 exemplifies
the elevation of relative information (a) and A content (b) with 0-upAUGs and the progressiv e decrease with higher numbers of upAUGs (
≥1
through
≥8). Nucleotide positions are numbered relative to the AUG which have relative information of 1.7, 2.0 and 2.2 bits, respectively,
(not shown). The following background frequencies in the 5
UTRs of 8,607 cDNAs were used in all figures: b(A) = 0.3064, b(C) = 0.2264,
b(G)
= 0.2189, and b(U) = 0.2483.
reinitiation [14–16] at annAUGs or downstream AUGs. To
investigate this further, the distributions of relative individ-
ual information scores were examined for subsets of cDNAs
with different numbers o f upAUGs. We assessed whether the
subsets of cDNAs with different numbers of upAUGs were
essentially a mixture of two classes of annAUGs: ( i) higher -
scoring, likely functional translation start sites and (ii) lower-
scoring, weak, or nonfunctional start sites.
The translation relative individual information (TRII)
scores were calculated using a reference set U
200
which we
4 EURASIP Journal on Bioinformatics and Systems Biology
0
0.05
0.1
0.15
0.2
0.25
Frequency
Relative individual information
−4
−2
02468101214
(a)
0
0.1
0.2
0.3
0.4
0.5
0.6
0.7
0.8
0.9
1
−4
−2
0 2 4 6 8 101214
Cumulative frequency
Relative individual information
0-upAUGs
Random AUG set
≥10 upAUGs
(b)
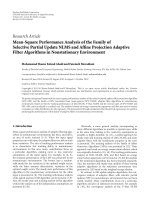
Figure 2: Relative individual information score distributions (a)
and corresponding cumulative distributions (b). The annAUGs of
the full set of cDNAs with 5
UTR ≥ 200 were used as a reference
set to construct the weight matrix for nucleotide positions
−20
to 20. Three test sets were compared: (i) 0upAUGs, 5
UTR ≥ 200
(red); (ii) 687 cDNAs with at least 10 upAUGs, 5
UTR ≥ 200
(blue); (iii) AUGs surrounded with random sequences conforming
to the 5
UTR background frequencies (grey). In this example, the
reference set U
200
includes the 0-upAUG test set (red); however, the
use of nonoverlapping reference and test sets is preferred (see text).
define as the set of cDNAs whose 5
UTRs contain at least 200
nucleotides (denoted 5
UTR ≥ 200; see Supplementary Table
6 for summary of sequence sets used in this study available
online at: doi:10.1155/2010/814127). Because ribosomes
are hypothesized to scan 5
UTRs to identify translation
initiation sites, we used the nucleotide frequencies in the
5
UTRs of a set of 8,607 cDNAs as background frequencies.
The weight matrix is based on these background frequencies
Table 1: UpAUG Analysis.
Number of
upAU Gs
∗
Number of
cDNAs
Random
curve (%)
∗∗
0-upAUG
curve (%)
1 502 6 94
2 o r 3 812 13 87
4 o r 5 695 24 76
6 to 9 487 31 69
≥10 687 51 49
∗
The annAUG TRII score distributions were computed for sets of cDNAs
with different numbers of upAUGs (see, e.g., Figure 2).
∗∗
Estimated fraction of cDNAs with random sequences in annAUG region,
computed using reconstruction of TRII score distributions (see Methods).
and nucleotide positions −20 to 20 relative to the annAUGs
in U
200
. This range of positions is used throughout the paper
to define weight matrices and to score test sequences.
We compared a control test set of cDNAs with no
upAUGs (0-upAUGs with 5
UTR ≥ 200) with a series of
test sets of cDNAs with increasing numbers of upAUGs
(and 5
UTR ≥ 200). To represent weak or nonfunctional
annAUGs, we generated the set S
rand
consisting of 5000
sequences with AUGs surrounded by random sequences (at
positions
−20 to −1 and 4 to 20) conforming to the 5
UTR
background nucleotide frequencies. Figure 2 illustrates, as
an example, the distribution of scores for the subset of 687
cDNAs with
≥10 upAUGs. Its distribution is slightly more
spread out (standard deviation
= σ = 2.66 bits) compared to
either the distributions of scores of the 0-upAUG test set (σ
= 2.04 bits) or the random sequence set (σ = 2.18 bits).
The shape of the score distribution for the test se t with
≥10 upAUGs suggests that the scores may represent a com-
bination of two overlapping distributions, a lower-scoring
set of weak or nonfunctional annAUGs (with scores similar
to the random AUG set), and a higher-scoring set of likely
functional annAUGs (repr esented by the 0-upAUG set). For
the test set w ith
≥10 upAUGs, a large fraction (approximately
one-half) of the annAUGs appears to be low scoring and
possibly nonfunctional (see Figure 2(a)). As expected from
Figure 1, analysis of the score distributions for test sets
with progressively more upAUGs shows progressively larger
fractions of low-scoring sites (Table 1).
The relative individual information distribution for the
0-upAUG set suggests it has the least contamination with
weak or nonfunctional annAU Gs, compared to sets of cDNAs
with upAUGs in their 5
UTRs (Figure 2 and data not shown).
We conclude that identification of 0-upAUG sets provides a
convenient informatics-based method for computing sets of
high-confidence translation initiation sites.
2.2. Optimizing the Choice of the Reference Set. These sets
of high-confidence translation initiation sites were used to
improve the TRII scoring approach in two ways: (i) to
modifytheweightmatricesthatunderpintheTRIIscoring
method, and (ii) to provide control test score distributions
for assessment of scores. We first discuss optimization of the
weight matrix. Up to this point, we have used U
200
the full set
of cDNAs with 5
UTR ≥ 200 as a reference set to construct
EURASIP Journal on Bioinformatics and Systems Biology 5
the weight matrix for computing relative individual infor-
mation scores. Because the 0-upAUG set consisting of 446
sequences appears to have least contamination with weak or
nonfunctional start annAUGs, we explored using it instead as
an optimized high-confidence reference set S
200
.Henceforth,
we reserve the notation S
200
and S
100–199
for 0-upAUG sets
with 5
UTRs ≥ 200 or between 100 and 199, respectively.
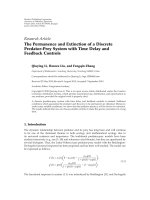
We observed that using 0-upAUG reference sets gives a
greater spread of relative individual information values—a
higher “dynamic range” of scores—compared to using the
set of all annAUGs as a reference set (Figure 3). The entries
in the 0-upAUG weight matrix are of greater magnitude;
hence, low-scoring annAUGs score lower because their
inappropriate nucleotide choices lead to more pronounced
negative weight contributions to the scor e, and high-scoring
annAUGs score higher because the weights are greater for
preferred nucleotides (compare weight matrices in Supple-
mentary Tables 3, 4 and 5). This suggests that either one
of the two purer 0-upAUG reference sets S
200
or S
100–199
is
preferable for constructing the weight matrix.
The use of 0-upAUG reference sets is supported by
our testing of the TRII score method in budding yeast
(Supplementary Figures 5 and 6 ). Protein expression and
ribosome densities have been measured for most yeast
genes [17, 18]. For highly expressed genes, we observed a
correlation between TRII scores and protein expression levels
or ribosome densities, and these correlations were stronger
when a 0 -upAUG reference set is used to compute the TRII
scores (see Supplementary Material S.6).
In the examples in Figure 3, the reference set R and the
test set T were chosen such that R
∩ T =∅. Indeed,
in choosing optimized reference sets, it is preferable if the
reference and test sets are disjoint. As described in the
Supplementary Material S.2.2, if R
⊂ T, then test sequences
in R have a slight scoring advantage compar ed to test
sequences in the complement T
\ R. Hence, in the analysis of
translation-start relative individual information (TRII) score
distributions described below (Figures 4–7) we tested sets of
cDNAs w ith 5
UTR ≥ 200, using as a weight matrix reference
set S
100–199
, the 1004 0-upAUG cDNAs with 5
UTRs between
100 and 199 in length.
2.3. Validating Control Test Distributions. Using the
improved weight matrices, we assessed the effectiveness
of using score distributions of 0-upAUG sets as control
test distributions for analysis of TRII scores. Comparisons
of 0-upAUG distributions with distributions for sets of
translation initiation sites from the Drosophila genome
project support the use of 0-upAUG sets as representative of
functional initiation sites. The Berkeley Drosophila Genome
Project ( BDGP) cDNA sequence set was constructed by
sequencing high-quality, full-length cDNA libraries. The
annotated ORFs and annAUGs were determined by finding
the longest ORF encoded by each cDNA. The sequenced
cDNAs (copies of mRNAs), which are part of the Drosophila
Genome Project, can be compared with the set of annotated
genes and their transcripts that has been assembled based
initially on gene prediction algorithms. A subset of the
cDNA ORFs that matched ORFs of annotated transcripts
in the Release 3 Drosophila genome were designated by
BDGP as a “Gold collection” [11]. Gold collection ORFs
were considered to be high-qualit y because t hey were both
predicted in the genome and found in cDNAs. Comparison
of the TRII score distributions for the full gold collection
of cDNAs w ith 5
UTR ≥ 200 (red curve, Figure 4(a))and
the full set of Release 5.9 predicted genes with 5
UTR ≥ 200
(green curve) reveals strikingly similar distributions. This
is consistent with gold collection cDNAs being viewed as
representative of current annotated gene models. The TRII
score distributions for the Gold collection and Release 5.9
predicted genes are both similar to the score distribution
for the 0-upAUG set of cDNAs (blue curve), except that
both have slightly greater frequencies of low-scoring start
sites. We partitioned the Gold set cDNAs with 5
UTR ≥
200 into two test subsets: those with no upAUGs, and those
with 1 or more upAUGs. The 300 0-upAUG cDNAs in
the Gold set have a distribution of TRII scores that is very
similar to the distribution of the scores using S
200
as a test
set (red and blue curves, respectively, Figure 4(b)). These
observations support the conclusion that the 0-upAUG
annAU Gs represent a high-confidence set of translation
initiation sites and that various sets of 0-upAUG sites
are appropriate to use for control test curves of TRII
scores.
In this analysis, we noticed a disparity between TRII score
distributions for experimentally observed cDNAs not in the
Gold collection compared to Gold collection cDNAs that
match predicted transcripts. TRII score distributions were
compared using chi-square goodness of fit tests (Supple-
mentary Material S.2.1). Various subsets of these “nongold”
cDNAs (Figure 4 ) with at least one upAUG showed many
more low-scoring annAUGs than their Gold counterparts,
even though the nongold cDNAs appear to represent authen-
tic mRNAs (see Figure 4 legend). The fact that nongold
cDNAs represent mRNAs not in the predicted transcriptome
suggests that the algorithms used to predict the Drosophila
transcriptome prior to incorporation of cDNA data were
conservative and f ailed to predict significant numbers of
experimentally observed transcripts including mRNAs w ith
upAUGs and low-scoring annAUGs.
2.4. Applications of Optimized TRII Scoring. We assessed
the optimized TRII scoring method by analyzing the dis-
tributions of several special sets of interest in order to (1)
assess upstream AUGs t hrough comparisons with control
distributions, and (2) assess nonconserved annAUGs using
linear comb inations of control curves.
2.4.1. Upstream AUGs. As noted previously, many cDNAs
have upAUGs in their 5
UTRs. We examined the TRII
score distribution for the set of first AUGs upstream of
the annAUG in gold collection cDNAs containing upAUGs
(with 5
UTR ≥ 200). The distribution of TRII scores (green
curve, Figure 5) was very similar to the random AUG set
distribution (grey curve) suggesting that the upAUGs are
generally weak or nonfunctional translation initiation sites.
6 EURASIP Journal on Bioinformatics and Systems Biology
0.16
0.14
0.12
0.1
0.08
0.06
0.04
0.02
0
ref
= all AUG 5
UTR 100 to 199
−7
−5 −3 −11 3 5
7
911
13
15
ref
= 0-upAUG 5
UTR 100 to 199
Frequency
Relative individual information
(a)
0
0.1
0.2
0.3
0.4
0.5
0.6
0.7
0.8
0.9
1
−7
−5 −3 −1
1
3
579
11 13
15
Cumulative frequency
Relative individual information
ref
= all AUG 5
UTR 100 to 199
ref
= 0-upAUG 5
UTR 100 to 199
(b)
0
0.02
0.04
0.06
0.08
0.1
0.12
0.14
0.16
0.18
0.2
−7 −5 −3 −1 1 3 5 7 9 11 13 15
Frequency
Relative individual information
ref
= 0-upAUG 5
UTR ≥ 200
ref = all cDNAs 5
UTR ≥ 200
(c)
0
0.1
0.2
0.3
0.4
0.5
0.6
0.7
0.8
0.9
1
−7 −5 −3 −113579111315
Cumulative frequency
Relative individual information
ref
= 0-upAUG 5
UTR ≥ 200
ref
= all cDNAs 5
UTR ≥ 200
(d)
Figure 3: Choice of weight matrix reference set. (a, b) The test set of 3470 annAUGs with 5
UTR ≥ 200 is displayed using two different
reference sets to construct weight matrices: (i) S
100-199
(blue) and ( ii) all cDNAs with 5
UTRs 100 to 199 (red). (c, d) Equivalent analysis
using a test set of 1922 annAUGs (5
UTRs 100 to 199) and the reference sets (i) S
200
(blue) and (ii) all cDNAs with 5
UTR ≥ 200 (red). In
both analyses, using the 0-upAUG reference set expands the range of relative individual information scores. (a, c) TRII score distributions.
(b, d) corresponding cumulative distributions.
Nucleotide position −3 plays a central role in defining
the consensus motif for translation initiation in Drosophila
(see the final section on defining motifs). We observed that
57.6% of the upAUGs have C or U at this position, in
contrast to only 7.6% of the annAUGs in the 0-upAUG
set. Given that 47.5% of random sequences have C or U at
this position (consistent with the background frequencies
in 5
UTRs of 22.6% and 24.8% for C and U, resp.), this
suggests that there may be some selection in favor of C or
U at this position to reduce the likelihood of translation
initiation at upAUGs. These observations suggest that the
random sequence set is an appropriate comparison set to
represent weak or nonfunctional AUGs in analysis of TRII
score distributions.
2.4.2. Nonconserved annAUGs. The TRII score distributions
for the 0-upAUG set of cDNAs and for the set of random
sequences provide useful control test curves for assessing
special sets of annAUGs. Linear combination of these control
curves can be useful in cases where experimental distri-
butions are intermediate between them. For example, we
measured TRII scores for a set of annAUGs considered highly
EURASIP Journal on Bioinformatics and Systems Biology 7
0
0.02
0.04
0.06
0.08
0.1
0.12
0.14
0.16
0.18
0.2
−7 −5 −3 −1 1 3 5 7 9 11 13 15 17
Frequency
Relative individual information
Gold annAUGs (1639)
Random (5000)
0-upAUG, annAUGs (446)
Predicted mRNAs 5
UTR ≥ 200 (8071)
(a)
0
0.02
0.04
0.06
0.08
0.1
0.12
0.14
0.16
0.18
0.2
−7 −5 −3 −1 1 3 5 7 9 11 13 15
17
Frequency
Relative individual information
Random (5000)
0-upAUG, annAUGs (446)
Intersection: gold and 0-upAUG, 5
UTR ≥ 200 (300)
≥1upAUG, not BDGP gold (1675)
≥1upAUG, BDGP gold (1349)
(b)
0
0.02
0.04
0.06
0.08
0.1
0.12
0.14
0.16
0.18
0.2
−7 −5 −3 −11357911131517
Frequency
Relative individual information
Random (5000)
0-upAUG, annAUGs (446)
≥1up ≥200 nongold annPreStop splice
model (922)
≥1up ≥200 nongold annPreStop splice model
wo polymorphisms (204)
(c)
Figure 4: TRII score distributions using S
100–199
as a reference set for the weight matrix. (a) The annAUGs of the set of 1,649 gold-set
cDNAs with 5
UTR ≥ 200 (red) have a similar TRII score distribution to the set of 8,071 predicted mRNAs in Release 5.9 with 5
UTR ≥ 200
(green). Both of these are similar to the distribution for 0-upAUG cDNAs (S
200
;blue),validatingS
200
as a control test distribution. (b) The
set S
200
(blue) and the subset of 300 gold-set 0-upAUG cDNAs (red) have similar score distributions. However, the set of 1,675 nongold-
set cDNAs with
≥1 upAUG (green) has a higher fraction of low-scoring cDNAs than the 1,349 gold-set cDNAs with ≥1 upAUG (purple)
(P<.01, chi-square goodness of fit). Given that nongold cDNAs represent mRNAs not in the predicted transcriptome, this suggests that
that algorithms used to predict the Drosophila transcriptome were conservative and failed to predict significant numbers of experimentally
observed transcripts including mRNAs with upAUGs and low-scoring annAUGs. (c) The conclusion in (b) is supported by analysis of subsets
of nongold cDNAs (
≥1 upAUG) that were aligned with genomic DNA using s plice site-scanning algorithms [ 3, 4], either allowing single-
nucleotide polymorphisms (992 cDNAs; red) or not (204 cDNAs; green). The distributions for both subsets and the full set (g reen curve in
(b)) are similar. Note that the cDNAs in both subsets all have a stop codon upstream and in-frame with the annAUG. Moreover, premature
termination by reverse transcriptase m ay apply to only a small fraction of these cDNAs: for 13 of the 204 cDNAs (green curve), the 5
end
of the cDNA matches an internal segment of a Release 5.9 predicted transcript, and the cDNA sequence lies downstream of the pr e dict ed
transcript’s start codon.
8 EURASIP Journal on Bioinformatics and Systems Biology
0
0.02
0.04
0.06
0.08
0.1
0.12
0.14
−7
−5 −3 −1 1 3 5 7 9 11 13 15 17
Frequency
Relative individual information
0.16
0.18
0.2
(a)
0
0.1
0.2
0.3
0.4
0.5
0.6
0.7
−7
−5 −3 13579111315
17
Cumulative frequency
Relative individual information
0.8
0.9
1
−1
Random (5000)
Gold annAUGs (1639)
Gold rank-1 upAUGs (1325)
0-upAUG, annAUGs (446)
(b)
Figure 5: UpAUGs have poor TRII scores. The score distributions
for the upAUG sequences of 1325 gold set cDNAs and the control
set S
rand
are similar. The first AUG upstream of the annAUG in each
cDNA was chosen for analysis.
likely to be misannotated (red curve, Figure 6). These suspect
annAUGs were marked for reannotation (Lin and Kellis,
personal communication [19–21]) because their annAUG
and downstream codons are not well conserved in 11 other
Drosophila species t hat have been sequenced. The TRII
score distribution for the suspect Drosophila melanogaster
annAUGs was compared with the score distributions for S
200
and S
rand
. The relative individual information scores were
calculated using the reference set S
100–199
.
As illustrated in Figure 6, the score distribution of the
suspect set of annAUGs shows some similarity to the dis-
tribution for random sequences surrounding the AUG. This
strongly supports the conclusion that many of the suspect
annAUGs are either w eak or nonfunctional translation
initiation sit es.
In order to estimate t he fraction of suspect annAUGs
with random-like sequence context, we used a curve recon-
struction approach. We compared the observed TRII score
0
0.02
0.04
0.06
0.08
0.1
0.12
0.14
0.16
−7 −5 −3 −1 1 3 5 7 9 11 13 15 17
Frequency
Relative individual information
0.18
0.2
(a)
Misannotation candidates (278)
Random (5000)
31% 0-up + 69% random
0
0.1
0.2
0.3
0.4
0.5
0.6
0.7
0.8
0.9
1
−7 −5 −3 −1 1 3 5 7 9 11131517
Cumulative frequency
Relative individual information
0-upAUG, annAUGs (446)
(b)
Figure 6: Testing misannotation candidates. TRII score distribu-
tions were examined for a set of 278 annAUGs that were likely to
be misannotated based on sequence comparisons in 12 Drosophila
species (red curve) [19–21]. Their score distribution (a) and
cumulative distribution (b) are shifted toward the corresponding
distributions for S
rand
. The misannotation candidates distribution
can be reconstructed by combining two distributions—0-upAUG
and random—in proportions 31% and 69%, respectively, (green
curve, see Methods).
distribution of the suspect set (Figure 6, red curve) to a
composite distribution (green curve) derived from the 0-
upAUG (blue) and random (grey) curves combined in a ratio
of 0.31 : 0.69. This ratio was chosen to minimize the sum of
squares of differences between the corresponding values in
the test (red) and composite (green) curves. Our analysis
suggests that approximately 70% of the suspect annAUGs
are misannotated or underannotated and about 30% are not
misannotated. Therefore, while the majority of genes are
correctly reannotated, some nonconserved annAUGs might
be reannotated inappropriately based upon conservation
assessment. This analysis illustrates the potential utility of
EURASIP Journal on Bioinformatics and Systems Biology 9
Table 2: Score thresholds.
P
∗
.05 .10 .50 .90 .95
TRIIthreshold
random
−1.67 −0.56 3.19 6.82 7.75
TRIIthreshold
0upAUG
3.71 4.89 8.40 10.74 11.27
∗
P is the probability of obtaining the indicated TRII score or a lower score.
reconstructing TRII score distributions as a linear combi-
nation of distributions for high-confidence (0-upAUG) and
random sequences.
2.5. Estimating Confidence Intervals Using TRII Scores. The
preceding analysis has established an optimized TRII scoring
method and suggested that score distributions for 0-upAUG
and random sequence sets provide valuable control test
curves for a ssessing score distributions. In the next part of
this study, we extended the interpretation of these control
distributions. Because the y can be used to represent high-
confidence and weak or nonfunctional translation initiation
sites, respectively, the control distributions can be treated
as probability distributions to assess individual or groups
of scores. Ta ble 2 illustrates TRII scores corresponding to
several probability thresholds for the score distributions of
the random and 0-upAUG control test sets. If we consider
the 0-upAUG set as representative of functional annAUGs,
then we expect 95% of TRII scores to be above 3.7 bits, and
only 5% to be below this threshold. Hence, an annAUG
with a TRII score below 3.7 bits can be considered as weak
or nonfunctional with 95% confidence. Comparison with
the random sequence score distribution suggests that 95%
of nonfunctional AUGs are expected to have scores below
7.7 bits. Hence, an AUG with a score above 7.7 bits can be
considered as functional with 95% confidence. These two
values define the confidence interval illustrated in Figure 7
(grey interval). The AUGs with scores between 3.7 and
7.7 bits may be either functional or nonfunctional. For
example, for a TRII score threshold of 5.0, there are 85%
of high-confidence start sites above this threshold (85%
sensitivity), and 79% of random sequences are below this
threshold (79% specificity; see Tab l e 3 below). As discussed
in Supplementary Material S.2.2, individual TRII scores can
generally be considered reliable to within 0.6 to 0.8 bits.
In our analysis above of annAUGs that were flagged
as possibly misannotated due to poor conservation across
species (Figure 6), 40% of the suspect annAUGs had scores
below 3.7 bits, and only 19% of the suspect annAUGs
have scores above 7.7 bits. The remaining 41% of the
annAUGs had scores in the confidence interval between these
thresholds.
The weight matrix used to calculate the TRII scores
is provided in Supplementary Material S.3 and may be
used to calculate scores for any AUG of interest. The TRII
scores can also be calculated using a graphical user interface
found at > Databases and Tools >
Information Theoretic Analysis (see Methods). The set of
reference sequences S
100–199
used to construct the weight
matrix is provided in Supplementary Material S.1. The TRII
0
0.02
0.04
0.06
0.08
0.1
0.12
0.14
0.16
0.18
0.2
−7 −5 −3 −1 1 3 5 7 9 11 13 15 17
Frequency
Relative individual information
3.7
7.7
(a)
0
0.1
0.2
0.3
0.4
0.5
0.6
0.7
0.8
0.9
1
−7 −5 −3 −1 1 3 5 7 9 11 13 15 17
Cumulative frequency
Relative individual information
3.7
7.7
Random (5000)
0-upAUG, annAUGs (446)
(b)
Figure 7: Scoring thresholds. The TRII score distribution (blue
curve) for the high-confidence set of translation initiation sites
S
200
can be used as a reference curve for assessing translation
start sites. Because 95% of the scores are higher than 3.7 b its, a
score below this threshold can be considered nonconforming, and
potentially weak or nonfunctional, with 95% confidence (red bar
region). The score distribution (grey curve) for S
rand
shows 95% of
scores below 7.7 bits. Scores above this threshold can be considered
likely translation start sites with 95% confidence (green bar region).
Scores between 3.7 and 7.7 could be functional or nonfunctional. In
all cases, scores were calculated using the reference set S
100–199
.
scores for annAUGs of all predicted transcripts in the Release
5.9 Drosophila melanogaster genome are also provided in
Supplementary Material S.1.
In Ta ble 3(a), we extend the analysis presented in Ta ble 2
and Figure 7 to estimate the conditional probabilities, based
on the distribution of TRII scores for S
200
,thatatest
sequence is a start site if it has a given TRII score or
lower. Similarly, in Tabl e 3(b), we estimate the conditional
probabilities that a test sequence is random, and therefore
weak or nonfunctional, if it has a given TRII score or
higher. The latter conditional probabilities are based on the
distribution of TRII scores for S
rand
.Tables3(a) and 3(b)
provide a convenient summary for interpreting the TRII
scores in Supplementary Material S.1.
10 EURASIP Journal on Bioinformatics and Systems Biology
Table 3: Conditional probabilities for classification.
(a)
s P(start)
1
≤−5.00
−4.00
−3.00
−2.00
−1.01
0.02
1.02
2.02
3.04
4.07
5.15
6.25
7.36
8.49
9.66
10 .82
11 .92
12 .97
≥13 1.00
1
P(start site | TRII score ≤ s).
(b)
s P(random)
2
≤−51.00
−4.99
−3.98
−2.94
−1.90
0.82
1.72
2.60
3.46
4.33
5.21
6.12
7.06
8.03
9.01
10 .00
11 .00
12 .00
≥13 .00
2
P(random sequence | TRII score ≥ s).
The significant overlap in the TRII score distributions
for random sequences and high-confidence initiation sites
makes it necessary to treat intermediate TRII scores proba-
bilistically as d iscussed above. Even though the distributions
overlap,theTRIIscoremeasurecancontributetofuture
algorithms for assessment of translation initiation in combi-
nation with other classifiers that incorporate properties such
as RNA structure prediction [22] and sequence co nservation
[20].
The methods discussed to optimize TRII scoring—the
utilization of high-confidence sets and probabilistic analysis
of score distributions—can also be applied to the initiation
context scoring method of Miyasaka [8]. The latter method
has been used, for example, to predict and score translation
initiation sites in a recent ribosome profiling study based on
deep sequence analysis in yeast [9]. The Miyasaka method
differs significantly from the TRII scoring approach since
it uses a weight matrix of nucleotide frequency ratios com-
puted relative to the frequency of the single most abundant
nucleotide at each position. In contrast, each weight matrix
entry for TRII scoring is the log of the nucleotide frequency
at a position relative to the background frequency for
that nucleotide (4). Both scoring methods give analogous
score distributions for S
200
and S
rand
allowing probabilistic
assessment of scores (data not shown). How ever, the TRII
scoring method has the advantage that it measures more
transparently the deviations from background nucleotide
frequencies that have been selected during evolution of
functional sites.
2.6. Defining Motifs Using a Consensus Matrix. In addition
to optimizing the TRII scoring method, the 0-upAUG
high-confidence sets were u s ed to improve assessment of
nucleotide preferences at translation initiation sites. In
particular, the optimized high-confidence sets of annotated
translation start sites were used to assess sequence conser-
vation at initiation sites and to compare this conservation
with previous descriptions of consensus sequences [23, 24].
Figure 8 shows the nucleotide frequencies and corresponding
relative information profiles for an optimized 0-upAUG set
consisting of S
200
from which the 22 sequences (5%) with
lowest TRII scores have been excluded to remove outliers.
These excluded sequences contain some start sites with
negative individual information scores that are postulated to
be nonfunctional based on thermodynamic considerations
[25]. The relative information profile (Figure 8(b))shows
that in addition to the high relative information (relative
entropy) at the AUG, there is also significant relative
information at positions
−4to−1, in particular at −3. There
is also elevated relative information at positions 4 and 5
(positions d ownstream of 5 are discussed later).
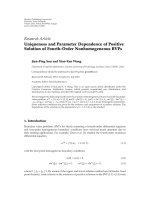
This optimized 0-upAUG set (Figure 8)wasused
to create a weight matrix consisting of the values
[log
2
( f
p
(α)/b(α)) − γ | α = A, C, G, or U, 1 ≤ p ≤ m;
compare with (4)] that illustrates which nucleotide choices
are particularly important in the translational initiation sites
(Figure 9). The weights
≥0.5 are indicated in blue and the
weights
≤−0.5 are indicated in red. These thresholds can
be used to compute a consensus matrix as illustrated in
Figure 9. The nucleotide choices with weights
≥0.5 define the
following consensus sequence for translation initiation:
Consensus
0.5
= CAACAUGG
(
C | G
)
,(5)
EURASIP Journal on Bioinformatics and Systems Biology 11
0
0.1
0.2
0.3
0.4
0.5
−20 −18 −16 −14 −12 −10 −8 −6 −4 −2 1 3 5 7 9 11 13 15 17 19
Frequency
Nucleotide position
FreqA
FreqC
FreqG
FreqT
0.6
0.7
0.8
0.9
1
(a)
Nucleotide position
Relative information
2
1.5
1
0.5
0
2.5
−20 −18 −16 −14 −12 −10 −8 −6 −4 1 3 5 7 9 1113151719−2
2
1.5
1
0.5
0
−4 −3 −2 −1123456
(c)
(b)
Figure 8: Nucleotide frequencies and relative information. (a) Nucleotide frequencies are graphed for S
200
excluding 22 (5%) of these
sequences with relative individual information scores below 3.71 bits. (b) Relative information gr aph for the same set of cDNAs. Note the
relative information at nucleotide position
−3 where C and U are depressed, and A is elevated. ( c) The positional logo for positions −4to6
is illustrated. Figure 9 shows the corresponding weight matrix.
where (C | G) denotes “C or G”. This consensus is similar
to that described earlier for Drosophila translation start sites
[26, 27]. However, Cavener describes A as the consensus
nucleotide for position
−1. While A is slightly more abun-
dant at this position (Figure 8(a)), when compared to the
background frequencies of 5
UTRs, the elevation in C at this
position is more pronounced (Figure 9). This suggests that a
ribosome scanning a 5
UTR favors a C at this position.
The preceding ap proach for defining a consensus
sequence does not take into account the importance of the
absence of nucleotides at certain positions—those nucleotide
choices that receive a weight
≤−0.5 (red in Figure 9 ). For
example, U should be avoided at any position
−4to−1.
The disruptive effect on translation initiation of having U
at position
−3 has been noted before [28, 29]. Hence, as
summarized in Figure 9, a more useful description of t he
consensus would be
Consensus
0.5, −0.5
= C \U A\
(
C
|U
)
A\
(
G
|U
)
C\U AUG G\C
(
C |G
)
,
(6)
where A
\(G | U) denotes “A and not G and not U”. Using
this approach, a weight log
2
( f
p
(α)/b(α)) ≥ 0.5indicates
that f
p
(α)/b(α) ≥ 1.41 an d a weight ≤−0.5 indicates that
f
p
(α)/b(α) ≤ 0.71. Hence, the “consensus” that is defined
represents nucleotides whose frequencies are at least 1.41
12 EURASIP Journal on Bioinformatics and Systems Biology
−0.08 1.17 0.71 0.30 1.70 −9.03 −9.03 −0.11 −0.37 −1.50
0.93
−2.66 0.32 0.52 −8.59 −8.59 −8.59 −0.75 0.81 0.68
−0.49 0.23 −1.04 −0.05 −8.54 −8.54 2.18 0.78 −0.29 0.52
−1.05 −4.08 −1.20 −1.59 −8.73 2.00 −8.73 −0.30 −0.44 −0.23
0 110 1 0000
−1
1
−1 0 1 000−1 11
00
−1 0001 1 0 1
−1 −1 −1 −1 0 1 0000
0.18 0.72 0.21 0.15 1.71 2.01 2.19 0.11 0.11 0.21
CAACAUGGCC,G
ACUG,UC,UU
nucleotide
position
−4 −3 −2 −11 2 3 4 5 6
WEIGHT
MATRIX
A
C
G
U
A
C
G
U
relative
information
consensus
not
CONSENSUS
MATRIX
Figure 9: Weight and consensus matrices. Weights show values used to calculate relative individual scores. Each weight was calculated
using the expression log
2
( f
p
(α)/b(α)) − γ where f
p
(α) is the observed frequency, b(α) is the background frequency, and γ is the sampling
correction. To calculate TRII scores, the weights corresponding to the nucleotide present at each position in a sequence are summed. The
observed frequencies are derived from S
200
, excluding 22 (5%) of these sequences with relative individual information scores below 3.71 bits.
The background frequencies are calculated from the 5
UTRs of 8,607 cDNAs. Color Coding: Blue (weight ≥ 0.5), Red (weight ≤−0.5),
Green (fixed AUG).
fold higher than their background frequency. Similarly, the
“not N” consensus choices have frequencies that are at least
1.41 fold lower than background. Defining the consensus
measure based on deviations from background frequencies
provides a natural indication of the nucleotide preferences
of the translation machinery. Indeed, the most pronounced
deviations are for C and U at position
−3 (6.5 and 17.7 fold
lower than background, resp.), indicating that the presence
of either of these pyrimidine nucleotides at this position is
particularly deleterious, and that their exclusion is one of the
key hallmarks of a functional translation initiation site.
Examining the region downstream of nucleotide position
5 reveals that relative information values are elevated at
positions 6, 9, 15, and 18. As discussed pr eviously [30, 31],
a 3-base periodicity is characteristic of open reading frames.
Relative information is elevated at each of these positions,
because A is depressed, and C and G are elevated (see
Figure 9 position 6, Figure 8, and Supplementary Tables
3 and 4). The per iodic elevation of relative information
and the corresponding weights indicate that these positions
positively contribute to the translation-start relative indi-
vidual information (TRII) scores. Indeed, if TRII scores are
calculated using positions
−20 to 40 (data not shown), the
distribution of scores is shifted to the right, and the scoring
is better able to distinguish between the 0-upAUG control
test set and sets of putative nonfunctional start sites (e.g.,
the set in Figure 6 discussed above). Statistical analysis of
weight matrices is described in Supplementary Material S.3
and Supplementary Table 2.
Note that each expression log
2
( f
p
(α)/b(α)) represents the
log of the p robability that a given nucleotide α will occur
relative to its background probability , and the summing of
these log terms represents the product of these probabilities
which is the overall probability of a given individual sequence
(the TRII score without a sampling correction). Hence, the
weight matrix captures the essence of the consensus notion
from a probability perspective.
Using a weight matrix to represent a consensus sequence
is a natural extension of Schneider and colleagues’ use of the
weight matrix for sequence walkers [32–34]. The positional
weight matrix (Figure 9) provides a fuller view of the
consensus than the sequence logo format (Figure 8(c)) which
is commonly used to represent a sequence consensus. Unlike
a sequence logo, the positional weight matrix explicitly
conveys deviations from background frequencies showing
when nucleotides are underrepresented (negative matrix
entries) or overrepresented (positive entries).
3. Conclusions
A TRII scoring method based on high-confidence translation
initiation sites has been developed to assess translation
initiation sites. The 0-upAUG high-confidence sets are used
to compute the TRII scoring weight matrix as well as to
provide control test curves which, in addition to random
sequence score d istributions, allow for probabilistic assess-
ment of individual TRII scores. In addition, comparison with
control test curves gives powerful methods to analyze TRII
score distributions for groups of translation initiation sites
of special interest. The 0-upAUG high-confidence sets also
provide improved quantitativ e descriptions of the consensus
motif for translation initiation in Drosophila. TRII score
analysis of cDNAs containing upAUGs suggests that further
experimental analysis of this class of cDNAs is warranted to
assess their a nnotated translation initiation sites.
4. Methods
4.1. Translation Relative Individual Information (TRII) Scor-
ing. The collections of genomic and cDNA sequences were
EURASIP Journal on Bioinformatics and Systems Biology 13
stored in a relational database. The database schema is
illustrated in Supplementary Figure 4. Information-theoretic
calculations were performed using a variety of stored
procedures in the database. A listing of the control test set
of 0-upAUG start sites at positions
−20 to 20 in sequences
with 5
UTRs ≥ 200, and their relative individual information
( TRII) scores, are provided in Supplementary Material S.1.2.
These TRII scores are based on using the reference set
S
100–199
.
As described in the Introduction, relative individual
information was calculated using the expression
Score
b
(
s
)
=
⎧
⎨
⎩
log
2
⎛
⎝
f
p
s
p
b
s
p
⎞
⎠
−
γ | 1 ≤ p ≤ m
⎫
⎬
⎭
,(7)
where the sampling correction γ was estimated as described
previously [3, 4] assuming background frequencies of 0.25
for each nucleotide. In particular, we used t he theoretical
estimate of γ
= 1.5/(ln(2) ∗ n)forn>125. If the actual
5
UTR background frequencies are used to estimate γ,the
value increases by less than 0.00003 for n>250.
4.2. Reconstruction of TRII Score Distributions. We estimate d
the fraction f
a
of AUG sites in a test set that were similar to
optimized translation initiation sites and therefore l ikely to
be functional (see, e.g., Figure 6) as follows: given 0 <f<1,
construct a new distribution using the values f
∗D
optimal
(b)+
(1
− f ) ∗ D
random
(b), where D
optimal
and D
random
denote two
TRII score distributions, and b represents an individual score
(of a bin). Then choose the fraction f
a
that minimizes the
sum of the differences squared between these values and
the values of the actual test set distribution D
test
. For our
computations, the distribution D
random
was based on the
scores for S
rand
and D
optimal
wasbasedonthescoresforU
200
(Table 1)orS
200
(Figure 7).
4.3. Information Calculator. We prov ide a web interface
for performing calculations on sets of inputed aligned
sequences ( > Databases and Tools).
The interface generates a weight matrix from the aligned
sequences so that relative information values and relative
individual information scores can be calculated for sequences
of interest. The interface can be used to assess potential
translation initiation sites, or other kinds of motifs for which
sets of aligned sequences with the motif are available.
List of Abbreviations
TRII: Translation relative individual information
ORF: Open reading frame
BDGP: Berkeley drosophila genome project
upAUG: Upstream AUG
annAUG: Annotated AUG
UTR: U ntranslated region.
Acknowledgments
The authors thank Robert Lane, William Gladstone, Laurel
Appel, and Adam Robbins-Pianka for careful reading of the
paper, Rob Stewart, William Gladstone, and Adam Robbins-
Pianka for programming contributions, and Michael Lin
and Manolis Kellis for communication of unpublished
data. This work was supported in part by funds from the
Howard Hughes Medical Institute to support undergraduate
initiatives in the life sciences.
References
[1] T. L. Bailey, M. Boden, F. A. Buske et al., “MEME Suite: tools
for motif discovery and searching,” Nucleic Acids Research,vol.
37, no. 2, pp. W202–W208, 2009.
[2] R. M. Stephens and T. D. Schneider , “Features of spliceosome
evolution and function inferred from an analysis of the
information a t human splice sites,” Journal of Molecular
Biology, vol. 228, no. 4, pp. 1124–1136, 1992.
[3] M. Weir, M. Eaton, and M. Rice, “Challenging the spliceosome
machine,” Genome Biology, vol. 7, no. 1, ar ticle R3, 2006.
[4] M. Weir and M. Rice, “Ordered partitioning reveals extended
splice-site consensus information,” Genome Research, vol. 14,
no. 1, pp. 67–78, 2004.
[5] C. Burge and S. Karlin, “Prediction of complete gene struc-
tures in human genomic DNA,” Journal of Molecular Biology,
vol. 268, no. 1, pp. 78–94, 1997.
[6] C. E. Shannon and W. Weaver, The Mathematical Theory of
Communication, University of Illinois Press, Urbanam, Ill,
USA, 1949.
[7] T. D. Schneider and J. Spouge, “Information content of
individual genetic sequences,” Journal of Theoretical Biology,
vol. 189, no. 4, pp. 427–441, 1997.
[8] H. Miyasaka, “The positive relationship between codon usage
bias and translation initiation AUG context in Saccharomyces
cerevisiae,” Yeast, vol. 15, no. 8, pp. 633–637, 1999.
[9]N.T.Ingolia,S.Ghaemmaghami,J.R.S.Newman,andJ.S.
Weissman, “Genome-wide analysis in vivo of translation with
nucleotide resolution using ribosome profiling,” Science,vol.
324, no. 5924, pp. 218–223, 2009.
[10] BDGP, Berkeley Drosophila Genome Project, 2002.
[11] M. Stapleton, J. Carlson, P. Brokstein et al., “A Drosophila full-
length cDNA resource,” Genome Biology,vol.3,no.12,pp.
research0080.1–research0080.8, 2002.
[12] M. Stapleton, G. Liao, P. Brokstein et al., “The Drosophila
gene collection: identification of putative full-length cDNAs
for 70% of D. melanogaster genes,” Genome Research,vol.12,
no. 8, pp. 1294–1300, 2002.
[13] I. B. Rogozin, A. V. Kochetov, F. A. Kondrashov, E. V. Koonin,
and L. Milanesi, “Presence of ATG triplets in 5
untranslated
regions of eukaryotic cDNAs correlates with a ‘weak’ context
of the start codon,” Bioinformatics, vol. 17, no. 10, pp. 890–900,
2001.
[14] A. G. Hinnebusch, B. M. Jackson, and P. P. Mueller, “Evidence
for regulation of reinitiation in translational control of GCN4
mRNA,” Proceedings of the National Academy of Sciences of the
United States of America, vol. 85, no. 19, pp. 7279–7283, 1988.
[15] A. V. Kochetov, “Alternative translation start sites and hidden
coding potential of eukaryotic mRNAs,” BioEssays, vol. 30, no.
7, pp. 683–691, 2008.
[16] M. Kozak, “Constraints on reinitiation of translation in
mammals,” Nucleic Acids Research, vol. 29, no. 24, pp. 5226–
5232, 2001.
[17] S. Ghaemmaghami, W K. Huh, K. Bower et al., “Global
analysis of protein expression in yeast,” Nature, vol. 425, no.
6959, pp. 737–741, 2003.
14 EURASIP Journal on Bioinformatics and Systems Biology
[18] N. T. Ingolia, S. Ghaemmaghami, J. R. S. Newman, and J. S.
Weissman, “Genome-wide analysis in vivo of translation with
nucleotide resolution using ribosome profiling,” Science,vol.
324, no. 5924, pp. 218–223, 2009.
[19] A. G. Clark, M. B. Eisen, D. R. Smith et al., “Evolution of genes
and genomes on the Dr osophila phylogen y,” Nature, vol. 450,
no. 7167, pp. 203–218, 2007.
[20] M. F. Lin, J. W. Carlson, M. A. Crosby et al., “Revisiting the
protein-coding gene catalog of Drosophila melanogaster using
12 fly genomes,” Genome Research, vol. 17, no. 12, pp. 1823–
1836, 2007.
[21] A. Stark, M. F. Lin, P. Kheradpour et al., “Discovery of func-
tional elements in 12 Drosophila genomes using evolutionary
signatures,” Nature, vol. 450, no. 7167, pp. 219–232, 2007.
[22] M. Kozak, “Regulation of translation via mRNA structure in
prokaryotes and eukaryotes,” Gene, vol. 361, no. 1-2, pp. 13–
37, 2005.
[23] M. Kozak, “Initiation of translation in prokaryotes and
eukaryotes,” Gene, vol. 234, no. 2, pp. 187–208, 1999.
[24] M. Kozak, “A progress report on translational control in
eukaryotes,” Science’s STKE, vol. 2001, no. 71, p. pe1, 2001.
[25] R. K. Shultzaberger, L. R. Roberts, I. G. Lyakhov et al.,
“Correlation between binding rate constants and individual
information of E. coli Fis binding sites,” Nucleic Acids Research,
vol. 35, no. 16, pp. 5275–5283, 2007.
[26] D. R. Cavener, “Comparison of the consensus sequence flank-
ing translational start sites in Drosophila and vertebrates,”
Nucleic Acids Research, vol. 15, no. 4, pp. 1353–1361, 1987.
[27] D. R. Cavener and S. C. Ray, “Eukaryotic start and stop
translation sites,” Nucleic Acids Research, vol. 19, no. 12, pp.
3185–3192, 1991.
[28] Y. Feng, L. E. Gunter, E. L. Organ, and D. R. Cavener,
“Translation initiation in Drosophila melanogaster is reduced
by mutations upstream of the AUG initiator codon,” Molecular
and Cellular Biology, vol. 11, no. 4, pp. 2149–2153, 1991.
[29] M. Kozak, “An analysis of 5
-noncoding sequences from 699
vertebrate messenger RNAs,” Nucleic Acids Research, vol. 15,
no. 20, pp. 8125–8148, 1987.
[30] C. Yin and S. S T. Yau, “A Fourier characteristic of coding
sequences: or ig ins and a non-Fourier approximation,” Journal
of Computational Biology, vol. 12, no. 9, pp. 1153–1165, 2005.
[31] J. W. Fickett, “Recognition of protein coding regions in DNA
sequences,” Nucleic Acids Research, vol. 10, no. 17, pp. 5303–
5318, 1982.
[32]S.Gadiraju,C.A.Vyhlidal,J.S.Leeder,andP.K.Rogan,
“Genome-wide pr ediction, display and refinement of binding
sites with information theory-based models,” BMC Bioinfor-
matics, vol. 4, article 38, 2003.
[33] T. D. Schneider, “Sequence walkers: a graphical method to
display how binding proteins interact with DNA or RNA
sequences,” Nucleic Acids Research, vol. 25, no. 21, pp. 4408–
4415, 1997.
[34] T. D. Schneider, “Consensus sequence Zen,” Appl Bioinformat-
ics, vol. 1, no. 3, pp. 111–119, 2002.
Photographȱ©ȱTurismeȱdeȱBarcelonaȱ/ȱJ.ȱTrullàs
Preliminaryȱcallȱforȱpapers
The 2011 European Signal Processing Conference (EUSIPCOȬ2 0 1 1 ) is the
nineteenth in a series of conferences promoted by the European Association for
Signal Processing (EURASIP, www.eurasip.org). This year edition will take place
in Barcelona, capital city of Catalonia (Spain), and will be jointly organized by the
Centre Tecnològic de Telecomunicacions de Catalunya (CTTC) and the
Universitat Politècnica de Catal unya (UPC).
EUSIPCOȬ2011 will focus on key aspects of signal processing theory and
li ti
li t d
b l
A t
f
b i i
ill
b
b d
lit
OrganizingȱCommittee
HonoraryȱChair
MiguelȱA.ȱLagunasȱ(CTTC)
GeneralȱChair
AnaȱI.ȱPérezȬNeiraȱ(UPC)
GeneralȱViceȬChair
CarlesȱAntónȬHaroȱ(CTTC)
TechnicalȱProgramȱChair
XavierȱMestreȱ(CTTC)
Technical Program Co
Ȭ
Chairs
app
li
ca
ti
ons as
li
s
t
e
d
b
e
l
ow.
A
ccep
t
ance o
f
su
b
m
i
ss
i
ons w
ill
b
e
b
ase
d
on qua
lit
y,
relevance and originality. Accepted papers will be published in the EUSIPCO
proceedings and presented d uring the conference. Paper submissions, proposals
for tutorials and proposals for special sessions are invited in, but not limited to,
the following areas of interest.
Areas of Interest
• Audio and electroȬacoustics.
• Design, implementation, and applications of signal processing systems.
l d
l
d
d
Technical
ȱ
Program
ȱ
Co
Chairs
JavierȱHernandoȱ(UPC)
MontserratȱPardàsȱ(UPC)
PlenaryȱTalks
FerranȱMarquésȱ(UPC)
YoninaȱEldarȱ(Technion)
SpecialȱSessions
IgnacioȱSantamaríaȱ(Unversidadȱ
deȱCantabria)
MatsȱBengtssonȱ(KTH)
Finances
Montserrat Nájar (UPC)
• Mu
l
time
d
ia signa
l
processing an
d
co
d
ing.
• Image and multidimensional signal processing.
• Signal detection and estimation.
• Sensor array and multiȬchannel signal processing.
• Sensor fusion in networked systems.
• Signal processing for communications.
• Medical imaging and image analysis.
• NonȬstationary, nonȬlinear and nonȬGaussian si gnal processing
.
Submissions
Montserrat
ȱ
Nájar
ȱ
(UPC)
Tutorials
DanielȱP.ȱPalomarȱ
(HongȱKongȱUST)
BeatriceȱPesquetȬPopescuȱ(ENST)
Publicityȱ
StephanȱPfletschingerȱ(CTTC)
MònicaȱNavarroȱ(CTTC)
Publications
AntonioȱPascualȱ(UPC)
CarlesȱFernándezȱ(CTTC)
I d i l Li i & E hibi
Submissions
Procedures to submit a paper and proposals for special sessions and tutorials will
be detailed at www.eusipco2011.org
. Submitted papers must be cameraȬready, no
more than 5 pages long, and conforming to the standard specified on the
EUSIPCO 2011 web site. First authors who are registered students can participate
in the best student paper competition.
ImportantȱDeadlines:
P l f i l i
15 D 2010
I
n
d
ustr
i
a
l
ȱ
Li
a
i
sonȱ
&
ȱ
E
x
hibi
ts
AngelikiȱAlexiouȱȱ
(UniversityȱofȱPiraeus)
AlbertȱSitjàȱ(CTTC)
InternationalȱLiaison
JuȱLiuȱ(ShandongȱUniversityȬChina)
JinhongȱYuanȱ(UNSWȬAustralia)
TamasȱSziranyiȱ(SZTAKIȱȬHungary)
RichȱSternȱ(CMUȬUSA)
RicardoȱL.ȱdeȱQueirozȱȱ(UNBȬBrazil)
Webpage:ȱwww.eusipco2011.org
P
roposa
l
sȱ
f
orȱspec
i
a
l
ȱsess
i
onsȱ
15
ȱ
D
ecȱ
2010
Proposalsȱforȱtutorials 18ȱFeb 2011
Electronicȱsubmissionȱofȱfullȱpapers 21ȱFeb 2011
Notificationȱofȱacceptance 23ȱMay 2011
SubmissionȱofȱcameraȬreadyȱpapers 6ȱJun 2011