Báo cáo hóa học: " Research Article An IEEE 802.11 EDCA Model with Support for Analysing Networks with Misbehaving Nodes" ppt
Bạn đang xem bản rút gọn của tài liệu. Xem và tải ngay bản đầy đủ của tài liệu tại đây (1.56 MB, 13 trang )
Hindawi Publishing Corporation
EURASIP Journal on Wireless Communications and Networking
Volume 2010, Article ID 209895, 13 pages
doi:10.1155/2010/209895
Research Article
An IEEE 802.11 EDCA Model with Support for
Analysing Networks with Misbehaving Nodes
Szymon Szott, Marek Natkaniec, and Andrzej R. Pach
Department of Telecommunications, AGH University of Sc ience and Technology, Al. Mickiewicza 30, 30-059 Krakow, Poland
Correspondence should be addressed to Szymon Szott,
Received 22 June 2010; Revised 12 August 2010; Accepted 9 November 2010
Academic Editor: David Laurenson
Copyright © 2010 Szymon Szott et al. This is an open access article distributed under the Creative Commons Attribution License,
which permits unrestricted use, distribution, and reproduction in any medium, provided the original work is properly cited.
We present a novel model of IEEE 802.11 EDCA with support for analysing networks with misbehaving nodes. In particular, we
consider backoff misbehaviour. Firstly, we verify the model by extensive simulation analysis and by comparing it to three o ther
IEEE 802.11 models. The results show that our model behaves satisfactorily and outperforms other widely acknowledged models.
Secondly, a comparison with simulation results in several scenarios with misbehaving nodes proves that our model perform s
correctly for these scenarios. The proposed model can, therefore, be considered as an original contribution to the area of EDCA
models and backoff misbehaviour.
1. Introduction
The IEEE 802.11 standard [1] for wireless local area networks
(WLANs) does not provide users with incentives to coop-
erate when accessing the shared radio channel. Therefore,
misbehaviour, in the form of selfish parameter configuration,
may become a serious problem. This is in particular true
for Enhanced Distributed Channel Access (EDCA), one
of the medium access functions of IEEE 802.11. EDCA
provides Quality of Service (QoS) for WLANs through traffic
differentiation. It defines new medium access parameters
and, therefore, new opportunities to misbehave.
Misbehaviour in EDCA can occur by deliberately chang-
ing the medium access parameters defined in the standard
in order to increase the chance of accessing the medium
and, as a result, increase the misbehaving node’s effective
throughput. Though several parameters may be modified,
we focus on changes to the backoff parameters (known
as backoff misbehaviour) because this method is the most
difficult to detect. B ackoff misbehaviour is hidden from
detection schemes working at the network layer and can
be combined with misbehaviour in upper layers. It is easy
to perform because the medium access function, which
governs the backoff procedure, can be modified through the
wireless card driver. The latest drivers, for example, [2], allow
changing these parameters through the command line. Even
equipment vendors can make nonstandard modifications to
increase the performance of their cards [3]. As numerous
studies have shown, backoff misbehaviour is a serious threat
for WLANs [4–6].
In this paper, we focus on the analytical model ling of
EDCA networks with misbehaving nodes. Even though many
EDCA models have already b een presented in the literature
(e.g., [7, 8]) none have studied misbehaviour. Furthermore,
papers such as [9–12] use IEEE 802.11 models to study
networks with misbehaving nodes; however, these are models
of the Distributed Coordination Function (DCF), the prede-
cessor of EDCA. Therefore, a new analytical model of EDCA
is presented to study the impact of misbehaving nodes on
network performance.
Our EDCA model is distinguished by the following set of
features:
(i) support for the analysis of backoff misbehaviour,
(ii) support for saturation and nonsaturation network
conditions,
(iii) standard-compliant EDCA parameters,
(iv) proper handling of frames (i.e., each transmission
attempt results in either a success,acollision or a
blocked medium),
(v) Arbitration InterFrame Space (AIFS) differentiation,
2 EURASIP Journal on Wireless Communications and Networking
(vi) distinguishing between the busy medium and frame
blocking probabilities.
We believe that this set of features as a whole is unique
and provides an original contribution to the area of EDCA
models and backoff misbehaviour. We verify the model by
simulations and show that it outperforms three other IEEE
802.11 models. The presented model can be used in game
theoretical analysis of IEEE 802.11 networks with misbe-
having nodes (similarly to [10, 13]). It can also assist in
the design of new EDCA-based medium access protocols
resistant to the negative influence of misbehaving nodes.
The rest of the paper is organised as fol lows. Section 2
provides a brief description of EDCA and a list of the
assumptions made. The analysis of the EDCA model and
misbehaviour are provided in Sections 3 and 4,respectively.
In Section 5, we compare simulation and analytical results to
(a) verify that the model is correct, (b) show that it outper-
forms three other models, and (c) prove it can be used to
analyse networks with misbehaving nodes. Finally, Section 6
concludes the paper. The nomenclature used throughout the
paper is provided in at the end of the paper.
2. EDCA Description and Assumptions
In this section, we first briefly describe EDCA and then list
the assumptions necessary to analyse EDCA.
EDCA introduces four Access Categories (ACs) to pro-
vide QoS through trafficdifferentiation. These categories are,
from the highest priority: Voice (Vo), Video (Vi), Best effort
(BE), and Background (BK). The medium contention rules
for EDCA are similar to 802.11 DCF. Each frame arriving
at the MAC layer is mapped, according to its priority, to
an appropriate AC. There are four transmission queues; one
for each AC (Figure 1). Trafficdifferentiation is achieved
through medium access parameters which assume different
values for each AC. These parameters are: the Arbitration
InterFrame Space Number (AIFSN), as well as the Con-
tention Window Minimum and Maximum values (CW
MIN
and CW
MAX
). The standard also defines the Transmission
Opportunity Limit (TXOP
Limit
). However, it is an optional
parameter and we do not consider it in this paper. We refer
the reader to [14] for an example of including this parameter
in the model.
The EDCA parameters influence the medium access in
the following manner. For the ith AC, AIFS
i
is the parameter
which determines how long the medium has to be idle before
a transmission or backoff countdown can commence. It is
calculated as
AIFS
i
= SIFS + AIFSN
i
· T
e
,
(1)
where T
e
is the length of the slot time and SIFS is the Short
Interframe Space of DCF. After a collision has occurred, the
mediumhastobeidlenotforanAIFS
i
but for an EIFS−DIFS
(Extended/DCF Interframe Space) period. EIFS is calculated
as SIFS + DIFS + ACKTxTime. This is the time required to
transmit an ACK frame at the lowest PHY mandatory rate.
According to the backoff procedure, for the ith AC
and jth retransmission attempt, a node randomly selects
Classifier: mapping to ACs
Voice
(Vo)
Video
(Vi)
Best
effort
(BE)
Back-
ground
(BK)
Higher
priority
Lower
priority
Backoff Backoff Backoff
Backoff
Virtual collision handling
Transmission attempt
Figure 1: Mapping to ACs in EDCA [1].
Table 1: Default EDCA parameters of IEEE 802.11 HR/DSSS
(802.11b).
Access category (i)AIFSN
i
CW
MIN
i
CW
MAX
i
Vo 2 7 15
Vi 2 15 31
BE 3 31 1023
BK 7 31 1023
an integer value from the r ange [0, CW
i, j
]. The contention
window CW
i, j
is calculated as
CW
i, j
= min
2
j
·
CW
MIN
i
+1
−
1, CW
MAX
i
,
i
∈ 0, , N
c−1
, j ∈ 0, , M,
(2)
where N
C
is the number of ACs and M is the retransmission
limit. After the Mth retransmission attempt the frame is
dropped.
Table 1 contains the standard values of the EDCA
parameters for IEEE 802.11 HR/DSSS (known as 802.11b)
[1]. Furthermore, for 802.11b the standard defines N
C
= 4,
M equal to 4 or 7 (depending on frame length), SIFS
= 10 μs,
DIFS
= 50 μs, and T
e
= 20 μs.
We attempt to model EDCA under the following assump-
tions:
(i) traffic is generated with a Poisson distribution,
(ii) frames are of equal length,
(iii) there are M/G/1 queues in each node,
(iv) the RTS/CTS exchange is not used,
EURASIP Journal on Wireless Communications and Networking 3
(v) the TXOP
Limit
parameter is not used,
(vi) the medium is error-free,
(vii) all nodes are in a single-hop network, and there are
no hidden stations,
(viii) each node transmits data of only one AC—this
simplifies the analysis, and it is a practical assumption
that the misbehaving user wants to send a single type
of data (support for multiple ACs per node can be
easily added, e.g., as in [15]),
(ix) nodes misbehave only by chang ing CW
MIN
i
,
CW
MAX
i
—such parameter modification can be easily
performed with the use of the latest wireless drivers
[2]. We do not consider more elaborate attacks
because they are either difficult to perform (e.g.,
modifying the EDCA mechanism implemented in
the wireless card drivers) or are related to higher
layers of the OSI model (e.g., swapping of ACs, node
collusion) and thus out of the scope of the paper.
All these assumptions do not affect the analysis of misbe-
haviour because they influence the results in a quantitative
(not qualitative) manner.
3. Model Analysis
The input parameters for our analysis of EDCA are:
(i) the number of ACs in the network (N
C
),
(ii) the number of nodes using the ith AC (n
i
),
(iii) the trafficrateoftheith AC given in frames per
second (λ
i
),
(iv) the average time required to send a DATA frame
(T
DA T A
, based on the average frame size).
The goal of the analysis is to derive the overall throughput
in each AC (S
i
). It is defined as the quotient of the average
duration of a successful transmission of a frame of the ith AC
and the average duration of a contention slot ( T
CS
), in which
the frame competes for medium access with other frames.
Therefore, we have
S
i
=
p
S
i
T
DA T A
T
CS
,
(3)
where p
S
i
is the is the probability of a successful transmission
for the ith AC and T
DA T A
is the average time spent on
transmitting a frame.
If we define τ
i
as the transmission probability in a slot
time for the ith AC, we can compute p
S
i
as the probability
that only one node is transmitting in a given slot time
p
S
i
= n
i
τ
i
(
1
− τ
i
)
n
i
−1
N
c
−1
j=0, j
/
= i
1 − τ
j
n
j
.
(4)
We calculate T
CS
using the following equation:
T
CS
=
1 − p
B
T
e
+ P
S
T
S
+
p
B
− P
S
T
C
,(5)
where T
e
is the slot time, T
S
is the duration of a successful
transmission, T
C
is the duration of a collision, p
B
is the
probability of a busy channel, 1
− p
B
is the probability of a
free channel, and P
S
is the overall probability of a successful
transmission in any AC (P
S
=
N
c
−1
i
=0
p
S
i
). We can now rewrite
(3)as
S
i
=
p
S
i
T
DA T A
1 − p
B
T
e
+ P
S
T
S
+
p
B
− P
S
T
C
.
(6)
The time intervals T
S
and T
C
can be calculated as
T
S
= min
[
AIFS
i
]
+ T
H
+ T
DA T A
+ SIFS + T
ACK
+2δ,
T
C
= T
H
+ T
DA T A
+ δ +ACK
Timeout
+min
[
AIFS
i
]
,
(7)
where δ is the propagation delay, T
H
is the time required to
send the PHY and MAC headers, and ACK
Timeout
= EIFS −
DIFS.
The probability of a busy channel p
B
is equal to the
probability that at least one node is transmitting
p
B
= 1 −
N
c
−1
i=0
(
1
− τ
i
)
n
i
.
(8)
The remaining unknow n var iables of (4)and(6)can
be found using analysis of the Markov chain presented
in Figure 2. We assume that the events of frame genera-
tion, blocking, collision, and starting a frame transmission
(defined below) are constant and independent from each
other. This fundamental assumption, which follows from
[16], allows us to use a Markov chain to model EDCA.
To descr ibe the model, we introduce the following
AC-dependent probabilities, each one calculated from the
perspective of a given node (i.e., taking into account the
perceived act ivity of other nodes).
(i) The frame blocking probability for the ith AC (p
B
i
)is
the probability that at least one other node is trans-
mitting during the given node’s backoff. Following
the fundamental assumption of event independence
it can be stated that each transmission “sees” the
system in the steady state in which each of the
other nodes transmits with a constant probability
τ
i
. Therefore, we need to take into account that
n
i
− 1 nodes in the ith AC may transmit and any
of the nodes in the other ACs may transmit as
well. Furthermore, we need to take into account the
different values of AIFSN
i
: nodes transmitting with a
lower priority AC need to wait for more empty slots
than nodes transmitting with a hig her priority AC.
We calculate p
B
i
using the following equation:
p
B
i
=1−
⎡
⎣
(
1
−τ
i
)
n
i
−1
N
c
−1
j=0, j
/
= i
1−τ
j
n
j
⎤
⎦
AIFSN
i
−AIFSN
MIN
+1
,
(9)
where (1
− τ
i
)
n
i
−1
is the probability that no
other nodes using the ith AC are transmitting,
N
c
−1
j
=0,j
/
= i
(1 − τ
j
)
n
j
is the probability that no nodes
using the other ACs are transmitting, and AIFSN
MIN
is the minimum AIFSN value among all ACs.
4 EURASIP Journal on Wireless Communications and Networking
Saturation
i, −2, 0
1
CW
i,0
+1
1 − p
G
i
1 − ρ
i
1 − ρ
i
ρ
i
ρ
i
i, −1, 0
p
G
i
(1− p
B
i
)p
T
i
CW
i,1
+1
p
G
i
p
B
i
CW
i,0
+1
p
G
i
(1 − p
B
i
)(1 − p
T
i
)
Success at the first
transmission attempt
i,0,CW
i,0
i,0,CW
i,0
− 1
i,0,1
i,0,0
1
− p
C
i
1 − p
C
i
1 − p
C
i
1 − p
C
i
1 − p
B
i
p
B
i
p
B
i
p
B
i
p
B
i
p
B
i
p
B
i
p
B
i
p
B
i
p
B
i
p
B
i
p
B
i
p
B
i
p
B
i
p
B
i
p
B
i
p
B
i
p
B
i
p
B
i
p
B
i
p
B
i
p
B
i
p
C
i
CW
i,2
+1
p
C
i
CW
i, j
+1
p
C
i
CW
i, j+1
+1
p
C
i
CW
i,m
+1
1
1
···
···
···
···
···
···
···
···
.
.
.
.
.
.
.
.
.
.
.
.
.
.
.
.
.
.
.
.
.
.
.
.
i,1,CW
i,1
i,1,CW
i,1
i,1,CW
i,1
− 1
i,1,CW
i,1
− 1
i,1,1
i,1,1 i,1,0
i,1,0
i, j − 1, 0
i, j
− 1, 0
i, j, CW
i, j
i, j, CW
i, j
− 1
i, j,1
i, j,0
i, M, CW
i,m
i, M, CW
i,m
− 1
i, M,1
i, M,0
Busy channel at the first stageCollision at the first stage
i, j,1i, j,0
i, M, CW
i,m
i, M, CW
i,m
− 1
i, M,1i, M,0
CW
i,1
+1
p
C
i
p
C
i
CW
i,2
+1
p
C
i
CW
i, j
+1
p
C
i
CW
i, j+1
+1
p
C
i
CW
i,m
+1
1 − p
C
i
1 − p
C
i
1 − p
C
i
1 − p
C
i
1 − p
B
i
1 − p
B
i
1 − p
B
i
1 − p
B
i
1 − p
B
i
1 − p
B
i
1 − p
B
i
1 − p
B
i
1 − p
B
i
1 − p
B
i
1 − p
B
i
1 − p
B
i
1 − p
B
i
1 − p
B
i
1 − p
B
i
1 − p
B
i
1 − p
B
i
1 − p
B
i
1 − p
B
i
1 − p
B
i
1 − p
B
i
1 − p
B
i
1 − p
B
i
1 − p
B
i
i, M, CW
i, j
− 1
i, M, CW
i, j
Nonsaturation
Figure 2: Markov chain of the proposed model.
(ii) The frame collision probability for the ith AC (p
C
i
)
is the probability that at least one other node is
transmitting while the given node is transmitting
p
C
i
= 1 −
(
1
− τ
i
)
n
i
−1
N
c
−1
j=0, j
/
= i
1 − τ
j
n
j
.
(10)
The difference between p
C
i
and p
B
i
is that in the
former we do not need to take AIFS differentiation
into account.
(iii) We denote the probability that at least one frame will
arrive at the ith queue in a slot time as the frame
generation probability (p
G
i
)
p
G
i
= 1 − e
−λ
i
T
CS
,
(11)
where T
CS
is the duration of a contention slot for the
ith AC.
(iv) p
T
i
is the probability that any other node will imme-
diately begin its transmission (i.e., the probability of
starting a frame transmission)
p
T
i
= 1 −
1 − p
G
i
n
i
−1
N
c
−1
j=0, j
/
= i
1 − p
G
j
n
j
.
(12)
This situation occurs only under nonsaturation,
when a frame is transmitted right after being gener-
ated.
(v) Finally, the satura tion probability (ρ
i
) is the probabil-
ity that the ith queue is not empty after the previous
transmission is finished
ρ
i
= λ
i
D
i
,
(13)
where D
i
is the overall service time of a frame for the
ith AC. A detailed description of this variable is given
later.
Let us define b
i
(t) as the value of the backoff counter for
a given node and the ith AC, where t is given in slot times.
Furthermore, we define s
i
(t) as the backoff stage. Therefore,
EURASIP Journal on Wireless Communications and Networking 5
DA T A
SIFS
AIFS
Success at the 1st
transmission
attempt
ACK
A
B
Node
p
G
1
− p
T
1 − p
B
Figure 3: Diagram illustrating the action sequences related to a success at the 1st transmission attempt.
DA T A
DA T A
A
B
Node
Collision
AIFS
p
G
Collision at the
1st stage
p
T
1
− p
B
Figure 4: Diagram illustrating the action sequences related to a collision at the 1st stage.
we can model the bidimensional process {b
i
(t), s
i
(t)} with
the discrete Markov chain presented in Figure 2. We assume
the notation that b
i, j,k
= lim
t →∞
P{s
i
(t) = j, b
i
(t) = k} (i ∈
0, , N
c
− 1, j ∈−2, , M,andk ∈ 0, ,CW
i, j
). These
are the stationary distributions of the Markov chain. Further-
more, according to the Ergodic theorem “Any irreducible,
finite, aperiodic Markov chain has a unique stationary
distribution” [17] these stationary solutions are unique.
There are two special states in the model: for nonsatu-
ration (b
i,−1,0
) and saturation (b
i,−2,0
) network conditions.
A node remains in the former state waiting for a frame to
be generated with the probability 1
− p
G
i
.However,itis
impossible to remain in the latter state because the node
immediately chooses a backoff valueandentersoneofthe
backoff states. The probability of entering the b
i,−1,0
and
b
i,−2,0
states is related to ρ
i
.
As can be seen from Figure 2, each transmission attempt
results in either a success at the first transmission attempt,
a collision at the first stage or a busy channel at the first
stage. Diagrams illustrating the action sequences relevant
to these three cases are presented in Figures 3, 4,and5,
respectively. To enable better understanding of the model the
figures contain symbolic representations of probabilities. A
successful transmission which does not require any backoff
occurs in the nonsaturation case with a probability of p
G
i
(1−
p
B
i
)(1 − p
T
i
). If we consider only the case of a busy channel at
the first stage, we have from the chain analysis
b
i,0,0
= p
G
i
p
B
i
b
i,−1,0
+ b
i,−2,0
,
(14)
where b
i,−1,0
represents the nonsaturation state and b
i,−2,0
represents the saturation state. Furthermore, every b
i, j,0
state
can be represented as a function of b
i,0,0
b
i, j,0
=
p
C
i
j
b
i,0,0
,forj ≥ 0.
(15)
Additionally, every b
i, j,k
state can be represented as a function
of b
i, j,0
b
i, j,k
=
⎧
⎪
⎪
⎪
⎪
⎨
⎪
⎪
⎪
⎪
⎩
CW
i, j
+1−k
CW
i, j
+1
p
G
i
p
B
i
b
i,−1,0
+b
i,−2,0
1 − p
B
i
,forj = 0, k ≥1,
CW
i, j
+1−k
CW
i, j
+1
1
1− p
B
i
b
i, j,0
,forj ≥ 1, k ≥1.
(16)
Now, let us consider the case wh ere there was a collision
at the first backoff stage (c.f., Figure 2). We distinguish these
Markov states by using the prime symbol. Analysing the
chain, we see that
b
i,1,0
= p
G
i
1 − p
B
i
p
T
i
b
i,−1,0
. (17)
Furthermore, every b
i, j,0
state can be represented as a
function of b
i,1,0
b
i, j,0
=
p
C
i
j−1
b
i,1,0
,forj>1.
(18)
6 EURASIP Journal on Wireless Communications and Networking
Data
ACK
SIFS AIFS
DA T A
Backoff
p
G
Busy channel at
the 1st stage
p
B
A
B
Node
Figure 5: Diagram illustrating the action sequences related to a busy channel at the 1st stage.
Additionally, every b
i, j,k
state can be represented as a function
of b
i, j,0
b
i, j,k
=
⎧
⎪
⎪
⎪
⎪
⎪
⎨
⎪
⎪
⎪
⎪
⎪
⎩
CW
i, j
+1−k
CW
i, j
+1
p
G
i
1− p
B
i
p
T
i
b
i,−1,0
1− p
B
i
,forj = 1, k≥ 1,
CW
i, j
+1−k
CW
i, j
+1
1
1− p
B
i
b
i, j,0
,forj ≥2, k≥ 1.
(19)
Analysing the Markov chain, the nonsatur ation state can
be described using the following equation:
b
i,−1,0
=
1 − ρ
i
×
1− p
C
i
M−1
j
=0
b
i, j,0
+
M−1
j
=1
b
i, j,0
+b
i,M,0
+b
i,M,0
p
G
i
1 −
1 − ρ
i
1 − p
B
i
1 − p
T
i
.
(20)
Finally, from the normalisation property, we have
b
i,−2,0
+ b
i,−1,0
+
M
j=0
b
i, j,0
+
M
j=1
b
i, j,0
+
M
j=0
CW
i,j
k=1
b
i, j,k
+
M
j=1
CW
i,j
k=1
b
i, j,k
= 1.
(21)
The transmission probability in a slot time for the ith AC can
be derived from the analysis of the Markov chain
τ
i
=
M
j=0
b
i, j,0
+
M
j=1
b
i, j,0
+ b
i,−1,0
p
G
i
1 − p
B
i
.
(22)
Now, the remaining unknown variable from (14)–(22)isD
i
which is a sum of the fol l owing components.
(i) The average countdown delay (D
CD
i
), which is cal-
culated as the sum of the time spent on counting
down backoff slots after a collision or a busy channel
at the first stage (this occurs with a probability of
[p
G
i
(1 − p
B
i
)p
T
i
(1 − ρ
i
)] or [p
G
i
p
B
i
(1 − ρ
i
)+ρ
i
], resp.).
Theaveragetimespentateachbackoff stage j is
T
e
(CW
i, j
/2). Therefore, we have
D
CD
i
= p
G
i
1 − p
B
i
p
T
i
1 − ρ
i
×
M
j=1
p
C
i
j−1
1 − p
C
i
j
h=1
T
e
CW
i,h
2
+
p
G
i
p
B
i
1 − ρ
i
+ ρ
i
×
M
j=0
p
C
i
j
1 − p
C
i
j
h=0
T
e
CW
i,h
2
.
(23)
(ii) The average frame blocking delay (D
B
i
)
D
B
i
= D
CD
i
p
B
i
P
S
T
S
+
p
B
− P
S
T
C
p
B
T
e
,
(24)
where the quotient is the average time in which the
node is blocked.
(iii) The average successful transmission delay (D
T
i
),
which is the product of the duration of a successful
transmission (T
S
) and the probability, that the frame
is not dropped
D
T
i
= T
S
1 −
p
C
i
p
G
i
1 − p
B
i
p
T
i
p
C
i
M
1 − ρ
i
+
p
C
i
M+1
p
G
i
p
B
i
1 − ρ
i
+ ρ
i
.
(25)
(iv) The average retransmission delay (D
R
i
), which can be
calculated by taking into account the average number
EURASIP Journal on Wireless Communications and Networking 7
of retransmission attempts j and the duration of a
collision (T
C
)
D
R
i
= T
C
1 − p
C
i
×
⎡
⎣
M
j=1
j
p
C
i
j−1
p
G
i
1 − p
B
i
p
T
i
1 − ρ
i
+
M
j=0
j
p
C
i
j
p
G
i
p
B
i
1 − ρ
i
+ ρ
i
⎤
⎦
.
(26)
(v) The average countdown delay of dropped frames
from the ithACwhichwedefineas
D
DROP
i
=
p
C
i
M
D
CD
i
+ D
B
i
+ D
R
i
.
(27)
The components of (27) are defined as follows. The
average countdown delay of dropped frames (D
CD
i
)
D
CD
i
= T
e
⎧
⎨
⎩
p
G
i
1 − p
B
i
p
T
i
1 − ρ
i
M
j=1
CW
i, j
2
+
p
G
i
p
B
i
1 − ρ
i
+ ρ
i
M
j=0
CW
i, j
2
⎫
⎬
⎭
.
(28)
The average frame blocking delay of dropped frames
(D
B
i
)
D
B
i
= D
’CD
i
p
B
i
P
S
T
S
+
p
B
− P
S
T
C
p
B
T
e
.
(29)
The average retransmission delay of dropped frames
(D
R
i
)
D
R
i
= T
C
(
M +1
)
p
G
i
1 − p
B
i
p
T
i
1 − ρ
i
+p
G
i
p
B
i
1 − ρ
i
+ ρ
i
.
(30)
Equations (28)–(30)resemble(23)–(25) but they
take into account dropped frames (i.e., those which
have been retransmitted M times).
We calculate the overall service time for the ith AC using the
following equation:
D
i
= D
CD
i
+ D
B
i
+ D
R
i
+ D
T
i
+ D
DROP
i
.
(31)
This allows us to compute ρ
i
(13). Then, we calculate τ
i
as a
function of p
B
i
, p
G
i
, p
C
i
, p
T
,andρ
i
using (2)and(14)–(22).
Finally, we can calculate S
i
using (1), (4), and (6)–(12).
4. Misbehaviour Analysis
For the analysis of misbehaviour, we focus on backoff
misbehaviour, because our studies have shown that this type
of misbehaviour gives significant throughput gains to selfish
users in single-hop networks [6]. At the same time, it is
easy to perfor m with modern wireless drivers [2]. We model
backoff misbehaviour by using an additional AC for which
we set nonstandard CW
MIN
i
and CW
MAX
i
values. Therefore,
in this paper, we consider an additional AC (indexed as m)
with a nonstandard configuration. This approach allows us
to consider networks with both well and misbehaving nodes.
We now use the proposed model to analyse the impact
of backoff misbehaviour on node throughput. The analysis is
done separately for saturation and nonsaturation conditions.
In saturation, the following model parameters are known:
ρ
i
= 1, p
G
i
= 1, and p
T
i
= 1 for each AC used in the network.
To simplify the calculations, we assume for all i :CW
MIN
i
=
CW
MAX
i
= CW
i
and p
C
i
= p
B
i
= p
i
, the misbehaving node
is the only node in its AC (n
m
= 1), and there is more than
one node in the network. Without these simplifications, it
would be significantly more difficult to perform the analysis.
However, the simulation results presented in Section 5.3 lead
to the same conclusions. Furthermore, assuming S
m
is a
continuous function of CW
m
(similarly to [13]), we can
calculate the fol lowing:
∂S
m
∂CW
m
=
∂S
m
∂τ
m
∂τ
m
∂CW
m
.
(32)
The first derivative of (6) can be computed as:
∂S
m
∂τ
m
=
c +2T
C
T
DA T A
[
(
1
− τ
m
)
T
e
+ c + τ
m
T
S
+
(
1 − 2τ
m
)
T
C
]
2
,
(33)
where c
=
N
c
−1
j
=0 j
/
= m
n
j
(1 − τ
j
)
n
j
−1
(T
S
+ T
C
). Similarly, we
calculate
∂τ
m
∂CW
m
=
2
p
m
− 1
1+p
m
+ p
2
m
+ p
3
m
+ p
4
m
2
3 − p
m
A +cw
i
+ p
m
1+p
m
1+p
2
m
CW
i
2
,
(34)
where A denotes (3 + p
m
+ p
2
m
+ p
3
m
+2p
4
m
). We conclude
that ∂S
m
/∂τ
m
> 0, ∂τ
m
/∂CW
m
< 0, and thus throughput is
a decreasing function of contention window size. Therefore,
under saturation conditions a misbehaving node can increase
its throughput by decreasing its backoff values.
Nonsaturation network conditions, however, are char-
acterised by the fact that S
m
= λ
m
. This means that the
achieved throughput is independent of CW
m
. Therefore,
under nonsaturation conditions a misbehaving node cannot
increase its throughput by decreasing its contention window
values.
5. Validation
The model was verified by comparing numerical and sim-
ulation results. We demonstrate that the model (1) behaves
similarly to simulations, (2) outperforms three existing
models, and (3) can be used for networks with misbehaving
nodes. Therefore, the results presented in this paper confirm
that the proposed model is valid.
The following analytical models were considered for
comparison: Malone et al. [8], Engelstad and Osterbo [7],
and Bianchi [16]. We refer to the models by the names of the
first authors (Malone, Engelstad,andBianchi). The first two
8 EURASIP Journal on Wireless Communications and Networking
Table 2: Simulation parameters.
Basic rate 1 Mb/s Data rate 11 Mb/s
δ 2 μs Frame Size 1000 B
Vo (sim)
Vo (model)
Vi (sim)
Vi (model)
0
0.05
0.1
0.15
0.2
0.25
0.3
0.35
0.4
0 2000 4000 6000 8000 10000
Offered load (kb/s)
BE (sim)
BE (model)
BK (sim)
BK (model)
Normalised throughput
Figure 6: Throughput differentiation (one node per AC).
models were chosen because they support both saturation
and nonsaturation conditions. Further m ore, all three were
fairly simple and could be easily implemented. However,
Malone and Bianchi are models of D CF and not EDCA.
Therefore, the comparison with these models is performed
only in scenarios in which a single AC is considered.
The simulations were performed with the ns-2 simulator
and the EDCA patch from TKN Berlin [18]. This patch
was modified to support misbehaving nodes. Additionally,
significant discrepancies with the standard were corrected.
Each simulation run was repeated many times to assure the
defined confidence level. The 95% confidence interval of each
simulation point is either presented in the figures or was too
small for graphical representation.
In the follow ing subsections, we considered several ad-
hoc scenarios. In each scenario there was a single-hop
network using the 802.11b physical layer. Tables 2 and 3 list
the EDCA and simulation parameters, respectively.
5.1. Model Verification. First, we considered a simple sce-
nario to verify the proposed model. The network consisted
of four nodes, each transmitting one of the four ACs (Vo, Vi,
BE, and BK). Figure 6 presents the normalised throughput
with respect to the offered load. Both the simulation and
analytical results are similar. The throughput increases
linearly when the network is not saturated and is constant
under saturation. This effect is correctly modelled for all ACs.
Furthermore, the throughput differentiation of the four ACs
is clearly visible in both theor y and simulation.
0
0.05
0.1
0.15
0.2
0.25
0.3
0.35
0 5 10 15 20
Nodes
Vo (sim)
Vo (model)
Vi (sim)
Vi (model)
BE (sim)
BE (model)
BK (sim)
BK (model)
Normalised throughput
Figure 7: Throughput differentiation (multiple nodes per AC).
0 200 400 600 800 1000
Packet size (B)
0
0.05
0.1
0.15
0.2
0.25
0.3
0.35
Vo (sim)
Vo (model)
Vi (sim)
Vi (model)
BE (sim)
BE (model)
BK (sim)
BK (model)
Normalised throughput
Figure 8: Variable frame size.
Next, we considered a scenario with an increasing num-
ber of nodes in the network. The number of nodes trans-
mitting using each AC was constant. Each node generated
1000 kb/s of traffic. Therefore, we have a symmetrically
increasing load. Figure 7 presents the normalised throughput
with respect to the number of nodes per AC. Again, the
analytical results correspond to the simulation results very
well. This scenario confirms that our model is valid even
when there is a high contention rate.
Finally, we tested the model in a scenario with vary ing
frame sizes. There were 20 nodes in the network: five nodes
EURASIP Journal on Wireless Communications and Networking 9
Difference (%)
Voice
0
10
20
30
40
50
5 50 100 150
Nodes
Proposed model
Engelstad
Malone
Bianchi
(a)
0
5
10
15
20
25
30
35
40
45
Difference (%)
5 50 100 150
Nodes
Proposed model
Engelstad
Malone
Bianchi
Background
(b)
Figure 9: Comparison with other models (64 kb/s per-node offered load).
Di
ffe
ren
ce
(
%
)
0
5
10
15
20
25
30
5 30 75 100
Nodes
Voice
Proposed model
Engelstad
Malone
Bianchi
(a)
Di
ff
erence (
%
)
0
5
10
15
20
25
30
5 30 75 100
Nodes
Proposed model
Engelstad
Malone
Bianchi
35
40
Background
(b)
Figure 10: Comparison with other models (1000 kb/s per-node offered load).
transmitting data in each of the four ACs. Each node gen-
erated 1000 kb/s of traffic. Figure 8 presents the normalised
throughput with respect to the frame size. The agreement
between theory and simulations is very good for all tested
frame sizes.
5.2. Comparison w ith Other Models. We compare our model
with three other models (Engelstad, Malone,andBianchi)
in two scenarios. In the first scenario, we assume that each
node in the network sends 64 kb/s of trafficinagiven
AC. Figure 9 presents the relative difference in throughput
between the simulation results and the results obtained
from the models for different network sizes. The relative
difference is calculated as the absolute difference between the
throughput values obtained analytically and by simulation
divided by the simulation result. The results are given for two
exemplary ACs: Voice and Background. Figure 10 presents
results from the second scenario, which differs in that nodes
send 1000 kb/s of traffic. It is worth noting that since the
Bianchi model was designed for saturation conditions, we
present the results of this model only for networks with more
than 100 (Figure 9)or30(Figure 10) nodes. To compare the
results, we have summed the differences shown in Figures
9 and 10 in Tab le 3 for all but the Bianchi model (since it
was tested only in saturation). Our model exhibits a good
accuracy for b oth low and high offered loads. Furthermore,
it is valid for both high- and low-priority ACs. Even for very
large networks (up to 50 nodes), the difference does not
exceed 5%. These results prove that it outperforms the other
models.
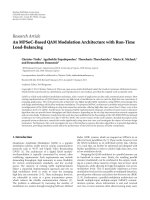
5.3. Impact of Misbehaving Node. In the final set of simula-
tions, we check if our model can cope with networks in which
one of the nodes misbehaves by changing its contention
10 EURASIP Journal on Wireless Communications and Networking
Table 3: Aggregate difference comparison.
Per-node offered load AC
Model
Proposed model Engelstad Malone Bianchi
64 kb/s
Vo 36.57% 89.63% 89.09% N/A
BK 43.23% 53.50% 114.04% N/A
1000 kb/s
Vo 14.52% 18.08% 42.99% N/A
BK 8.74% 21.99% 88.53% N/A
0.1
0.2
0.3
0.4
0.5
0.6
0 5000 10000
Offered load (kb/s)
Bad node (sim)
Bad node (model)
Good nodes (avg, sim)
Good nodes (avg, model)
0
Normalised throughput
Figure 11: Impact of contention window misbehaviour (good node
throughput is averaged over the four good nodes).
window parameters. First, we test the model in a simple
scenario. We assume that there are five nodes in the network.
All of them are sending traffic of the BK AC. However, one
of the nodes (the bad node) cheats by setting the following
parameters: CW
MIN
= 1andCW
MAX
= 5. Figure 11 presents
the normalised throughput of the nodes with respect to
the offered load. The main conclusion from the presented
results is that the misbehaving node can easily dominate
the network in terms of throughput. This occurs once the
network reaches congestion (at a per-node offered load of
approximately 1500 kb/s). Until that point the bad node’s
presence is not harmful. After reaching congestion, the bad
node increases its throughput at the cost of the good nodes
until saturation is achieved, in which the bad node obtains
higher throughput than the average good node. Our model
complies with the simulation results in a qualitative manner.
Next, we consider a more complex scenario in which we
measure the impact of misbehaviour on higher priority traf-
fic. Can a node misbehave by manipulating the parameters
of a low-priority A C and deduct throughput from a high
priority AC? To answer this question, a modified version of
the previous scenario is analysed. There are also five nodes
in the network; however, this time, four are sending traffic
using the Vo AC (good nodes), and one node is using the
BK AC (bad node). Figure 12(a) presents the normalised
throughput of the nodes with respect to the offered load in
the case where there is no misbehaviour. The good nodes
receive all the throughput, while the throughput of the bad
node is significantly reduced. This is in line with the EDCA
mechanism. If the bad node starts to misbehave (by setting
CW
MIN
= 1 and CW
MAX
= 5) it obtains a significantly
higher throughput then before, even higher than the good
nodes (Figure 12(b)). The difference between this scenario,
and the previous one is that the misbehaving node is not
able to dominate the channel in the presence of Vo nodes
(at least with contention window manipulation), as it was
possible in the presence of other BK nodes. It can be inferred
that despite the fact that Vo is the highest priorit y, it does not
matter which AC the misbehaving node wil l manipulate—
it is always able to benefit it terms of throughput. This
kind of network behaviour can further influence the decision
of a potentially malicious user to take advantage of the
benefits of misbehaviour. Again, our model complies with
the simulation results in a qualitative manner.
To determine the exact impact of the CW values the
following scenario is analysed. We assume a network of
five nodes in which each node generates trafficwithan
offered load of 8 Mbit/s. This assures saturation conditions.
All nodes use the BK AC. However, the bad node manipulates
its CW parameters. For ease of presentation, we assume that
the bad node sets CW
MIN
= CW
MAX
and varies it from
1 to 100. Figure 13 presents the normalised throughput of
the nodes with respect to the configured contention window
size. There is strong agreement between the analytical
and simulation results. The misbehaving node achieves
the highest throughput for the smallest CW parameters.
Furthermore, its throughput decreases in an exponential
manner with the increase of the contention window size.
The point where the bad node’s throughput is approximately
equal to the average throughput of the good nodes occurs for
CW
MIN
= CW
MAX
= 50. Since the 802.11 standard does not
include any incentives for cooperation, a misbehaving user is
free to chose the most profitable CW parameters (i.e., equal
to 1).
In the final misbehaviour scenario, we analyse the
impact of multiple noncolluding bad nodes on network
performance. We consider a network of 20 nodes, each
sending enough traffic to put the network into saturation. All
nodes use the BK AC, however, the bad nodes set CW
MIN
= 1
and CW
MAX
= 5. Figure 14 presents the normalised average
throughput of the nodes with respect to the percentage of
misbehaving nodes in the network. Once more the analytical
EURASIP Journal on Wireless Communications and Networking 11
0
0.02
0.04
0.06
0.08
0.1
0.12
0.14
0 2000 4000 6000 8000 10000
Offered load (kb/s)
No Misbehaviour
Bad node (sim)
Bad node (model)
Good nodes (sim)
Good nodes (model)
Normalised throughput
(a)
0 2000 4000 6000 8000
Offered load (kb/s)
Bad node (sim)
Bad node (model)
Good nodes (sim)
Good nodes (model)
0
0.05
0.1
0.15
0.2
0.25
0.3
0.35
0.4
0.45
Misbehaviour
Normalised throughput
(b)
Figure 12: Impact of misbehaviour on higher pr iority traffic: (a) reference case, (b) misbehaviour case.
0
0.1
0.2
0.3
0.4
0.5
0.6
0 20406080100
Bad nodes (sim)
Bad nodes (model)
Good nodes (sim)
Good nodes (model)
CW
min
= CW
max
Normalised throughput
Figure 13: Impact of contention window size (good node through-
put is averaged over the four good nodes).
results provided by the EDCA model closely resemble the
simulation results. When there are no bad nodes in the
network, each good node receives 0.02 of the normalised
throughput. This small value is a result of the sharing of
the medium by 20 homogeneous nodes. If there is at least
one bad node in the network, the good nodes are almost
deprived of any share in the network throughput. On the
other hand, the throughput achieved by the bad nodes
decreases exponentially with the increase of the percentage
of misbehaving nodes in the network. This is because of the
multiple collisions which result from the low CW values set
by the bad nodes. Furthermore, these results show that if bad
nodes comprise more than one-third of all nodes the network
0
0.1
0.2
0.3
0.4
0.5
0.6
0 20406080100
Bad nodes (sim)
Bad nodes (model)
Good nodes (sim)
Good nodes (model)
Misbehaving nodes (%)
Normalised throughput
Figure 14: Impact of the percentage of misbehaving nodes in the
network (throughput is averaged over the good and bad nodes).
performance (in terms of throughput) suffers considerably.
Therefore, it is most advantageous to misbehave if there are
none or very few misbehaving users in the network.
6. Conclusions
In this paper, we have presented a novel model of the IEEE
802.11 EDCA medium access function. Our model improves
the existing solutions by supporting the following set of
features: the ability to analyse networks with misbehaving
nodes, support for saturation and nonsaturation network
conditions, standard-compliant EDCA par a meters, proper
handling of frames, AIFS differentiation, and distinguishing
12 EURASIP Journal on Wireless Communications and Networking
between the busy medium and frame blocking probabilities.
Furthermore it is reasonably simple and, therefore, a possible
candidate for further network analysis. We have verified the
model by extensive simulation analysis and by comparing it
to three other IEEE 802.11 models. Results show that our
model behaves satisfactorily and outperforms other widely
acknowledged models.
The main goal of the presented EDCA model is to be able
to analyse networks with misbehaving nodes. In particular,
we consider backoff misbehaviour. Again, a comparison with
simulation results in several scenarios has proven that ( a)
our model performs correctly for scenarios with misbehaving
nodes and (b) misbehaviour as a serious threat to WLANs.
Our model is, therefore, a considerable contribution to
the area of EDCA models and backoff misbehaviour. In
particular, it can be used as the basis for enhancing EDCA
to cope with misbehaviour. Furthermore, it can facilitate
game theoretical analysis of IEEE 802.11 networks with
misbehaving nodes (c.f., [10, 13]).
As future work, we envision extending the model to sup-
port multihop networks. Our previous results have shown
that backoff misbehaviour in EDCA networks is a significant
threat for multihop scenarios [5]. Therefore, a multihop
analytical model of EDCA would be of assistance in studying
such scenarios.
Nomenclature
AC: A ccess Category,
AIFS: Arbitration interframe space,
AIFSN
i
: Arbitration interframe space number
for the ith AC,
b
i, j,k
: State distribution for j ≥ 0,
b
i,−1,0
: Awaiting state for nonsaturation,
b
i,−2,0
: Awaiting state for saturation,
CW: Contention window,
CW
MIN
i
,CW
MAX
i
: CW minimum/maximum size for the
ith AC,
CW
i, j
: CWsizefortheith AC and jth
retransmission attempt,
δ:Propagationdelay,
D
i
: Overall service time for the ith AC,
D
B
i
: Frame blocking delay for the ith AC,
D
CD
i
: Countdown delay for the ith AC,
D
DROP
i
: Frame dropping delay for the ith AC,
D
R
i
Retransmission delay for the ith AC,
D
T
i
: Transmission delay for the ith AC,
H: Length of the PHY and MAC
overhead,
i:ACnumber,
j: Retransmission counter,
k: Current CW value,
λ
i
:Traffic rate of the ith AC [frames per
second],
n
i
: Number of nodes using the ith AC,
N
c
:NumberofACs,
p
C
i
: Frame collision probability for the ith
AC,
p
B
i
: Frame blocking probability for the ith
AC,
p
S
i
: Successful transmission probability for
the ith AC,
p
G
i
: Frame generation probability for the ith
AC,
p
T
i
: Probability of starting a frame
transmission for the ith AC,
p
B
: Probability that a channel is busy,
P
S
: Probability of a successful transmission
in any AC,
ρ
i
: Saturation probability for the ith AC,
S
i
: Throughput value for the ith AC,
τ
i
: Transmission probability in a slot time
for the ith AC,
T
ACK
, T
CTS
, T
RTS
: Timerequiredtosendthe
ACK/CTS/RTS frame, respectively,
T
DA T A
: Average time required to send a DATA
frame,
T
e
:Slottime,
T
C
, T
CS
, T
S
: Duration of a collision/contention
slot/successful transmission,
respectively,
T
H
: Time required to send the PHY and
MAC headers.
Acknowledgments
This work has been carried out under the Polish Ministry
of Science and Higher Education grant no. N N517 176037.
It was also partially supported by the Polish Ministry of
Science and Higher Education under the European Regional
Development Fund, Grant No. POIG.01.01.02-00-045/09-00
Future Internet Engineering. The authors would also like to
thank the anonymous referees for their valuable comments
which helped to improve the presentation.
References
[1] “IEEE Standard for Information technology-Telecommunica-
tions and informationexchange between systems-Local and
metropolitan area networks-Specific requirements—Part 11:
Wireless LAN Medium Access Control(MAC) and Physical
Layer (PHY) Specifications,” IEEE Std 802.11-2007(Revision
of IEEE Std 802.11-1999), 2007.
[2] Madwifi Project, http://madwifi-project.org/.
[3] G. Bianchi, A. Di Stefano, C. Giaconia, L. Scalia, G. Terrazzino,
and I. Tinnirello, “Experimental assessment of the backoff
behavior of commercialIEEE 802.11b network cards,” in Pro-
ceedings of the 26th IEEE International Conference on Computer
Communications (INFOCOM ’07), pp. 1181–1189, 2007.
[4] M. Raya, I. Aad, J. -P. Hubaux, and A. El Fawal, “DOMINO:
detecting MAC layer greedy behavior in IEEE 802.11
hotspots,” IEEE Transactions on Mobile Computing, vol. 5, no.
12, pp. 1691–1705, 2006.
[5] S. Szott, M. Natkaniec, and A. Banchs, “Impact of Misbe-
haviour on QoS in Wireless Mesh Networks,” in Proceedings
of the International IFIP Networking Conference, pp. 639–650,
Springer, 2009.
EURASIP Journal on Wireless Communications and Networking 13
[6] S. Szott, M. Natkaniec, R. Canonico, and A. R. Pach, “Impact
of contention window cheating on single-hop IEEE 802.11e
MANETs,” in Proceedings of the IEEE Wireless Communications
and Networking Conference (WCNC ’08), pp. 1356–1361, Las
Vegas, Nev, USA, 2008.
[7]P.E.EngelstadandO.N.Osterbo,“Non-saturationand
saturation analysisof IEEE 802.11e EDCA with starvation
prediction,” in Proceedings of the 8th ACM International
Symposium on Modeling, Analysis and Simulation of Wireless
and Mobile Systems (MSWiM ’05), pp. 224–233, 2005.
[8] D. Malone, K. Duffy, and D. Leith, “Modeling the 802.11
distributed coordination function in nonsaturated heteroge-
neous conditions,” IEEE/ACM Transactions on Networking,
vol. 15, no. 1, pp. 159–172, 2007.
[9] L. Guang, C. M. Assi, and A. Benslimane, “Enhancing
IEEE 802.11 random backoff in selfish environments,” IEEE
Transactions on Vehicular Technology, vol. 57, no. 3, pp. 1806–
1822, 2008.
[10] J. Konorski, “A game-theoretic study of CSMA/CA under a
backoff attack,” IEEE/ACM Transactions on Networking, vol.
14, no. 6, pp. 1167–1178, 2006.
[11] K. J. Park, J. Choi, K. Kang, and Y. C. Hu, “Malicious or selfish?
Analysis of carrier sense misbehavior in IEEE 802.11 WLAN,”
Quality of Service in Heterogeneous Networks, vol. 22, pp. 351–
362, 2009.
[12] R. D. Vallam, A. A. Franklin, and C. Siva Ram Murthy, “Mod-
elling cooperative mac layer misbehaviour in ieee 802.11 ad
hoc networks with heterogeneous loads,” in Proceedings of the
6th International Symposium on Modeling and Optimization in
Mobile, Ad Hoc, and Wireless Networks and Workshops (WiOPT
’08), pp. 197–206, 2008.
[13] M. Cagalj, S. Ganeriwal, I. Aad, and J. P. Hubaux, “On
selfish behavior in CSMA/CA networks,” in Proceedings of the
IEEE International Conference on Computer Communications
(INFOCOM ’05), pp. 2513–2524, March 2005.
[14] F. Peng, “Mobile networks: theoretical performance evaluation
of EDCA in IEEE 802.11e wireless LANs,” European Transac-
tions on Telecommunications, vol. 21, no. 3, pp. 266–275, 2010.
[15] J. Hu, G. Min, M. Woodward, and W. Jia, “A comprehensive
analytical model for IEEE 802.11e QoS differentiation schemes
under unsaturated traffic loads,” in Proceedings of IEEE
International Conference on Communications, pp. 241–245,
2008.
[16] G. Bianchi, “Performance analysis of the IEEE 802.11 dis-
tributed coordination function,” IEEE Jour nal on Selected
Areas in Communications, vol. 18, no. 3, pp. 535–547, 2000.
[17] R. Motwani and P. Raghavan, Randomized Algorithms,Cam-
bridge University Press, New York, NY, USA, 1995.
[18] S. Wiethoelter, M. Emmelmann, C. Hoene, and A. Wolisz,
“TKN ED CA model for ns-2,” Tech. Rep. TKN-06-003,
Telecommunication Networks Group, Technische Universit
¨
at
Berlin, 2006.