Báo cáo hóa học: " Research Article A Novel Method for Improving Fairness over Multiaccess Channels" pdf
Bạn đang xem bản rút gọn của tài liệu. Xem và tải ngay bản đầy đủ của tài liệu tại đây (896.03 KB, 10 trang )
Hindawi Publishing Corporation
EURASIP Journal on Wireless Communications and Networking
Volume 2010, Article ID 395763, 10 pages
doi:10.1155/2010/395763
Research Article
A Novel Method for Improving Fairness over
Multiaccess Channels
Seyed Alireza Razavi and Ciprian Doru Giurc
˘
aneanu
Department of Signal Processing, Tampere University of Te chnology, P.O. Box 553, 33101 Tampere, Finland
Correspondence should be addressed to Seyed Alireza Razavi, alireza.razavi@tut.fi
Received 7 June 2010; Accepted 29 November 2010
Academic Editor: Jean-marie Gorce
Copyright © 2010 S. A. Razavi and C. D. Giurc
˘
aneanu. This is an open access article distributed under the Creative Commons
Attribution License, which permits unrestricted use, distribution, and reproduction in any medium, provided the original work is
properly cited.
It is known that the orthogonal multiple access (OMA) guarantees for homogeneous networks, where all users have almost the
same received power, a higher degree of fairness (in rate) than that provided by successive interference cancellation (SIC). The
situation changes in heterogeneous networks, where the received powers are very disparate, and SIC becomes superior to OMA.
In this paper, we propose to partition the network into (almost) homogeneous subnetworks such that the users within each
subnetwork employ OMA, and SIC is utilized across subnetworks. The newly proposed scheme is equivalent to partition the
users into ordered groups. The main contribution is a practical algorithm for finding the ordered partition that maximizes the
minimum rate. We also give a geometrical interpretation for the rate-vector yield by our algorithm. Experimental results show that
the proposed strategy leads to a good tr adeoff between fairness and the asymptotic multiuser efficiency.
1. Introduction and Preliminaries
Rate allocation in multiuser communication systems is an
important task which should consider simultaneously the
fairness and the spectral efficiency. This paper is focused
on fairness of multiple-access (MA) schemes working under
maximum spectral efficiency evaluated in terms of sum rate.
The state of art is the method recently introduced in [1].
However, the main drawback of this algorithm is a significant
decrease of the asymptotic multiuser efficiency (AME) [2–4].
We propose a new strategy that combines the strengths of two
different MA schemes such that to guarantee a good tradeoff
between fairness and AME.
1.1. System Model. Consider a single-antenna Gaussian MA
channel with K users transmitting to the base station (BS).
The system model can be written as [1, Example 1]
y
=
K
k=1
h
k
s
k
+ ω,(1)
where y is the received signal, h
k
models the fading channel
from the kth user to the BS, and s
k
is the symbol transmitted
by the kth user. The additive noise ω is assumed to be
white circular Gaussian with var iance N
0
/2foreachreal
and imaginary component. Under the hypothesis that the
transmitting powers of the users are constrained such that
E[
|s
k
|
2
] ≤ p
k
, k ∈{1, , K},wehave
K
k=1
R
k
≤ C
sum
,
(2)
C
sum
= log
1+
K
k
=1
P
k
N
0
bits/s/Hz,
(3)
where R
k
is the rate of the kth user and P
k
= p
k
|h
k
|
2
.The
interested reader can find in [5, Chapter 6] a comprehensive
discussion on the significance of (2)and(3). The fol low ing
two methods can be applied to achieve equality in (2):
(1) OMA: orthogonal multiple-access with degrees of
freedom (DOF) allocated proportional to users’
received powers;
(2) SIC: successive interference cancellation.
We refer to [5, Chapter 6] for more details on OMA, SIC,
and the definition of DOF.
2 EURASIP Journal on Wireless Communications and Networking
It is also pointed out in [5] that, whenever the received
power is almost the same for all users, that is, the network is
homogeneous, OMA guarantees a higher degree of fairness
(in rate) than that provided by SIC. The situation changes
in heterogeneous networks, where the received powers are
very disparate: if the decoding is performed in the decreasing
order of the received powers, then SIC becomes superior
to OMA. However, the SIC systems have drawbacks which
do not exist for OMA. Because the signals received from
the users are estimated and subtracted from the composite
signal one after the other, the inaccurate estimation for the
current user makes the next users decoded unreliably. This
deficiency becomes more severe when the number of users
increases. In fact, it is known that SIC works well only w hen
a specific disparity of the powers is enforced (see, e.g., [6, 7]
and Chapter 5 in [8]).
To measure the fairness and the performance, we employ
two criteria that have been used frequently in the past. For
instance, it is customary to evaluate the fairness with the
following max-min c riterion: a rate vector is called max-
min fair (MMF) if and only if an increase in the rate of
one user results in the decrease in the rate of one or more
users who have smaller or equal rates [1, 9]. Additionally,
we consider the AME. Note that AME quantifies the loss
of performance when the interferer users are present and
the background noise vanishes [2–4]. More precisely, AME
is a measure of degradation in bit error rate because of the
presence of multiple-access interference in a white Gaussian
channel.
1.2. Basics of the New Method. Our approach exploits the
beneficial aspects of both OMA and SIC. B ecause we do not
aim to improve fairness by sacrificing the throughput, we
assume that (2) is satisfied with equality.
The key idea is to partition the network into (almost)
homogeneous subnetworks such that the users within each
subnetwork employ OMA, and SIC is utilized across sub-
networks. Since OMA is applied to (almost) homogeneous
subnetworks, it is likely that the deg ree of fairness is not
deteriorated. The application of SIC to subnetworks and not
directly to users al lows to decrease the number of decoding
stages, which potentially improves the performance.
Given that the number of users is K, we assume that
the number of subnetworks is T
∈{1, , K}. The newly
proposed scheme is equivalent to partition the K users into
T ordered groups. Note that the order matters because it
corresponds to the order in which the groups are decoded.
Remark for T
= 1 that the grouping method is the same
with OMA. Moreover, the g rouping method is identical with
SIC for T
= K. Similarly to conventional SIC, the max-min
rate achieved in this case depends on the order in which the
groups are decoded. We consider the family of all ordered
partitions of the K users into T nonempty groups. Then
we pick up the ordered partition for which the minimum
rate is maximized, and we name it BORG
K/T
(basic ordered
grouping of K users into T groups). Conventionally, BORG
K/1
coincides with OMA, and we write BORG
K/1
≡ OMA.
Obviously, BORG
K/K
≡ SIC.
Furthermore, one can select again from BORG
K/1
,
BORG
K/2
, ,BORG
K/K
the ordered partition which max-
imizes the minimum rate. The new selection is dubbed
BORG
∗
K
. Remark that the rate vector which corresponds to
BORG
∗
K
is not necessarily the same with the max-min fair
rate vector that was defined in Section 1.1.However,BORG
∗
K
is guaranteed to be max-min fair among all possible user
groupings for which the sum capacity is achieved.
We investigate how the fairness can be evaluated for
OMA, SIC, and BORG. In this context we demonstrate
for BORG
K/T
a fundamental property, which allows us to
introduce a low-complexity search method for choosing
BORG
K/T
from all ordered partitions of K users into T
groups.
We give also a geometrical interpretation for the rate-
vector yield by our algorithm. More exactly, we point out the
connections between the outcome of the proposed method
and the polymatroid structure of the capacity regi on as it is
used in multiuser information theory [1, 10, 11].
During recent years, several works have exploited the
polymatroid structure for optimizing the fairness in multi-
access systems [1, 12]. The main idea is based on the fact
that particular points within the sum capacity facet of the
polymatroid can be achieved by successive decoding and time
sharing. Then, the effort is focused on finding the time-
sharing coefficients which give the fairest point. For the sake
of comparison, we pick up the method from [1], which is
based on time sharing, and we name it TS. It is clear that
TS cannot be inferior to our method if the criterion is the
fairness in the multiaccess system. But since TS is a linear
combination of successive decoders with different decoding
orders, it suffers from the same deficiencies like the ones
mentioned earlier for SIC.
The rest of the paper is organized as follows. Section 2
contains the main contribution, where we show how a
low-complexity search algorithm can be devised to find
the ordered partition which maximizes the minimum rate.
The geometrical interpretation of the result is included. In
Section 3, the newly proposed method is compared with
OMA, SIC, and TS in a simulation study which comprises
four different network models. In all cases, the new strategy
provides the best tradeoff between fairness and AME.
2. Fairness
2.1. Formulas for OMA and SIC. It is well known for OMA
method that the degree of fairness among users is lowered
when their received powers are very dispara te [5]. This
drawback can be easily understood from the formula which
gives the rate of the kth user [5, Chapter 6]:
R
OMA
k
=
P
k
Π
log
1+
Π
N
0
,(4)
where Π
=
K
j=1
P
j
. From the identity above, we have
R
OMA
j
/R
OMA
k
= P
j
/P
k
for all j, k ∈ G,whereG ={1, , K}.
Hence, the rates are as disparate as the received powers are,
which leads to unfair rates in heterogeneous networks. For
example, if min
1≤k≤K
P
k
/Π → 0, then the minimum rate
min
1≤k≤K
R
OMA
k
tends also to zero.
EURASIP Journal on Wireless Communications and Networking 3
When SIC is applied, the fairest rate vector is obtained by
decoding the users in the decreasing order of their received
powers [1]. Consequently, the rate of the kth user has the
expression [5]
R
SIC
k
= log
1+
P
k
N
0
+
{ j|P
j
<P
k
}
P
j
. (5)
With the convention that n
k
∈{0, , K − 1} denotes the
number of users whose received power is s maller than P
k
,
the following inequality is readily obtained: R
SIC
k
> log(1 +
1/(N
0
/P
k
+ n
k
)). It shows that, as long as min
1≤k≤K
P
k
is not
much smaller than N
0
, then min
1≤k≤K
R
SIC
k
does not t end to
zero when min
1≤k≤K
P
k
/Π → 0. Hence, it is likely that SIC
has a higher degree of fairness than OMA when the received
powers are very dispara te.
2.2. BORG and Its Low-Complexity Implementation. Con-
sider the following scenario: K users are divided into
nonempty g roups G
1
, , G
T
. For an arbitrary i ∈{1, , T},
we use Π
i
to denote the sum of the received powers for the
users that belong to the group G
i
. It is clear that G =
T
i=1
G
i
and Π =
T
i=1
Π
i
.
To be in line with the previous literature, we adopt the
convention that the order of the groups in the successive
decoding is G
σ(T)
, , G
σ(1)
,whereσ(·)isapermutationof
the set
{1, , T}. For simplicity, we denote by ORG the
ordered partition which is given by the sequence of subsets
G
σ(T)
, , G
σ(1)
. By combining the results from (4)and(5),
we get the rate of the kth user
R
ORG
k
|σ
(
t
)
=
P
k
Π
σ(t)
log
1+
Π
σ(t)
N
0
+
{ j|1≤ j<t}
Π
σ( j)
. (6)
For writing the equation above more compactly, we have
assumed that the kth user belongs to the group G
σ(t)
.
The naive approach for finding BORG
K/T
when T ∈
{
2, , K − 1} is to search among all ordered partitions of
the K users into T groups, then to compute the minimum
rate in each case, and eventually to pick up the partition
which maximizes the minimum rate. This leads to a huge
computational burden and makes the method unpractical.
We show below how the number of ordered partitions to be
considered can be reduced significantly.
We need some more definitions. Let
κ = [κ
1
, , κ
T
]be
a vector of strictly positive integers whose sum is equal to K.
The ordered partition G
σ(T)
, , G
σ(1)
is of type κ if for all
i
∈{1, , T} the cardinality of G
σ(i)
is κ
i
.Givenσ(·)andκ,
we denote by ORG
σ(·),κ
K/T
the family of all ordered partitions of
type
κ. It is important to remark that for all partitions within
this family we have that (i) the order of the subsets is the same
and is given by the reverse order of the permutation σ(
·); (ii)
the cardinality of the ith subset is the same, namely, κ
i
.
Additionally, for two arbitrary subsets G
i
and G
j
,wewrite
G
i
G
j
if the received powers of all users within G
i
are
greater than those of the users within G
j
. When the condition
is not satisfied, we write G
i
/
G
j
.
Theorem 1. Let T
∈{2, , K − 1}.Forfixedσ(·) and
κ, consider all ordered partit ions that belong to ORG
σ(·),κ
K/T
.In
this class, the ordered partition that maximizes the minimum
rate for a given set
{P
1
, , P
K
} is the one which satisfies the
condition
G
σ(T)
··· G
σ(1)
. (7)
The proof is deferred to the appendix.
Now we are prepared to formalize the result which shows
the decrease in computational complexity.
Corollary 2. For T
∈{2, , K − 1},wehavethefollowing.
(i) To selec t BORG
K/T
by brute-force search amounts to
computetheminimumratefor
T
t=0
⎛
⎝
T
t
⎞
⎠
(
−1
)
t
(
T
− t
)
K
(8)
different ordered partitions.
(ii) Theorem 1 allows to reduce to
⎛
⎝
K − 1
T
− 1
⎞
⎠
(9)
the number of ordered partitions that are considered in
the evaluation process.
Proof. (i) In the case of brute-force search, it is easy to
note that the rate vector must be computed for all ordered
partitions of the K users into T nonempty subsets. Hence, the
number of partitions to be considered equals T!
×
K
T
,where
K
T
is the Stirling number of the second kind, and its closed-
form expression is given by (1/T!)
T
t=0
T
t
(−1)
t
(T − t)
K
[13]. This proves the result in (8).
(ii) From Theorem 1, we know that for all permutations
σ(
·) there exists a single ordered partition of type κ that
must be considered, namely, the one which satisfies (7). For
finding BORG
K/T
,wemustevaluateasingleratevectorfor
each vector type. This implies that the number of partitions
which are investigated equals the number of ways that the
integer K can be written as a sum of T st rictly positive
integers. According to [13],thisnumberisgivenby(9).
To gain more insight, let us suppose that K = 10 users
and T
= 3groups.Corollary 2 points out that the number
of competing partitions for the selection of BORG
K/T
can
be reduced from 55980 to 36, which implies a significant
decrease of the computational complexity. However, by using
the result from (9), it is easy to verify that the number of
rate vectors which must be evaluated for selecting BORG
∗
K
is
2
K−1
.
2.3. Geometrical Interpretation. We resort to the polymatroid
structure of the capacity region [1, 10, 11], to give a
4 EURASIP Journal on Wireless Communications and Networking
new interpretation of BORG. The object of interest is the
polyhedron defined by
B
f , G
=
⎧
⎨
⎩
(
R
1
, , R
K
)
∈ R
K
+
|
j∈S
R
j
≤ f
(
S
)
, ∀S ⊂ G
⎫
⎬
⎭
,
(10)
where the set function f :2
G
→ R
+
is a mapping for all
subsets of G to the positive real numbers. For the problem
that we study, it is convenient to choose
f
(
S
)
= log
1+
j∈S
P
j
N
0
. (11)
Then, it is a simple exercise to verify that the set function
defined in (11) satisfies (i) f (
∅) = 0 (normalized); (ii)
f (S
1
) ≤ f (S
2
)ifS
1
⊂ S
2
(increasing); (iii) f (S
1
)+ f (S
2
) ≥
f (S
1
∩ S
2
)+ f (S
1
∪ S
2
) (submodular). Thus, according to
the definition from [14], B( f , G)isapolymatroid.Moreover,
the hyperplane given by
K
j=1
R
j
= f (G) is the sum-capacity
facet of B( f , G)[1]. We analyze next the points within the
sum-capacity facet that correspond to OMA, SIC, and ORG.
To get the point which corresponds to OMA, we rewrite the
identity in (4)as
R
OMA
k
=
P
k
Π
f
G
. (12)
For SIC, we take ϕ(
·) to be an arbitrary permutation of
the set
{1, , K}, and we assume that the users are decoded
in the reverse order of ϕ(
·). Therefore, the rate of the ϕ(i)th
user is
R
SIC
ϕ(i)
=
⎧
⎪
⎪
⎪
⎪
⎨
⎪
⎪
⎪
⎪
⎩
f
ϕ
(
i
)
, i = 1
f
ϕ
(
1
)
, , ϕ
(
i
)
−
f
ϕ
(
1
)
, , ϕ
(
i − 1
)
, i ∈{2, , K}.
(13)
The formula in (5) is easily obtained from (13) for the
particular case when ϕ(
·) is chosen such that P
ϕ(K)
>
··· >P
ϕ(1)
. More importantly, (13) shows that, for each
permutation ϕ(
·), (R
ϕ(1)
, , R
ϕ(K)
) is a corner point of the
polymatroid B( f , G)(see[10, 14] for more details).
With the convention that the kth user belongs to G
σ(t)
,
where σ(
·)isapermutationof{1, , T}, the expression in
(6)isequivalentto
R
ORG
k
|σ
(
t
)
=
⎧
⎪
⎪
⎪
⎪
⎪
⎪
⎪
⎪
⎪
⎪
⎪
⎨
⎪
⎪
⎪
⎪
⎪
⎪
⎪
⎪
⎪
⎪
⎪
⎩
P
k
Π
σ(t)
f
G
σ(t)
, t = 1
P
k
Π
σ(t)
f
t
j
=1
G
σ( j)
−
P
k
Π
σ(t)
f
t−1
j
=1
G
σ( j)
, t ∈{2, , T}.
(14)
Observe that, in general, the rate vector given by (14)does
not correspond to a corner of B( f , G).
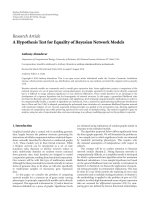
To enhance intuition, we depict in Figure 1(a) the
polymatroid B( f , G)forK
= 2 when the two users have
equal received powers (P
1
= P
2
). Similarly, in Figure 1(b),it
is shown B( f , G) for the case when P
1
P
2
.Inbothcases,
the sum-capacity facet is the segment whose endpoints are
the corners SIC
1−2
and SIC
2−1
.
Because K
= 2, the number of groups for the BORG
method can be either T
= 1orT = 2. Thus, we are interested
in the points within the sum-capacity facet that correspond
to BORG
2/1
and BORG
2/2
, respectively. As we already know,
BORG
2/1
is the same with OMA, and B ORG
2/2
coincides
with SIC, where SIC
≡ SIC
i− j
with P
i
>P
j
. Consequently,
BORG
∗
2
is chosen by selecting between OMA and SIC the
one which maximizes the minimum rate. For completeness,
we consider also the point TS that corresponds to the degree
of fairness provided by the method from [1], which finds
optimum weights for the time sharing between SIC
1−2
and
SIC
2−1
.
Note in Figure 1(a) that the OMA point is the fairest
on the sum-capacity facet. In this case, it is obvious that
also BORG
∗
2
corresponds to the fairest point. Moreover, the
method from [1] gives the same weight to both SIC
1−2
and
SIC
2−1
, which makes the TS point coincide with the OMA
point. The situation changes in Figure 1(b), where SIC
≡
SIC
2−1
and min
1≤k≤2
R
SIC
k
> min
1≤k≤2
R
OMA
k
.Thisleadsto
BORG
∗
2
≡ SIC
2−1
. Remark also in Figure 1(b) that, even if
BORG
∗
2
is the best among OMA and SIC, the minimum of
its rate vector is slightly smaller than the minimum rate for
TS.
Next, we demonstrate by simulations the capabilities of
various MA schemes.
3. Simulation Results
3.1. Evaluation Criteria. As it was already mentioned, the
fairest rate vector is obtained by applying TS or, equivalently,
by time sharing between the corner points of the sum-
capacity facet. To find the fairest rate vector and also the
optimal time-sharing coefficients, we have implemented in
Matlab the algorithms III and IV from [1].
Let us assume that the number of runs for a specified
set of experimental conditions is N
r
. An arbitrary method,
say MET, is compared w ith TS by computing the Normalized
Min-Rate with formula
1
N
r
N
r
j=1
min
1≤i≤K
R
MET
i
j
min
1≤i≤K
R
TS
i
j
, (15)
where min
1≤i≤K
R
MET
i
( j) is the minimum of the rate-vector
yield by MET in the jth run. Similarly, min
1≤i≤K
R
TS
i
( j) is the
minimum of the TS rate vector in the jth run.
The second figure of merit that we consider for evaluating
the MA schemes is the AME, which is generally denoted
by η. AME takes v alues in the interval [0, 1] and attains its
maximum when OMA is utilized. Therefore, we have η
OMA
k
=
1forallk ∈{1, , K} (see Chapter 5 in [3]).
To keep SIC inline with what we have in the corner points
of the sum-capacity facet, we assume that all cancellations
are perfect, and what is forwarded to the next decoder
EURASIP Journal on Wireless Communications and Networking 5
SIC
1−2
OMA
TS
BORG
∗
2
SIC
2−1
R
1
R
2
(a)
SIC
1−2
SIC
2−1
BORG
∗
2
OMA
R
1
R
2
TS
(b)
Figure 1: The polymatroid B( f , G) when K = 2 users. The points marked on the sum-capacity facet correspond to various MA methods.
Here, SIC
i− j
means that user i is decoded before user j.Twodifferent cases are considered: (a) homogeneous network (P
1
= P
2
), (b)
heterogeneous network (P
1
P
2
).
hasnoresidualerrorfromthealreadydecodedusers[15].
Furthermore, suppose that in each step a matched filter is
used as decoder such that for computing the AME of the kth
user we can apply the formula (3.123) from [3]:
η
SIC
k
=
⎛
⎝
max
⎧
⎨
⎩
0, 1 −
{ j|P
j
<P
k
}
P
1/2
j
P
1/2
k
⎫
⎬
⎭
⎞
⎠
2
.
(16)
Note that the expression above takes into consideration the
system model from (1). Additionally, it is assumed that the
users are decoded in the decreasing order of the received
powers. We emphasize that we do not use formula (7.31)
from [3] because it was derived for SIC with residual errors
propagated from previous steps.
It is clear that, for T
∈{2, , K − 1}, we do not need
to compute AME for all ordered partitions of the K users
into T subgroups but only for BORG
K/T
. With slight abuse of
notation, we assume that BORG
K/T
is the ordered partition
G
σ(T)
, , G
σ(1)
,whereG
σ(T)
··· G
σ(1)
.
More impor tantly, the BORG method combines the
features of both OMA and SIC such that (i) the users
within each group are orthogonal one to each other; (ii)
the groups share the entire channel. It is evident that only
the second characteristic determines the degradation of
the AME. Hence, the expression of AME can be derived
straightforwardly from (16) by taking into account that,
when decoding the group G
σ(t)
, the role of interferer is played
by the groups G
σ(t−1)
, , G
σ(1)
. If the kth user belongs to the
group G
σ(t)
, then we have
η
BORG
k
|σ
(
t
)
=
⎛
⎜
⎝
max
⎧
⎪
⎨
⎪
⎩
0, 1 −
{ j|1≤ j<t}
Π
1/2
σ
(
j
)
Π
1/2
σ
(
t
)
⎫
⎪
⎬
⎪
⎭
⎞
⎟
⎠
2
.
(17)
Remark in the expression above that AME is the same for all
the users within the G
σ(t)
-group.
It is worth mentioning here that BORG
K/T
does not
necessarily coincide with the grouping that maximizes the
AME. For example, if the received powers are P
1
= 100,
P
2
= 90, P
3
= 85, P
4
= 15, P
5
= 6, P
6
= 5, P
7
= 4,
P
8
= 2, and P
9
= 1, then the optimum AME is produced
by the ordered partition G
1
, G
2
, G
3
,whereG
1
={1,2, 3, 5},
G
2
={4, 6, 7},andG
3
={8, 9}. The inequality P
4
>P
5
implies G
1
/
G
2
, which shows clearly that BORG
9/3
cannot be
the ordered partition G
1
, G
2
, G
3
.
We conclude the short discussion on the second figure of
merit, by noticing that, whenever an experiment is repeated
N
r
times, we calculate for each method MET the Average
AME
1
N
r
1
K
N
r
j=1
K
i=1
η
MET
i
j
, (18)
where η
MET
i
( j) is the AME for the ith user in the jth run.
In the examples outlined below, the Normalized Min-
Rate and the Average AME are employed to compare the
performance of the following MA schemes: TS, OMA
≡
BORG
K/1
,BORG
K/2
,BORG
K/3
, SIC ≡ BORG
K/K
,and
BORG
∗
K
. In our settings, the number of users is K = 10, and
the number of runs for each set of experimental conditions
is N
r
= 10
4
. Additionally, the power of the Gaussian noise is
taken to be one (N
0
= 1). Four different network models are
considered.
3.2. Examples
Model I. To quantify the degree of network heterogene-
ity, we consider the ratio between the power of the
6 EURASIP Journal on Wireless Communications and Networking
strongest user and the power of the weakest user : Δ
(I)
=
max
1≤i≤K
P
i
/min
1≤i≤K
P
i
. The larger is Δ
(I)
, the more hetero-
geneous is the network. For a fixed value Δ
(I)
> 1, we take
P
1
= 200Δ
(I)
/(1 + Δ
(I)
)andP
K
= 200/(1 + Δ
(I)
). The powers
P
2
, , P
K−1
are chosen to be outcomes from a uniform
distribution on (P
K
, P
1
), and the experiment is repeated
N
r
times. This selection guarantees that the mean power
E[P
i
] is equal to 100. When Δ
(I)
= 1, a single realization is
considered, namely, P
1
=··· = P
K
= 100.
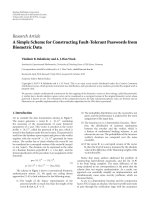
We plot in Figure 2(a) the Normalized Min-Rate
obtained for various MA schemes when Δ
(I)
increases from
0 dB to 30 dB. Due to the definition in (15), the graph for TS
is a straight line parallel to x-axis. Note in the same figure
that the degree of fairness is very high for OMA when Δ
(I)
is
close to 0 dB, but it decreases rapidly when the heterogeneity
of the network increases. By contrast, SIC has a very low
degree of fairness in homogeneous networks, but it improves
with the increase of the network heterogeneity such that for
Δ
(I)
> 15 dB, SIC is clearly superior to OMA.
The beneficial effects of the newly proposed strategy can
be observed for BORG
∗
K
, which performs as well as OMA for
small Δ
(I)
, but surpasses both OMA and SIC for large Δ
(I)
.
More interestingly, good results are obtained not only when
searching for the optimum T, but also when the number of
groups is kept fixed. Remark for the heterogeneous networks
that BORG
K/3
performs very similarly with BORG
∗
K
.
In Figure 2(b), we show the Average AME for the six
methods which are compared. As it was already pointed
out previously, OMA achieves always the maximum possible
AME. We can notice from Figure 2(b) that SIC and TS yield
the poorest Average AME. This drawback appears for the
two schemes because the firstly decoded users receive high
interference, which makes their AME close to zero. It is
remarkable that BORG
K/2
and BORG
K/3
have AME superior
to that of SIC. Moreover, the performance of BORG
K/2
approaches the Average AME of OMA when Δ
(I)
increases.
Model II. Let
P = 100, P
c1
= P + Δ
(II)
/2, P
c2
= P − Δ
(II)
/2,
and δ
= 5. We simulate a network such that P
1
, , P
K/2
are uniformly distributed on (P
c1
− δ/2, P
c1
+ δ/2), and
P
K/2+1
, , P
K
are uniformly distributed on (P
c2
− δ/2, P
c2
+
δ/2). The parameter Δ
(II)
controls the degree of heterogeneity
of the network. When Δ
(II)
= 0, all the users belong to a single
cluster, and the increase of Δ
(II)
makes the network to consist
of two disjoint clusters.
The results plotted in Figure 3 are obtained by varying
the value of Δ
(II)
from 0 to 180. For each value of Δ
(II)
, N
r
different realizations of P
1
, , P
K
are generated. In terms of
fairness and AME, the performance of BORG
∗
K
is the same
with that of OMA
≡ BORG
K/1
for Δ
(II)
< 100. Remark in
Figure 3(a) that the graph of BORG
∗
K
coincides with that of
BORG
K/2
when Δ
(II)
is larger than 100. A similar fact can
be also observed in Figure 3(b).So,BORG
∗
K
automatically
adapts to the topology of the network.
Model III. We consider again a network including two
clusters. This time, the received powers of the users are
generated as suggested in [16]. Let β
1
>β
2
such that β
1
+β
2
=
Δ
(I)
0
5
10 15 20 25
30
0
0.1
0.2
0.3
0.4
0.5
0.6
0.7
0.8
0.9
1
Normalized Min-Rate
(a)
0
5
10 15 20 25
30
Average AME
0
0.1
0.2
0.3
0.4
0.5
0.6
0.7
0.8
0.9
1
Δ
(I)
(b)
Figure 2: Experimental results for Model I: (a) Normalized Min-
Rate versus Δ
(I)
;(b)AverageAMEversusΔ
(I)
.Thenumberof
users is K
= 10. Note that Δ
(I)
is expressed in dB, and for each
Δ
(I)
> 0 the reported results are obtained from N
r
= 10
4
runs.
The following MA methods are compared (for each method we
indicate the color and the marker symbol used in plots): TS (black
left-pointing triangle), OMA
≡ BORG
K/1
(blue asterisk), BORG
K/2
(magenta right-pointing triangle), BORG
K/3
(green diamond),
SIC
≡ BORG
K/K
(red square), and BORG
∗
K
(brown circle).
100. We take P
i
= β
j
z
i
,where j = 1ifi ∈{1, , K/2} and
j
= 2ifi ∈{K/2+1, , K}. The distribution of the random
variable z
i
is Chi-Square with two deg rees of freedom.
Remark that the heterogeneity of the network is mea-
sured by the difference Δ
(III)
= β
1
− β
2
, which we increase
from 0 to 90. The Normalized Min-Rate and the Average
AME calculated for each Δ
(III)
based on N
r
runs are shown
in Figure 4. It is easy to observe the following outcome of the
experiment. Because the Chi-Square distribution has infinite
support, OMA does not provide fairness in rate allocation
when Δ
(III)
= 0. Due to the same reason, for all values of
Δ
(III)
, the degree of fairness yield by BORG
K/2
is inferior
to that of BORG
K/3
even if, for BORG
K/2
, the number of
groups equals the “true” number of clusters. However, when
comparing the Average AME, BORG
K/2
is ranked the second
after OMA which achieves the maximum possible value.
Model IV. Following the suggestion of one of the review-
ers, we briefly investigate the case of K users uniformly
distributed over a two-dimensional area. For the sake of
concreteness, let d
1
, , d
K
be the distances from the BS to
the users. According to the large-scale model, we have P
i
=
P
0
d
−n
i
,whereP
i
is the received power from the ith user, P
0
is
EURASIP Journal on Wireless Communications and Networking 7
0
0.1
0.2
0.3
0.4
0.5
0.6
0.7
0.8
0.9
1
0 20 40 60 80 100 120 140 160 180
Δ
(II)
Normalized Min-Rate
(a)
0
0.1
0.2
0.3
0.4
0.5
0.6
0.7
0.8
0
.9
1
020
40 60 80 100 120 140
160
180
Δ
(II)
Average AME
(b)
Figure 3: Experimental results for Model II: (a) Normalized Min-
Rate versus Δ
(II)
;(b)AverageAMEversusΔ
(II)
. Note that Δ
(II)
is not
expressed in dB. The number of users (K), the number of runs (N
r
),
and all graphical conventions are the same like in Figure 2.
the received power from a transmitter located at distance one
from the BS, d
i
is the distance from the ith user to the BS, and
n is the path loss exponent [17, 18].
It is widely accepted that 2.7 <n<3.5forurbanarea
cellular r adio [18, Table 3.2]. In our settings, we choose the
path loss exponent to be n
= 3andP
0
= 2700. For two
arbitrary bounds δ
and δ
u
with property 0 <δ
<δ
u
,
the squared distances d
2
1
, , d
2
K
are selected to be uniformly
distributed on (δ
2
, δ
2
u
). Hence, the mean power has the
expression
E[P
i
] = 2P
0
/(δ
2
δ
u
+δ
δ
2
u
). Let us consider various
values of δ
between 1.2 and 3.0, and for each δ
we choose
δ
u
such that E[P
i
] = 100. Conventionally we take δ
0
=
3.0. It is easy to verify that δ
= δ
0
implies δ
u
= δ
0
,or
equivalently all the users are located on a circle whose center
coincides with the BS. Obviously, this corresponds to the case
of a homogeneous network. In fact, for all δ
∈ [1.2, 3.0],
the quantity Δ
(IV)
= δ
0
− δ
can be used to measure the
heterogeneity of the network: the bigger is Δ
(IV)
, the larger
is the difference δ
2
u
− δ
2
, which makes the values of P
i
, i ∈
{
1, , K}, more disparate.
In Figure 5, we plot the Normalized Min-Rate and the
Average AME. They are computed for each Δ
(IV)
∈ [0.2, 1.8]
based on N
r
runs, while for Δ
(IV)
= 0.0 one single realization
is considered. By comparing the results within Figure 5 with
those from Figure 2, we can observe that the multiaccess
schemes have a similar behavior for Model IV and Model I.
0
0.1
0.2
0.3
0.4
0.5
0.6
0.7
0.8
0.9
1
Δ
(III)
0 102030405060708090
Normalized Min-Rate
(a)
0
0.1
0.2
0.3
0.4
0.5
0.6
0.7
0.8
0.9
1
Δ
(III)
Average AME
0 102030405060708090
(b)
Figure 4: Experimental results for Model III: (a) Normalized Min-
Rate versus Δ
(III)
;(b)AverageAMEversusΔ
(III)
. Note that Δ
(III)
is
not expressed in dB. The number of users (K), the number of runs
(N
r
), and all graphical conventions are the same like in Figure 2.
As a final remark, we note that for all four network
models, finding the partition which corresponds to BORG
∗
K
is faster than applying the TS optimization strategy. In all
runs, the execution time for BORG
∗
K
was at about 40% of
the execution time for TS. When the number of users is
very large, the computational complexity can be decreased by
searching for BORK
K/T
with a fixed T, instead of finding the
partition BORK
∗
K
. We observe from the numerical examples
that BORK
K/2
and BORK
K/3
have an acceptable level of
performance.
4. Conclusion
Inthispaper,weinvestigatedhowOMAandSICcanbe
combined to improve fairness in Gaussian wireless networks.
The newly proposed method divides the network into
(almost) homogeneous subnetworks such that the users
within each subnetwork employ OMA, and SIC is utilized
across subnetworks. Equivalently, the K users are partitioned
into T ordered groups. The main theoretical result which
we proved for any T
∈{2, , K − 1} shows that the
ordered partition which maximizes the minimum rate can
be found with a low-complexity algorithm. Moreover, it
was demonstrated experimentally that the user grouping
strategy guarantees a good tradeoff between fairness and the
asymptotic multiuser efficiency.
8 EURASIP Journal on Wireless Communications and Networking
0
0.1
0.2
0.3
0.4
0.5
0.6
0.7
0.8
0.9
1
Δ
(IV)
0 0.2 0.4 0.6 0.8 1 1.2 1.4 1.6 1.8
Normalized Min-Rate
(a)
0
0.1
0.2
0.3
0.4
0.5
0.6
0.7
0.8
0.9
1
Δ
(IV)
Average AME
0 0.2 0.4 0.6 0.8 1 1.2 1.4 1.6 1.8
(b)
Figure 5: Experimental results for Model IV: (a) Normalized Min-
Rate versus Δ
(IV)
;(b)AverageAMEversusΔ
(IV)
. Note that Δ
(IV)
is
not expressed in dB. The number of users (K), the number of runs
(N
r
), and all graphical conventions are the same like in Figure 2.
Appendix
Proof of Theorem 1
First we demonstrate two auxiliary results that are instru-
mental in proving Theorem 1.
Lemma 3. (i) Let a, b, c>0 with b>a. The following
inequality holds:
1
b
log
1+
b
c
<
1
a
log
1+
a
c
. (A.1)
(ii) For a, b, c, d>0 that satisfy simultaneously the
conditions a>band a + c
= b + d,wehave
1
b
log
1+
b
d
<
1
a
log
1+
a
c
. (A.2)
Proof. For an arbitrary x>0, the following inequality is well
known [19]:
x
1+x
< ln
(
1+x
)
<x,(A.3)
where ln(
·) denotes the natural logarithm. By using this
result together with some elementary calculations, the
inequalities in (A.1)and(A.2) are readily obtained.
(i) Since b>a, there exists x>0 such that b
= a + x.So,
the left-hand side of (A.1) can be expressed as h(x)
=
(1/ ln 2/(a + x)) ln(1 + (a + x)/c). It is easy to check
that the first derivative of h(x)isstrictlynegativefor
all x>0:
dh
(
x
)
dx
=
1/ ln 2
a + x
1
a + x + c
−
1
a + x
ln
1+
a + x
c
<
1/ ln 2
a + x
1
a + x + c
−
1
a + x
(
a + x
)
/c
1+
(
a + x
)
/c
=
0.
(A.4)
Note that the inequality in (A.4) is a straightforward
consequence of (A.3). The fact that h(x)isamono-
tonically decreasing function proves the inequality in
(A.1).
(ii) The inequality a>bguarantees that there exists x>0
such that b
= a − x.Moreover,wehaved = c + x
because a + c
= b + d.Forallx ≥ 0, we define
h(x)
= (1/ ln 2/(a − x)) ln(1 + (a − x)/(c + x)). In
(A.2), the left-hand side is equal to h(x)withx>0,
whereas the right-hand side coincides with h(0). To
prove the inequality, it is enough to show that h(x)is
a monotonically decreasing function or, equivalently,
to verify that the first derivative of h(x) is strictly
negative:
dh
(
x
)
dx
=
1/ ln 2
(
a
− x
)
2
ln
1+
a
− x
c + x
−
1/ ln 2
(
a
− x
)(
c + x
)
<
1/ ln 2
(
a
− x
)
2
a − x
c + x
−
1/ ln 2
(
a
− x
)(
c + x
)
= 0.
(A.5)
The inequality in (A.5) was obtained by applying
(A.3).
Lemma 4. For a given set {P
1
, , P
K
},letG
σ(T)
, , G
σ(1)
and
G
σ(T)
, , G
σ(1)
be two ordered partitions from ORG
σ(·),κ
K/T
.If
there exists i
∈{1, , T − 1} such that
(C
1
) G
σ( j)
= G
σ( j)
for all j ∈{1, , T}\{i, i +1},
(C
2
) G
σ(i+1)
/
G
σ(i)
,
(C
3
) G
σ(i+1)
G
σ(i)
,
then the minimum rate corresponding to G
σ(T)
, , G
σ(1)
is not larger than the minimum rate corresponding to
G
σ(T)
, , G
σ(1)
.
Proof. Without loss of generality, we assume σ( j)
= j for all
j
∈{1, , T}. Additionally, we make the assumption that
do not exist two different users for which the received powers
are the same. With the exception of the symbol
, all the
notations employed in connection with the ordered partition
G
T
, , G
1
are the same with those utilized for G
T
, , G
1
.
The formula in (6) leads to the following expression of
the minimum rate for the users within G
j
:
R
min,j
=
P
min,j
Π
j
log
1+
Π
j
N
j
,(A.6)
where P
min,j
is the received power of the weakest user within
G
j
and N
j
= N
0
+
j−1
t
=1
Π
t
. The equation above together
EURASIP Journal on Wireless Communications and Networking 9
with condition (C
1
) lead to the identity R
min, j
= R
min,j
for
all j
∈{1, , T}\{i, i +1}.Hence,forprovingLemma 4,it
is enough to show that
min
R
min,i
, R
min,i+1
≤
min
R
min,i
, R
min,i+1
. (A.7)
This inequality can be obtained from the three results which
are outlined below.
Result 1. R
min,i+1
<R
min,i+1
.
To verify the inequality, we note that
R
min,i+1
=
P
min,i+1
Π
i+1
log
1+
Π
i+1
N
i+1
(A.8)
<
P
min,i+1
Π
i+1
log
1+
Π
i+1
N
i+1
(A.9)
<
P
min,i+1
Π
i+1
log
1+
Π
i+1
N
i+1
(A.10)
= R
min,i+1
. (A.11)
In (A.9), we use the fact that P
min,i+1
<P
min,i+1
, which is a
consequence of (C
1
)–(C
3
). The inequality in (A.10)isderived
by applying (A.2)witha
= Π
i+1
, b = Π
i+1
, c = N
i+1
,and
d
= N
i+1
.
Result 2. If P
min,i+1
<P
min,i
, then R
min,i+1
<R
min,i
.
First we consider the case Π
i+1
> Π
i
for which we get:
R
min,i+1
=
P
min,i+1
Π
i+1
log
1+
Π
i+1
N
i+1
(A.12)
=
P
min,i
Π
i+1
log
1+
Π
i+1
N
i+1
(A.13)
<
P
min,i
Π
i
log
1+
Π
i
N
i+1
(A.14)
<
P
min,i
Π
i
log
1+
Π
i
N
i
(A.15)
= R
min,i
. (A.16)
Because G
i
contains the weakest users of G
i
∪ G
i+1
, condition
P
min,i+1
<P
min,i
implies P
min,i+1
= P
min,i
, which leads to the
identity in (A.13). The inequality in (A.14)canbeverified
by operating in (A.1) the following substitutions: a
= Π
i
,
b
= Π
i+1
,andc = N
i+1
. It is easy to check that N
i+1
−N
i
= Π
i
.
Hence, N
i+1
>N
i
, which proves the inequality in (A.15).
Under the hypothesis Π
i+1
< Π
i
,wehave
R
min,i+1
=
P
min,i
Π
i+1
log
1+
Π
i+1
N
i+1
(A.17)
<
P
min,i
Π
i
log
1+
Π
i
N
i+1
+ Π
i+1
− Π
i
(A.18)
<
P
min,i
Π
i
log
1+
Π
i
N
i
(A.19)
= R
min,i
. (A.20)
The identity in (A.17) is the same with the one from (A.13).
Then we write the inequality in (A.2) for the particular case
when a
= Π
i
, b = Π
i+1
, c = N
i+1
+ Π
i+1
− Π
i
, d = N
i+1
,and
we get (A.18). Observe that c>Π
i
− Π
i
> 0. Additionally,
Π
i+1
+ Π
i
> Π
i
implies N
i+1
+ Π
i+1
− Π
i
>N
i
,whichyields
the inequality in (A.19).
Result 3. If P
min,i+1
>P
min,i
, then R
min,i
<R
min,i
. Note that
R
min,i
=
P
min,i
Π
i
log
1+
Π
i
N
i
(A.21)
=
P
min,i
Π
i
log
1+
Π
i
N
i
(A.22)
<
P
min,i
Π
i
log
1+
Π
i
N
i
(A.23)
=
P
min,i
Π
i
log
1+
Π
i
N
i
(A.24)
= R
min,i
. (A.25)
The identity in (A.22) is obtained by applying the same type
of reasoning like the one used to demonstrate (A.13). Then
we focus on (A.23 ), which is proved by choosing a
= Π
i
,
b
= Π
i
, c = N
i
in (A.1). Furthermore, we get (A.24)from
N
i
= N
i
= N
0
+
i−1
j=1
Π
j
.
The inequalities in (A.11), (A.16), (A.20), and (A.25)lead
to (A.7), which concludes the proof of Lemma 4.
Now we give the proof of the theorem.
Proof of Theorem 1. Given
{P
1
, , P
K
}, we consider the
ordered partition G
σ(T)
, , G
σ(1)
that belongs to ORG
σ(·),κ
K/T
.
For an arbitrary i
∈{1, , T − 1}, we define the following
elementary transformation, which is denoted by ET(i):
(i) if G
σ(i+1)
/
G
σ(i)
, then G
σ(T)
, , G
σ(1)
is transformed
to another ordered partition from ORG
σ(·),κ
K/T
,say
G
σ(T)
, , G
σ(1)
, such that the conditions (C
1
)and
(C
3
)fromLemma 4 are satisfied;
(ii) otherwise, the ordered partition G
σ(T)
, , G
σ(1)
remains unchanged.
Assume that we apply ET(1) to G
σ(T)
, , G
σ(1)
.The
newly obtained ordered partition is then transformed by
ET(2), and the process continues until ET(T
− 1) is applied.
Due to the definition of ET(
·), the resulting ordered partition
is guaranteed to contain the strongest user in the group
which is decoded first. If the type-vector
κ has the property
that κ
T
> 1 and the second strongest user was not yet
included in the group which is decoded first, then we move
it to this group by iterating again from ET(1) to ET(T
− 1).
When κ
T
= 1, the second strongest user can be moved to the
second decoded group by using similar transformations.
Based on the observations above, we remark that each
ordered partition from ORG
σ(·),κ
K/T
can be transformed, in a
finite number of steps, to the unique partition from ORG
σ(·),κ
K/T
which satisfies the condition in (7). Each step consists in
10 EURASIP Journal on Wireless Communications and Networking
transforming the current ordered partition to a new one by
applying ET(i), where i
∈{1, , T − 1}. We conclude the
proof by mentioning that, at each step, the minimum rate
increases or remains constant (see Lemma 4).
Acknowledgment
This work was supported by the Academy of Finland, Project
nos. 113572, 118355, 134767, and 213462.
References
[1] M. A. Maddah-Ali, A. Mobasher, and A. K. Khandani,
“Fairness in multiuser systems with polymatroid capacity
region,” IEEE Transactions on Information Theory, vol. 55, no.
5, pp. 2128–2138, 2009.
[2] S. Verdu, “Optimum multiuser asymptotic efficiency,” IEEE
Transactions on Signal Processing, vol. 34, pp. 890–897, 1986.
[3] S. Verdu, Multiuser Detection, Cambridge University Press,
Cambridge, UK, 1998.
[4] B. Yang and F. Danilo-Lemoine, “Asymptotic multiuser effi-
ciency of a decorrelator based successive interference cancella-
tion DS-CDMA multiuser receiver,” in Proceedings of Military
Communications Conference (MILCOM ’06), p. 7, 2006.
[5] D. Tse and P. Viswanath, Fundamentals of Wireless Communi-
cations, Cambridge University Press, Cambridge, UK, 2005.
[6] A. J. Viterbi, “Very low rate convolutional codes for maximum
theoretical performance of spread-spectrum multiple-access
channels,” IEEE Journal on Selected Areas in Communications,
vol. 8, no. 4, pp. 641–649, 1990.
[7] D. Warrier and U. Madhow, “On the capacity of cellular
CDMA with successive decoding and controlled power dis-
parities,” in Proceedings of the 48th IEEE Vehicular Technology
Conference (VTC ’98), vol. 3, pp. 1873–1877, Ottawa, Canada,
May 1998.
[8] R. M. Buehrer, “Code Division Multiple Access(CDMA),”
Synthesis Lectures on Communications, vol. 2, pp. 1–192, 2006.
[9] D. P. Bertsekas and R. G. Gallager, Data Networks, Prentice-
Hall, Upper Saddle River, NJ, USA, 1987.
[10] D. N. C. Tse and S. V. Hanly, “Multiaccess fading channels-
part I: polymatroid structure, optimal resource allocation
and throughput capacities,” IEEE Transactions on Information
Theory, vol. 44, no. 7, pp. 2796–2815, 1998.
[11]X.Zhang,J.Chen,S.B.Wicker,andT.Berger,“Successive
coding in multiuser information theory,” IEEE Transactions on
Information Theory, vol. 53, no. 6, pp. 2246–2254, 2007.
[12] K. W. Shum and C. W. Sung, “Fair rate allocation in
some Gaussian multiaccess channels,” in Proceedings of IEEE
International Symposium on Information Theory (ISIT ’06),pp.
163–167, Seattle, Wash, USA, July 2006.
[13] P. Flajolet and R. Sedgewick, Analytic Combinatorics,Cam-
bridge University Press, Cambridge, UK, 2009.
[14] J. Edmonds, “Submodular functions, matroids, and certain
polyhedra,” in Proceedings of Calgary International Conference
on Combinatorial Structures and Applications, pp. 69–87,
Calgar y, Canada, 1970.
[15] T. Cover and J. Thomas, Elements of Information Theory,John
Wiley & sons, New York, NY, USA, 2006.
[16] K. Jagannathan, S. Borst, P. Whiting, and E. Modiano,
“Scheduling of multi-antenna broadcast systems with hetero-
geneous users,” IEEE Journal on Selected Areas in Communica-
tions, vol. 25, no. 7, pp. 1424–1434, 2007.
[17] K. Pahlavan and P. Krishnamurthy, Principles of Wireless
Networks: A Unified Approach, Prentice-Hall, Upper Saddle
River, NJ, USA, 2002.
[18] T. S. Rappaport, Wireless Communications: Principles and
Practice, Prentice-Hall, Upper Saddle River, NJ, USA, 2002.
[19] M. Cloud and B. Drachman, Inequalities: With Applications to
Engineering, Springer, Berlin, Germany, 1998.