Báo cáo hóa học: " Research Article Link Quality-Based Transmission Power Adaptation for Reduction of Energy Consumption and Interference" pot
Bạn đang xem bản rút gọn của tài liệu. Xem và tải ngay bản đầy đủ của tài liệu tại đây (1.85 MB, 17 trang )
Hindawi Publishing Corporation
EURASIP Journal on Wireless Communications and Networking
Volume 2010, Article ID 920131, 17 pages
doi:10.1155/2010/920131
Research Article
Link Quality-Based Transmission Power Adaptation for
Reduction of Energy Consumption and Interference
Jinglong Zhou, Martin Jacobsson, and Ignas Niemegeers
Faculty of Electrical Engineering, Mathematics and Computer Science, Delft University of Technology,
P.O. Box 5031, 2628 CD Delft, The Netherlands
Correspondence should be addressed to Jinglong Zhou,
Received 28 May 2010; Accepted 1 September 2010
Academic Editor: Lin Cai
Copyright © 2010 Jinglong Zhou et al. This is an open access article distributed under the Creative Commons Attribution License,
which permits unrestricted use, distribution, and reproduction in any medium, provided the original work is properly cited.
Today, many wireless devices are mobile and battery powered. Based on the fact that battery capacity is still limited, energy saving
is an important issue in wireless communication. Meanwhile, the number of wireless devices continues to increase and this creates
interference problems between wireless devices. In this paper, we look at transmission power control and propose a mechanism
that tries to achieve minimum energy consumption or emission under any circumstance. Lower transmission power levels may
result in more retransmissions, but in total, energy consumption or emission still can be reduced in many scenarios. To evaluate
the performance of our mechanism, we used real wireless channels in an indoor environment to carry out measurements. The
measurement results indicate that a significant amount of energy consumption or emission reduction can be achieved for the
transmitter in most scenarios compared to using a fixed transmission power level for all packets.
1. Introduction
Plenty of wireless devices use battery-based power, but the
battery technology does not keep up. To increase device
service duration, saving power is crucial. Power saving in
communication can be achieved by different methods at
different communication layers. Power-aware routing selects
routes that together consume less energy or use devices that
have more energy [1]. In the MAC layer, the receiver can
turn off the receiver function periodically to save energy [2].
Another way of saving energy is to adapt the transmission
power for the transmission of packets. Power transmission
adaptation can achieve two benefits: save energy and reduce
interference. Interference is becoming an increasing problem
due to the enormously growing number of wireless devices.
One way to alleviate this problem is to reduce the emitted
transmission power.
The motivation for transmission power adaptation for
energy saving and interference reduction stems from the
fact that many of the current wireless communication
systems (e.g., IEEE 802.11 and IEEE 802.15.4) usually use a
fixed default transmission power level for all transmissions.
However, when two nodes are very close to each other,
the default power level is much higher than required to
successfully deliver all packets. This both wastes energy
and creates unnecessary interference. A lower transmission
power level may require a larger number of retransmissions,
but overall less energy will be emitted or consumed for
each transmission and in total, there may be less waste.
Therefore, a trade-off is possible between the number of
retransmissions and energy consumption for each packet
delivery. This trade-off requires the knowledge of the packet
delivery ratio (PDR) for each transmission power level.
We call this the PDR-table. The PDR-table differs between
different links and different environments. To always select
the transmission power level that consumes the least energy
or have lowest energy emission, a self-adaptive transmission
power adaptation mechanism is required that accurately
observes the PDRs. In this work, we focus on IEEE 802.11
and IEEE 802.15.4 as our experiment technology. However,
our methods can be used in other radio technologies as well.
Energy consumption for IEEE 802.11 is not so crucial
as for IEEE 802.15.4, since IEEE 802.11 is normally used
with larger devices, such as laptops, PDAs, and mobile
phones, which can be recharged easily. However, minimizing
energy emission is still important because of the interference.
2 EURASIP Journal on Wireless Communications and Networking
For IEEE 802.15.4, energy consumption is critical due to its
use in wireless sensor networks. Therefore, we mainly discuss
interference reduction for IEEE 802.11 and energy saving for
IEEE 802.15.4.
In this paper, we propose a power transmission control
mechanism that is based on gathering PDRs for every
transmission power level (the PDR-table). It consists of two
phases: initialization and updating. It can be used both as
an interference reducing mechanism and an energy saving
mechanism depending on the energy model. We propose
five different methods for the initialization phase. In the
updating phase, we use an exponential weighted moving
average (EWMA) method to update the PDR for each
transmission power level and use the result to select the
optimal level. To the best of our knowledge, we are the
first to select the transmission power that achieves the
minimum energy consumption or emission for delivering
a certain amount of information based on link PDR-tables.
We explore the maximum potential reduction of energy
emission and consumption by an investigation of all relevant
parameter combinations in our mechanism. The proposed
mechanism is evaluated based on measurement data and
the results indicate that significant savings can be achieved
in many scenarios compared to always using the default
transmission power level. We also compare our PDR-based
mechanism with one that uses signal strength. Also there, the
results indicate a significant improvement.
The rest of this paper is organized as follow: Section 2
introduces related work and Section 3 presents our measure-
ment results and shows the potential reduction of energy
consumption and emission. Our PDR-based transmission
power adaptation mechanism is introduced in Section 4.
In Section 5, our experimental system is described and in
Section 6, the measurement results are presented. The paper
is concluded in Section 7.
2. Related Work
Transmission power control requires good knowledge of the
correlation between link quality and transmission power
levels. This correlation has been studied before via mea-
surement activities. In [3, 4], the correlation of transmit
power level and packet delivery probability was analyzed
in different indoor scenarios. Based on their observations,
small adaptations in the power level do not change the
packet delivery ratio in any measurable way. Some work
also discussed combinations of power and rate adaptation
to achieve good performance. In [5], it was proposed to
select data rate and transmission power based on link quality.
The method was applied in an indoor environment and
achieved higher throughput than the traditional mechanism.
However, energy consumption was not calculated.
Most previous work on applying transmission power
adaptation schemes was more focused on reducing interfer-
ence, maintain connectivity, and topology control, such as
[6–9]. Paper [10] discusses the use of transmission power
control to select reliable links and disable unreliable links
via a blacklisting method in order to improve the system
performance. Paper [11] discusses the use of transmission
power control to reduce interference and simulation results
reveal that throughput can be increased by adapting the
transmission power in an ad hoc network. This shows the
benefit of reducing energy emission. However, the aim of
these papers were to maintain the link quality at a certain
level, control the topology, and increase throughput by
using transmission power adaptation. Energy was not their
main focus and the selected transmission power level does
not always result in the minimum energy consumption or
emission level.
A few papers address energy saving explicitly. The
authors of [12] proposed to use a RTS-CTS handshake in the
highest power level to discover the channel quality and then
use the lowest possible power level for the data packet. Simu-
lation results show that the proposed power mechanisms can
achieve energy savings without degrading the throughput.
However, in their proposal, a separate channel is used for
controlling, which means that adaptations to the IEEE 802.11
standard are necessary. Meanwhile, a theoretical model does
not reflect the real channel situation accurately. In [13], a
loop-based mechanism is used to adapt the transmission
power level to achieve the minimum required power level
for message delivering. Simulation results show that energy
can be saved and throughput can be increased. However,
this work also assumes that a RTS-CTS handshake is used.
Moreover, a mechanism that adapts the transmission power
level one level at the time will be too slow for fast channel
variances. It may take several periods for the system to choose
the appropriate power level.
In [14], the authors propose a power saving algorithm
that adjusts the transmission power and extends the network
lifetime. Again, only simulations are used to validate the
proposed protocol. Paper [15] is the most similar work to
ours; transmission power adaptation was used for power
saving in different scenarios. However, the optimal trans-
mission power level is set by the received signal strength.
We use PDR information for two reasons. First of all, the
mapping between PDR and received signal strength is not
straight forward and noise and interference have a large
impact on the mapping. Second, different receivers have
different sensitivity levels and using received signal strength
may require different thresholds for different devices. A PDR-
table method is affected by different devices. We compare this
mechanism with our mechanism in Section 6.
3. Energy Emission and Consumption
Measurements
To minimize the energy consumption or emission for
successfully delivering a fixed amount of information, such as
a certain number of packets, we turn to the expected energy
consumption or emission. We calculate the expected total
energy consumption or emission for one packet delivery as
follows:
E
= P ·N · T,
(1)
EURASIP Journal on Wireless Communications and Networking 3
Tr an sm i t
electronics
P
E
TX
P
E
RX
P
S
P
RF
P
R
Receive
electronics
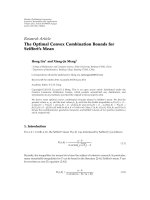
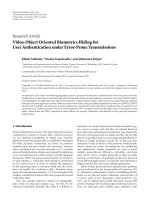
Figure 1: The high level block model of an RF link.
where E is the total energy consumption or emission for
successfully delivering one packet (in Joules). P is either
the energy emission or the energy consumption (in Watt),
N is the expected required number of transmissions to
successfully deliver a packet (i.e., N
= 1/PDR), and T is the
duration (in seconds) for one packet transmission including
headers and preambles. We can see that if we use a single
data rate and packet-size, T will be a constant value. E can be
calculated for each transmission power level and the result
can be used to find the optimal level, that is, the one with
the lowest E. Depending on what P valueweuse,wewill
optimize for different things. For instance, if we are interested
in minimizing energy emission we use the following formula:
P
= P
RF
,(2)
where P
RF
is the energy emission created by the transmission
power level. For IEEE 802.11, the transmission power range
is from 0 to 15 dBm and for IEEE 802.15.4, it is from
−25
to 0 dBm [16]. Our 802.15.4 device has 31 different power
levels, but we used only 15 of them, which we calculate in
this simplified way: level 3 corresponds to
−23 dBm and
level 31 corresponds to 0 dBm and then we assume a linear
correlation to map the transmission power levels in between
to the different energy emission levels in dBm.
For minimizing the energy consumption, we also need
to consider the energy consumption of the wireless device
circuit, the energy consumption (P
E
TX
) of other parts, and the
wireless card amplifier energy consumption (P
S
) as shown in
Figure 1. While P
S
is dependent on the transmission power
level, P
E
TX
is not.
For calculating the total energy consumption, we refer
to the results in [17, Figure 5]. Since measuring the PDR
introduces a lot of inaccuracies, we do not need a perfect
approximation of the energy consumption. Hence, we can
simply use the following linear equations for approximating
the energy consumption:
P
= 10 ·P
RF
+ 1400;
(
for IEEE 802.11
)
,(3)
P
= 35 ·P
RF
+ 30;
(
for IEEE 802.15.4
)
. (4)
If we only calculate the energy emission to the environ-
ment, (1)and(2) are used. If we calculate the total energy
consumption of the whole transmitter, (1) and either (3)or
(4)areused.
To capture the accurate correlation between transmission
power and PDR, a measurement-based method has to be
used. For this reason, we carried out measurements in an
indoor environment with different radios and configura-
tions. For all experiments, the same number of packets
(2000) were sent with 15 different transmission power levels.
Two di fferent radio technologies were used, IEEE 802.11 and
IEEE 802.15.4. Let us first start with IEEE 802.11. We used
UDP with a fixed packet-size of 1500 Bytes including the
IP header due to the fact that this packet-size is common
in the Internet traffic[18]. We ran some indoor scenarios
with different locations, but with a fixed data rate. Then we
tried different data rates in the same location. The results are
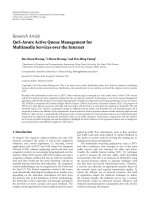
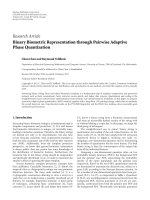
presented in Figure 2. The first group of experiments were
done with 2 Mbps data rate in three different scenarios, using
different distances between the sender and the receiver. The
measurement PDR-table of the three stationary scenarios
is plotted in Figure 2(a). The second group of experiments
were done with different data rates and are presented in
Figure 2(b). All scenarios and the experiment setup details
are further described in Section 5.
At the receiver side, we recorded the PDR for each
transmission power level. When doing this for our scenarios,
we obtained the results in Figures 2(c) and 2(e). We can see
that a certain transmit power level achieves the minimum
energy emission or consumption and they are different for
different links. The minimum energy emission level for each
link in Figure 2(c) is 3, 6 and 9 for each link, respectively. For
the energy consumption, we use log scale to show the results
due to the large differences. We can still see that there is a
level which results in the lowest energy consumption for the
transmitter, and this level is not the highest power level.
To show that this phenomenon not only exists for IEEE
802.11 with 2 Mbps data rate, we carried out measurements
for many data rates. The power trade-off for IEEE 802.11
with different rates is presented in Figures 2(d) and 2(f).
It is interesting to see that for higher data rates, for
example, 54 Mbps, the level that results in minimum energy
consumption and emission is 15. This is caused by the fact
that the link quality is so poor and struggles even with full
power.
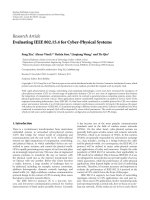
In Figure 3(a), the PDR-table with diff
erent transmission
power levels but with a fixed packet-size in IEEE 802.15.4
is presented. We can see that although the power level
is different from IEEE 802.11, the results are similar to
Figure 2(a). For IEEE 802.15.4, only one data rate is possible,
but we can change the packet-size. When we change the
packet-size in Figure 3(b), we can see some PDR changes.
However, the PDR difference is not very obvious. We also
calculated the expected energy emission and consumption
for IEEE 802.15.4 and present the results in Figures 3(c) and
3(e). The power trade-off for IEEE 802.15.4 with different
packet-sizes is presented in Figures 3(d) and 3(f).The
expected energy emission and consumption are calculated
and compared with the case where we assume that every
link had to deliver the same amount of bytes. We used
100 Byte as assumed payload, which means for a 20 Byte
packet payload, one needs to deliver five packets to reach the
same information delivery. In the same way, one needs two
50 Byte packets.
Based on the four groups of results shown in Figures
2 and 3, we can see that almost all the links have a
PDR from 0 to 1 within a 10 dBm transmission power
difference. In almost all situations, the PDR is higher for
4 EURASIP Journal on Wireless Communications and Networking
0
0.1
0.2
0.3
PDR
0.4
0.5
0.6
0.7
0.8
0.9
1
0
Transmission power level (dBm)
51015
(a) PDR: 2 Mbps
0
0.1
0.2
0.3
PDR
0.4
0.5
0.6
0.7
0.8
0.9
1
0
Transmission power level (dBm)
51015
(b) PDR: Various datarates
0
50
100
150
Expected energy emission (mJ)
200
250
300
350
400
450
500
0
Transmission power level (dBm)
51015
(c) Expected energy emission: 2 Mbps
0
50
100
150
Expected energy emission (mJ)
200
250
300
350
400
450
500
0
Transmission power level (dBm)
51015
(d) Expected energy emission: Various datarates
10
4
10
5
10
6
Expected energy consumption (mJ)
10
7
10
8
10
9
10
10
02
S1
S2
S3
4
Transmission power level (dBm)
6 8 10 12 14 15
(e) Expected energy consumption: 2 Mbps
10
3
10
4
10
5
Expected energy consumption (mJ)
10
6
10
7
10
8
10
9
02
2Mbps
5.5Mbps
6Mbps
54 Mbps
11 Mbps
4
Transmission power level (dBm)
6 8 10 12 14 15
(f) Expected energy consumption: Various datarates
Figure 2: The PDR-table and expected energy emission and consumption for IEEE 802.11.
EURASIP Journal on Wireless Communications and Networking 5
larger transmission power levels. From Figures 2(c) and 3(c),
we can see that given a data rate and packet-size, links with
better PDR always requires less energy emission and con-
sumption to deliver the same number of packets. However,
if we are also able to change the data rate and packet-
size, it is possible to further lower the energy emission and
consumption.
4. PDR-Based Transmission Power Control
For a certain channel, if the correlation between P, N,andT
is known and constant, the best combination can be selected
easily. However, the actual channel PDR-table can be quite
different from link to link as shown in Figures 2 and 3 and
this is also indicated in [3]. Therefore, to have an efficient
transmission power control, we need a good mechanism of
learning this PDR-table in real time. Meanwhile, the PDR-
table may change due to several reasons, such as mobility,
environmental changes, and interference. Hence, a self-
adapting mechanism is required.
For each link, we need to keep a PDR-table that
contains all the N values for the different transmission power
levels. The PDR-table may contain values for all possible
transmission levels or only a subset of them. The P values are
not dynamic and can be calculated beforehand for each of the
transmission power level based on the chosen energy model.
Since (1) will be used for both the energy emission and
consumption calculation, we can use the same transmission
power control mechanism for both.
We divided the mechanism into two phases; the initializa-
tion phase and the updating phase. The initialization phase
tries to quickly learn or “guess” the correlation between the
transmit power level and the PDR once a new commu-
nication link is established. The updating phase keeps on
updating this PDR-table and adapts the transmission power
during the whole communication period. The initialization
phase should be very short compared to the updating phase.
Hence, the initialization phase is more useful for small
amounts of traffic and the updating phase is more useful for
large amounts of traffic. We describe the two phases in detail
in the following two sections.
For neither phase, we do not generate any extra packets
to probe the PDR-table. Instead, we use the normal data
packets to “learn” the channel and select the appropriate
transmission power level. If acknowledgments are being
used, which is the case for most wireless links, including
802.11 and 802.15.4, the sender can use them to find out
about the packet losses. Otherwise, this information needs
to be passed back to the sender in another way. The energy
emission or consumption calculation for all methods have
the same prerequisite, the same amount of information need
to be delivered.
4.1. Initialization Phase. In the initialization phase, different
methods can be used to learn or “guess” the correlation
between PDR and transmission power level and populate
the PDR-table. We propose four initialization methods and
compare them with the default method that always transmits
with maximum transmission power, which we call “Fixed”.
We introduce all four methods as follow:
(i) Default start. Start using the default power level
(15 dBm in 802.11 or 0 dBm in 802.15.4) and then
immediately move on to the updating phase. This
means only one packet is transmitted and depending
on whether it was received or not N
= 0or∞ for the
default power level. The remaining Ns in the PDR-
table are set to
∞.
(ii) Sampling. Send 10 packets in all transmission levels
to probe the channel and then use the obtained
measurements to build the initial PDR-table and then
move on to the updating phase.
(iii) Historical. Use the last recoded PDR-table (recorded
based on the latest communication record between
two nodes). The sender sends 10 small packets
(40 Bytes) with full transmission power and the
receiver reads and sends back the received signal
strength. The sender then compares this with the
received signal strength recorded last time. The
original table is shifted left or right with the difference
value based on the signal strength difference and
forms the new PDR-table.
(iv) Combined. First collect the received signal strength
as in the Historical method. If the signal strength
between now and the previous communication are
similar (within 2 dBm difference), the Historical
method is used. Otherwise, the Sampling method is
used.
A better initialization method starts closer and converges
faster to the optimal transmit power. In Section 6.1.1,wewill
compare all these methods with the Fixed method, which
sends all packets with default power level during both the
initialization and updating phases and hence makes no use
of the PDR knowledge.
4.2. Updating Phase. In the updating phase, most packets
are transmitted with the transmission power level that min-
imizes (1). If two levels have the same power consumption,
then the higher transmission power level will be used.
The estimated PDR for the other power levels also needs
to be updated, since the whole PDR-table is dynamic if
the link changes. Therefore, we propose to send a certain
percentage of packets using a randomly selected power level
other than the current one. In this way, the estimated PDR
for all power levels can be updated. Periodically, we calculate
the PDR for each level by dividing the number of received
packets with the number of sent packets during that period.
To have a controllable smooth updating process for all the
information, we use an EWMA method as in (5),
E
t+1
= αX
t
+
(
1 − α
)
E
t
,(5)
where the E
t
means the current estimation of PDR for a
certain transmission power level in interval t, X
t
is the
calculation of PDR for this power level in interval t, and the
smoothing factor α is used to tune the speed of updating.
6 EURASIP Journal on Wireless Communications and Networking
0
0.1
0.2
0.3
PDR
0.4
0.5
0.6
0.7
0.8
0.9
1
59
Transmission power level
13 17 21 25 29 31
(a) PDR: 20 Bytes
0
0.1
0.2
0.3
PDR
0.4
0.5
0.6
0.7
0.8
0.9
59
Transmission power level
13 17 21 25 29 31
(b) PDR: Various packet sizes
0
0.5
1
Expected energy emission (mJ)
1.5
2
2.5
3
3.5
4
59
Transmission power level
13 17 21 25 29 31
(c) Expected energy emission: 20 Bytes
0
2
4
Expected energy emission (mJ)
6
8
10
12
14
59
Transmission power level
13 17 21 25 29 31
(d) Expected energy emission: Various packet sizes
10
1
10
2
10
3
Expected energy consumption (mJ)
10
4
10
5
10
6
T1
T2
T3
T4
59
Transmission power level
13 17 21 25 29 31
(e) Expected energy consumption: 20 Bytes
10
2
10
3
Expected energy consumption (mJ)
10
4
5 ∗20 Bytes
2
∗50Bytes
1
∗100Bytes
59
Transmission power level (dBm)
13 17 21 25 29 31
(f) Expected energy consumption: Various packet sizes
Figure 3: The PDR-table and expected energy emission and consumption for IEEE 802.15.4.
EURASIP Journal on Wireless Communications and Networking 7
This is only done for N values that had a transmission in
the PDR-table during the interval. We used an interval of 10
packets.
We defined another parameter which controls the prob-
ability that a packet will use another level than the selected
optimal level. This probability is defined as β. The level to
probe is selected uniformly among the other levels in the
PDR-table. The performance of the updating phase with
different α and β is investigated in Section 6.1.2.
5. Experimental Setup
All experiments were carried out in a typical indoor office
environment. They were done at night when there were very
few people walking around. For each scenario, we collected a
packet trace and used a post processing approach to compare
every method and parameter. In this way, every parameter
combination could be compared based on the same actual
link in a fair way.
5.1. IEEE 802.11 Test-Bed. For all our IEEE 802.11 experi-
ments, we used two HP laptops (HP7400) equipped with
3Com 108 Mbps 11g XJACK PC wireless cards. Linux 2.6
and the Madwifi driver version 0.9.4 were used. We specially
wrote a one-hop communication program, which had a
sender and a receiver part. The node running the sender
program controlled the transmission power level for each
packet transmission. A fixed packet-size (1500 Bytes) was
used during all experiments. We used broadcast packets
to avoid MAC level retransmissions and the receiver side
recorded the number of received packets. In a real system,
feedback from the retransmission mechanism can be used
instead.
We used channel 7 during the experiments. Long dura-
tion observations were done of the noise level for this channel
and the value was around
−96 dBm with a maximum
variance of 2 dBm. Different distances (8, 16, and 20 meters,
resp.) were used in the experiments to generate different
channel conditions, but always nonline of sight (NLOS). We
name these scenarios as S1, S2, and S3. For the experiments
with different data rates, we used a distance of 20 m with
another NLOS channel. Therefore, we call it S4.
5.2. IEEE 802.15.4 Test-Bed. We used an IEEE 802.15.4
compliant device in the 2.4 GHz ISM band from Moteiv,
called Tmote sky that uses the CC2420 wireless chip [16].
During the experiment, the USB was used as power supply.
As in IEEE 802.11, we also wrote a one-hop communication
program for these devices. We used three different payload
sizes. They were 20, 50 and 100 Bytes. IEEE 802.15.4
has a packet header, which consists of 11 Bytes of PHY
header and 6 Bytes MAC header. The standard data rate
(250 kbps) was used during all experiments. We used only 15
different transmission power levels for the Tmote to be more
comparable with our 802.11 experiments. Since there are 31
possible levels, we only used the odd levels between 3 and 31.
Based on [16], they correspond to dBm as follows: Level 3
corresponds to
−23 dBm, level 31 to 0 dBm and the levels in
between are mapped in an almost linear fashion.
All the experiments were done in a channel that did
not interfere with any IEEE 802.11 radio. We also did
experiments in a channel that was impacted by IEEE 802.11
radio interference and found that the result was not much
influenced. We used broadcast packets in the same way as
in IEEE 802.11. We recorded the number of received packets
and the used transmission power levels.
The IEEE 802.15.4 experiments were done in the same
location as for IEEE 802.11, however, different distances were
used. All channel were NLOS and the distances were 12, 14,
16, 18 m, respectively. We call these experiment scenarios
T1 to T4. The experiments with different packet-sizes were
done with 17 m between the sender and receiver with a NLOS
channel.
5.3. Exper iment Methodology. For each scenario, we collected
a data trace by sending 30000 packets with different power
levels during a period of 20 minutes. To be able to compare
fairly between different methods and parameters, we used a
post processing approach. In this approach, we took the trace
and divided it into 200 batches. Each batch contained 150
packets, 10 packets of each power level. For each method and
parameter combination, we emulated the process. This was
done by assuming that only 10 packets were sent from each
batch and it was up to the method to decide which power
levels to pick. That is, for each emulation, only a fraction of
the trace was used.
For the updating phase, (1
− β)% of the 10 packets were
assumed to be transmitted with the currently selected best
power level and β% were assumed to be sent for probing the
other power levels. These assumed packets were randomly
selected from the trace, based on the power level and the
batch it belonged to. From the trace, we checked whether
the selected packets were received or not and used this
information in the method. An important issue is that, due to
the limited number of packets on each nonbest transmission
power level (e.g., 10
·10% for each interval is only 1 packet),
the PDR for each transmission power level is only updated
when there is a packet transmission in this interval. Since this
random selection introduces variance, we repeated this pro-
cess 300 times and calculated the mean and 95% confidence
interval.
Parts of the packets are sent in the initialization phase
and parts are in the updating phase. Each transmission was
done with a certain transmission power level and took a
certain duration. Therefore, the total energy emission or
consumption was the sum of all energy emitted or consumed
for all the transmissions. We processed the data using this
method several times and due to some random factors in the
processing, the total energy emission from each processing
are hardly exactly the same. However, they are quite similar
and the confidence intervals are very small, so we did not
plot them and only plotted the average expected energy
emission for a certain method and parameter combination.
We did the same processing for the updating phase as
well.
8 EURASIP Journal on Wireless Communications and Networking
Unfortunately our IEEE 802.11 card did not support fast
power variation. Based on measurements, we could conclude
that it took our card about 1 second to change from the
highest to the lowest transmission power level. Hence, we
divided the time into intervals, each of 8 seconds long. In
each interval, we first transmitted 200 packets with one
transmission power level and then paused for two seconds.
Right after the pause, we modified the power level to the
next level and waited two seconds. The power level was
changed in a round robin fashion between all 15 levels. For
IEEE 802.15.4, we changed the power level per packet, which
caused no problems.
6. Performance Evaluation
In this section, we evaluate the performance of our PDR-
based mechanism. The energy emission and energy con-
sumption are discussed in the following two sections, starting
with the energy emission. In Section 6.3,welookatstrategies
to optimize both.
6.1. Energy Emission Reduction. First, we present the emis-
sion reduction results for both the initialization and updating
phases.
6.1.1. Initialization Phase. The target of the initialization
phase is to quickly populate the PDR-table and select a
good transmission power level to start with and then enter
the updating phase as explained in Section 4.1. In this
comparison, a fixed α value of 0.2 and a fixed percent of
probing packets of β
= 10% were used in the updating
phase. We tried different α and β values in Section 6.1.2.For
the Historical method, we used the PDR-table learned from
the same location one day earlier. In Figure 4,wepresent
an example of how each initialization phase selects the best
transmission power level in each batch for IEEE 802.11. We
can see that all methods, except Fixed, converge to the best
transmit power level (around 2 dBm) after no more than 50
batches (corresponding to 500 s or 500 transmitted packets).
We calculated the total expected energy emission for
the first 60 batches of each method and present the results
in Figure 5. The number of 60 batches is selected due to
the reason that after this time, all the methods definitely
go to the updating phase. The expected energy emission
means the required energy needed to be generated to the
environment to deliver a certain amount of information, that
is, to successfully transmit all 2000 packets. We can see that
all our proposed initialization methods can reduce the energy
emission compared to the Fixed method. The Historical and
Sampling methods can further reduce the energy emission
compared to Default start. The Combined method achieved
the best performance, which indicates that using an accurate
PDR-table is essential for a good initialization phase.
6.1.2. Updating Phase
(i) IEEE 802.11. For the updating phase, we need to find
the optimal α to use in (5). To have a fair comparison of
0
2
4
Transmission power level (dBm)
6
8
10
12
14
16
010
Fixed
Default start
Sampling
Combined
Historical
Batches
20 30 40 50 60
Figure 4: The selected best power level in each time interval by
different methods in scenario 1 (IEEE 802.11).
0
20
40
60
Expected energy emission (mJ)
80
100
120
140
160
180
200
Scenario 1
Fixed
Default start
Sampling
Combined
Historical
Scenario 2 Scenario 3
Figure 5: The initialization phase performance comparison (IEEE
802.11).
all different α values, we fixed all the other parameters. The
percentage of probing packets, β, was set to 10% and we used
the Default start method. For each α value, we calculated the
average expected energy emission of 300 experiments and
show the result in Figure 6(a) based on all 200 batches from
the trace. We can see that when α>0, the energy emission
decreases compared to when no updating is done (α
= 0,
always using 15 dBm) and that different links have different
optimal α. We can also see that when α>0.2, no major
improvements can be seen. Since a smaller α is better for
mobile scenarios, we propose to use α
= 0.2.
Another parameter to investigate is β. Figure 6(b) shows
the results of using α
= 0.5 and different amounts of probing
EURASIP Journal on Wireless Communications and Networking 9
0
50
100
150
Expected energy emission (mJ)
200
250
300
350
400
0 0.1 0.2 0.3 0.4 0.5
α
0.6 0.7 0.8 0.9 1
S1
S2
S3
(a) best α
0
20
40
60
80
Expected energy emission (mJ)
100
120
160
180
140
200
01020
β
30 40 50
S1
S2
S3
(b) best β
Figure 6: The best α and β for IEEE 802.11, 2 Mbps.
Table 1: Quantitative comparison of expected energy emission for
the updating phase: IEEE 802.11.
Scenario S1 S2 S3
Fixed (mJ) 379.44 379.44 379.44
PDR-based (mJ) 41.87 67.78 161.42
Reduction
−89% −84% −57%
packets. We can see that for each scenario, the optimal
β values for each link are all between 5 to 10%, which
suggests that we should not send too many packets to probe
other transmission power levels. However, the optimal β is
different for each link. The general rule is that, when the link
is worse (PDR is lower for most power levels), the optimal
β is larger, which suggest that for lossy links, more probing
should be done. However, a value of 10% performs well
enough for all scenarios.
Using α
= 0.2andβ = 10%, we made a general
comparison in Tab le 1 between the PDR-based method and
the Fixed method of always using 15 dBm. Default start was
used in the initialization phase. We can see that for each
scenario, the energy emission is much less than for the Fixed
method.
(ii) IEEE 802.15.4. We used the same processing code to
process the results for IEEE 802.15.4, but with the traces
from scenario T1 to T4. To have a fair comparison of all
different α values, we fixed β at 10%. We used the maximum
transmission power level (31) to start. Based on Figure 7(a),
we can see that we got similar results as in Figure 6(a). When
α is larger than 0.1, the expected energy consumption is
much smaller than the expected energy consumption when
α equal to 0. There is not much difference when α is larger
than 0.1.
We further processed the measurement results with the
assumption that α is equal to 0.5 and we compared the
expected energy emission with different β values, from 1 to
50. The results are shown in Figure 7(b). The optimal β value
for α
= 0.5 is around 5% and more probes will result in more
energy emission.
To have a better comparison between different α and β
in each scenario, we calculated all the combinations for α
valuesfrom0to1instepsof0.05 and β values from 1 to
50 in steps of 1.0. In Figure 8, we use a 3D graph to show the
expected energy emission for all combinations. A common
trend is that when α
= 0, which means no update at all
and always use the highest transmission power level, the
energy emission is much larger compared to when α>0.
In Figure 8(a), we can see that it is very obvious that larger
β values will result in more energy emission. This is because
the optimal transmission power level is 5 and higher power
levels will cost more energy for each transmission. Most
power levels are not worth to be probed, therefore, a larger
β results in more energy waste. When the channel becomes
worse, the expected energy emission with different β is less,
which is most obvious in Figure 8(d). Another interesting
result is that there are more fluctuations when α or β increase
in scenarios with worse channels, which can be seen in
Figure 8(d).
Similar to Tab l e 1 , we calculated the total energy emission
for each scenario with α
= 0.2andβ = 10% and present the
results in Ta b le 2 . The best α and β values are also included
in the table. We can see that the PDR-based method only
emits about 20% to 53% percent of the energy compared
to the Fixed method. We also present the values based on
the optimal α and β selection from Figure 8. We can see that
in most cases, we are very close to the optimum simply by
using α
= 0.2andβ = 10%, which means we can use this
combination for almost all the scenarios.
10 EURASIP Journal on Wireless Communications and Networking
0
0.5
1
Expected energy emission (mJ)
1.5
2
2.5
3
0 0.1 0.2 0.3 0.4 0.5
α
0.6 0.7 0.8 0.9 1
T1
T2
T3
T4
(a) best α
0
0.5
1
Expected energy emission (mJ)
1.5
2
2.5
01020
β
30 40 50
T1
T2
T3
T4
(b) best β
Figure 7: The best α and β for IEEE 802.15.4, 20 Bytes.
0
0.5
Expected energy emission (mJ)
1
1.5
0
0.2
0.4
0.6
α
0.8
10
10
β
20
30
40
50
(a) T1
0.5
1
Expected energy emission (mJ)
1.5
2
0
0.2
0.4
0.6
α
0.8
1
0
10
β
20
30
40
50
(b) T2
1
1.5
2
Expected energy emission (mJ)
2.5
3
0
0.2
0.4
0.6
α
0.8
1
0
10
β
20
30
40
50
(c) T3
1.5
2
2.5
Expected energy emission (mJ)
3
3.5
4
0
0.2
0.4
0.6
α
0.8
10
10
β
20
30
40
50
(d) T4
Figure 8: 3D α and β combinations for different Scenarios (802.15.4).
EURASIP Journal on Wireless Communications and Networking 11
Table 2: Quantitative comparison of expected energy emission for
the updating phase: IEEE 802.15.4.
Scenario
T1 T2 T3 T4
Fixed (mJ)
1.3496 1.8223 2.8932 3.6682
PDR-based (mJ)
0.2735 0.5865 1.1863 1.9430
Reduction
−80% −68% −59% −47%
PDR-based (optimal)
(mJ)
0.1428 0.5621 1.11572 1.9118
Optimal α
0.15 0.50.35 0.35
Optimal β
2% 10% 14% 28%
6.1.3. Impacting Factors for the Updating Phase. The results
presented in Section 6.1.2 are all with the same configuration
for different scenarios. To make it more practical to the
real world, we further evaluated the performance of the
updating phase by studying factors that may influence the
performance, such as transmission data rate, packet-size,
mobility, and time dependence.
(i) Data Rate. IEEE 802.11 offers multiple data rates. Based
on different channel conditions, different modulation and
coding schemes can be used to achieve the highest through-
put. The main question is whether the results in Section 6.1.2
are valid for other data rates or not. Moreover, from the
energy emission perspective, the highest throughput data
rate may not be the one that saves the most energy. We post
processed the measurement traces shown in Figure 2(b) to
see the impact of α and β and display it in Figure 9(a).
We can see that for the three experiments with lower data
rates (2, 5.5, 6 Mbps), the effect is the same as in Figure 6(a).
However, for the high rates (11, 54 Mbps), due to the lower
PDR at almost all the transmission power levels, the updating
phase cannot do much to reduce energy emission and
15 dBm is optimal. Therefore, α does not have much impact
on the performance. Since these experiments were done in
the same location, we can see that 5.5 Mbps is the most power
saving data rate. However, if we change to another location
with another distance, another data rate may be optimal,
which suggests that not only the transmission power level,
but also the data rate can be selected to save power.
Concerning β, low data rates need more probe packets to
update the PDR information. For the higher data rates in this
experiment, most other power levels will directly result in
packet drops. Therefore, probing more on other power levels
increases the expected energy emission. In other scenarios,
this may not be the case.
(ii) Packet Size. It is also important to know the performance
with different packet-sizes. In order to experiment with
different packet-sizes over a similar link, we used 802.15.4
and changed the packet sending method. For each packet-
size, we sent 30000 packets in 200 batches. We splitted each of
the three different packet-size experiments into 10 equalled
sized parts and we interleaved the parts of the experiments
in a round robin fashion. In this way, the three packet-sizes
experiment are experiencing very similar channel conditions.
By interleaving, we mitigate unfairness caused by slowly
changing link conditions.
We again calculated the best α and β using our post
processing method and got the results in Figure 10. For the
best β, the conclusion is similar as previously. However, it
is interesting to see the result for the best α. When α
= 0,
the energy emission is still very high. However, a larger α
will have less energy emission. To deliver the same amount
of information, a larger packet-size emits less energy in this
scenario.
(iii) Mobility. Since all the scenarios are stationary, we still
need to investigate the performance in a mobile environ-
ment. Instead of moving the devices around, which is time
consuming and difficult to replicate between experiments, we
emulated a mobile channel by stitching together the traces
from scenario T1, T2, and T3. The way we generate mobility
is not ideal, but it still gives us some insights. It shows how
channel variance can affect the selection of α and β,whichis
our interest.
The measurement results were segmented into different
numbers of batches based on different mobility level assump-
tions. The mobile channel went from good (T1), to medium
(T2), to bad quality (T3). To emulate different amount
of mobility, we stayed with the same scenario data for
different amount of time before changing to the next scenario
trace. We used four different PDR change speeds, which we
measured in number of batches. A mobility scenario which
changes trace every 10 batches, that is, Mobility-10, is more
mobile than one which changes only every 100 batches, that
is, Mobility-100.
We plot the performance of different α for different
mobility levels in Figure 11. We can see that for low mobility
levels, for example, Mobility-100, the best α is not big. When
the mobility level increases, the best α also increase. This
conclusion does not hold for the situation with Mobility-10,
in which the mobility is quite high. It is interesting to note
that despite different mobility levels, the expected minimum
energy emission remains similar. Less mobility will decrease
the minimum expected energy emission, but not significant.
We also plotted all the combinations of the α and β for
different mobility levels with 3D graphs in Figure 12.The
results are similar to the previous 3D results in Figure 8.
However, it is obvious that with higher mobility, the best
α value gradually increases, except for Figure 12(a).Perhaps
somewhat surprising, different mobility levels do not cause
too much impact on the optimal β value. Furthermore, the
minimum expected energy emission is similar for all levels of
mobility. Hence, mobility does not affect α and β very much.
(iv) Variance over Time. To study the change of the optimal
α value over time, we segmented the experiments into 5
different pieces in the time domain and used the same
method as previously to select the best α for each piece.
The results for both IEEE 802.11 and 802.15.4 are shown in
Figure 13. We found that the optimal selection for α changes
over time for all links. However, the difference in energy
emission between the different α values is not significant,
12 EURASIP Journal on Wireless Communications and Networking
0
50
100
150
Expected energy emission (mJ)
200
250
300
350
0 0.1 0.2 0.3 0.4 0.5
α
0.6 0.7 0.8 0.9 1
5.5Mbps
2Mbps
6Mbps
11 Mbps
54 Mbps
(a) best α
0
50
100
Expected energy emission (mJ)
150
250
200
300
01020
β
30 40 50
2Mbps
5.5Mbps
6Mbps
11 Mbps
54 Mbps
(b) best β
Figure 9: The best α and β for IEEE 802.11 with difference data rates.
0.5
1.5
2
2.5
1
Expected energy emission (mJ)
3
3.5
4.5
4
5
5.5
0 0.1 0.2 0.3 0.4 0.5
Best α
0.6 0.7 0.8 0.9 1
20 Bytes
50 Bytes
100 Bytes
(a) best α
0.5
1
2
1.5
Expected energy emission (mJ)
2.5
3
3.5
01020
Best β
30 40 50
20 Bytes
50 Bytes
100 Bytes
(b) best β
Figure 10: The best α and β for IEEE 802.15.4 with difference packet-sizes.
given the results in Figure 6(a). Therefore, in practice, one
should just stick to one fixed α as long as α
≥ 0.1. For IEEE
802.15.4, the variance of the optimal α is larger over time,
but still the energy emission difference is small as shown in
Figure 7(a).
6.1.4. Discussion. Although all experiments were done with
only changing the transmission power levels, our PDR-based
method can also be applied to multi-factor environments.
For example, we can keep records of three different data rates
(or packet-sizes) but only five different power levels instead
of all 15. The selection would then involve finding the most
optimal rate (packet-size) and power level combination. It is
also obvious to see that if proper α and β values are selected,
the energy emission can be reduced in most scenarios.
6.2. Energy Consumption Reduction. Since energy saving is
more important for IEEE 802.15.4 devices, we also need
to look at reducing the energy consumption by means of
selecting the transmission power level. To do this, we used
the trace files of the IEEE 802.15.4 radios from scenario T1,
T2, and T4. However, we replaced the energy model and
EURASIP Journal on Wireless Communications and Networking 13
1.5
2.5
2
Expected energy emission (mJ)
3
3.5
4
4.5
0 0.1 0.2 0.3 0.4 0.5
α
0.6 0.7 0.8 0.9 1
Mobility-10
Mobility-20
Mobility-50
Mobility-100
Figure 11: The best alpha value with different levels of mobility.
used P = 35 · P
RF
+ 30 instead. Then we did the same
experiments as in the previous section. We show the results
in Figure 14 and we can see that we got similar conclusions
with respect to α and β as the results in Figure 7.Themain
difference is that the expected energy consumption is much
larger than the expected energy emission due to the fact that
most consumed energy is not emitted. Due to the similarity
of the results, we do not present more results for the energy
consumption calculation for other situations. Instead, to
better demonstrate the effectiveness of our mechanism, we
compare it with a typical signal strength-based algorithm
proposed in [15]. We used their aggressive method in our
comparison, since it was claimed by the authors to have
better performance. We briefly introduce their mechanism
as follows.
The mechanism uses the received packets’ signal strength
to adapt the transmission power level. This received signal
strength is denoted as R. An EWMA method (see (5)) is used
to smooth R with α
= 0.8 and then denoted as
R.Everytimea
packet is received,
R is updated and then one of the following
is done:
if
R<T
L
, double the transmit power;
if T
L
≤
R ≤ T
H
, keep the same transmit power;
if
R>T
H
, reduce the transmit power by a constant;
(6)
where T
L
=−85 dBm and T
H
=−80 dBm for our wireless
chip CC2420 according to [15].
During the implementation, we found that there is a
logical error in the mechanism. If a packet is lost, no
new signal strength value will be read and
R will not be
updated. If, at the same time,
R>T
L
, the transmission
power will not be increased and this can lead to a deadlock.
This situation could be quite possible, especially in mobile
scenarios. Therefore, we adapted their method by letting
Table 3: Quantitative comparison for the energy consumption of
IEEE 802.15.4.
Scenario T1 T2 T4
Fixed (mJ) 154.0 154.8 169.9
Signal strength-based (mJ) 121.6 154.8 169.9
PDR-based (mJ) 79.9 130.2 164.1
a lost packet have an assumed received signal strength of
−95 dBm, the lowest receivable signal strength for CC2420.
Furthermore, the authors do not specify the constant
used when decreasing the transmission power level. In
our implementation, we decrease the power by one level
(corresponding to a decrease between 1 dBm and 3 dBm
depending on the levels) when
R>T
H
.
To compare the two mechanisms, we used scenario
T1, T2, and T4. The same trace data was used, since
we also recorded the received signal strength. The results
are shown in Tab le 3. We can see that the PDR-based
method outperformed both the Fixed method and the
signal strength method. Our PDR-based method always saves
energy compared to the Fixed method, meanwhile, the signal
strength-based method sometimes performs worse. This is
because it only focuses on signal strength and ignores packet
loss and at the same time, packet loss increases so much
that the increased number of retransmissions cancels out
the lower power consumption of using a lower transmission
power level.
The reason why the PDR-based method performs better
is its direct use of the PDR to power level correlation. The
signal strength-based method uses fixed thresholds for all the
scenarios, which may work in some cases, but not in others,
such as T1 and T2. The correlation between received signal
strength and packet loss is simply too weak.
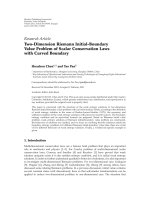
To show the reason behind the good performance of the
PDR-based method, we show in Figure 15 the transmission
power level distribution for both methods in scenario T1
and T2 as examples. Also compare these results with the
PDRs for these levels shown in Figure 3(a) and the energy
consumption shown in Figure 3(e). We can clearly see that
the signal strength method always use the maximum power
level in scenario T2, which is the same as the Fixed method.
The same happens in scenario T4 (not shown). Only in
scenario T1, it shows some “smarter” selection. For the PDR-
based method, we can clearly see that the transmission power
level used for most packets are close to the optimal level 7 (see
Figure 3(e)).
6.3. Trade-Off between Energy Emission and Consumption.
In some cases, a trade-off between minimizing the energy
emission and the energy consumption may be sought. To
allow for this, we introduce a tunable parameter ω as follows.
When comparing (2)with(3)or(4) and given that
a multiplicative scalar does not affect the end result, we
may capture all optimization functions with the following
equation:
P
= P
RF
+ ω,
(7)
14 EURASIP Journal on Wireless Communications and Networking
1
2
3
4
Expected energy emission (mJ)
5
6
0
0.2
0.4
0.6
α
0.8
10
10
β
20
30
40
50
(a) Mobility-10
1
2
3
Expected energy emission (mJ)
4
5
6
0
0.2
0.4
0.6
α
0.8
1
0
10
β
20
30
40
50
(b) Mobility-20
1
2
3
Expected energy emission (mJ)
4
5
6
0
0.2
0.4
0.6
α
0.8
1
0
10
β
20
30
40
50
(c) Mobility-50
1
2
3
Expected energy emission (mJ)
4
5
6
0
0.2
0.4
0.6
α
0.8
10
10
β
20
30
40
50
(d) Mobility-100
Figure 12: α and β combinations for different mobility levels.
0.7
0.75
0.8
Optimal α
0.85
0.9
0.95
1
40 80 120
Batches
160 200
S1
S2
S3
(a) IEEE 802.11
0.4
0.5
0.6
Optimal α
0.7
0.8
0.9
1
40 80 120
Batches
160 200
T1
T2
T3
T4
(b) IEEE 802.15.4
Figure 13: The best α with time for IEEE 802.11 and IEEE 802.15.4.
EURASIP Journal on Wireless Communications and Networking 15
0
200
600
400
800
Expected energy consumption (mJ)
1000
1200
1600
1400
1800
2000
0 0.1 0.2 0.3 0.4 0.5
α
0.6 0.7 0.8 0.9 1
T1
T2
T4
(a) best α
80
100
120
140
Expected energy consumption (mJ)
160
180
200
220
01020
β
30 40 50
T1
T2
T4
(b) best β
Figure 14: The best α and β for IEEE 802.15.4 energy consumption, 20 Bytes.
0
200
600
400
800
Number of packets
1000
1200
1600
1400
1800
2000
05 91317
Transmission power level
21 25 29 31
PDR
Signal strength
(a) T1
0
200
600
400
800
Number of packets
1000
1200
1600
1400
1800
2000
05 91317
Transmission power level
21 25 29 31
PDR
Signal strength
(b) T2
Figure 15: The transmission power levels distribution for the proposed and signal strength-based algorithms in the two scenarios.
where ω ∈ [0, 1400/10] for IEEE 802.11 or ω ∈ [0, 30/35]
for IEEE 802.15.4. If we set ω
= 0, we get (2)andwill
optimize for energy emission. If we set ω
= 1400/10 for
IEEE 802.11 (or ω
= 30/35 for IEEE 802.15.4), we optimize
for energy consumption. However, it is also possible to
set ω to a value in between and that would mean that
we get a trade-off between energy emission and energy
consumption.
To demonstrate how this tuning works, we used the T1
scenario as an example and calculated the expected energy
consumption and emission with different ω values. The
result is plotted in Figure 16.Wecanseehowdifferent ω
values affect the energy emission and energy consumption
for this scenario. By making ω smaller, we reduce the energy
emission, while the energy consumption increases and by
making ω larger, we reduce the energy consumption, while
the energy emission increases. Hence, we can use ω as a
tuning parameter.
We can also use ω to control the expected delay. A larger
ω will penalize a lost packet more and this causes a higher
16 EURASIP Journal on Wireless Communications and Networking
0.1
0.15
0.2
0.25
0.3
Expected energy emission (mJ)
Expected energy consumption (mJ)
00.20.4
ω
0.6 0.8
76
78
80
82
84
86
Emitted energy
Energy consumption
Figure 16: Trade off between minimum energy consumption and
energy emission.
power level to be chosen. The effect is fewer packet losses,
fewer retransmissions, and thereby less delay.
7. Conclusions
Energy emission and consumption reduction are key chal-
lenges for wireless networks. In this paper, we proposed
to select the appropriate transmission power level using
PDR information in order to reduce the energy emission
and/or consumption. We proposed to use the EWMA
method to update the PDR and transmission power level
correlation and use this to adapt the transmission power.
We proposed four initialization phase methods to get a good
transmission power level to start with. Furthermore, we
investigated the optimal parameters for this correlation in
order to achieve minimum energy emission or consumption.
Different impacting factors were also analyzed. We carried
out measurements in two types of test-beds and showed
that a significant amount of energy can be saved for the
transmitter in typical scenarios. We also compared our
mechanism with a signal strength-based mechanism and
showed improved energy savings. Finally, we demonstrated
that our mechanism can be tuned to achieve a balance
between the minimum energy consumption and emission,
which enables the user to adaptively set the desired target.
References
[1] Q. Li, J. Aslam, and D. Rus, “Online power-aware routing in
wireless ad-hoc networks,” in Proceedings of the 7th Annual
International Conference on Mobile Computing and Networking
(Mobicom ’01), pp. 97–107, July 2001.
[2] J M. Choi, Y B. Ko, and J H. Kim, “Enhanced power saving
scheme for IEEE 802.11 DCF based wireless networks,” in
Personal Wireless Communications, vol. 2775 of Lecture Notes
in Computer Science, pp. 835–840, 2003.
[3] V. Shrivastava, D. Agrawal, A. Mishra, S. Banerjee, and T.
Nadeem, “Understanding the limitations of transmit power
control for indoor WLANs,” in Proceedings of the 7th ACM
SIGCOMM Internet Measurement Conference (IMC ’07),pp.
351–364, October 2007.
[4] D. Lal, A. Manjeshwar, F. Herrmann, E. Uysal-Biyikoglu,
and A. Keshavarzian, “Measurement and characterization of
link quality metrics in energy constrained wireless sensor
networks,” in Proceedings of IEEE Global Telecommunications
Conference (GLOBECOM ’03), vol. 1, pp. 446–452, San
Francisco, Calif, USA, December 2003.
[5] J. Kim and J. Huh, “Link adaptation strategy on transmission
rate and power control in IEEE 802.11 WLANs,” in Proceedings
of the 64th IEEE Vehicular Technology Conference (VTC ’06),
pp. 2053–2057, September 2006.
[6] R. Wattenhofer, L. Li, P. Bahl, and Y. Wang, “Distributed
topology control for power efficient operation in multihop
wireless ad hoc networks,” in Proceedings of the 20th Annual
Joint Conference of the IEEE Computer and Communications
Societies (INFOCOM ’01), vol. 3, pp. 1388–1397, Anchorage,
Alaska, USA, 2001.
[7] S. Lin, J. Zhang, G. Zhou, L. Gu, J. A. Stankovic, and T.
He, “ATPC: adaptive transmission power control for wireless
sensor networks,” in Proceedings of the 4th International
Conference on Embedded Networked Sensor Systems (SenSys
’06), pp. 223–236, Boulder, Colo, USA, 2006.
[8] G. Hackmann, O. Chipara, and C. Lu, “Robust topology
control for indoor wireless sensor networks,” in Proceedings of
the 6th ACM Conference on Embedded Network Sensor Systems
(SenSys ’08), Raleigh, NC, USA, 2008.
[9] L.H.A.Correia,D.F.Macedo,D.A.C.Silva,A.L.DosSantos,
A. A. F. Loureiro, and J. M. S. Nogueira, “Transmission power
control in MAC protocols for wireless sensor networks,” in
Proceedings of the 8th ACM Symposium on Modeling, Analysis
and Simulation of Wireless and Mobile Systems, pp. 282–289,
Montreal, Canada, October 2005.
[10] D. Son, B. Krishnamachari, and J. Heidemann, “Experimental
study of the effects of transmission power control and
blacklisting in wireless sensor networks,” in Proceedings of the
1st Annual IEEE Communications Society Conference on Se nsor
and Ad Hoc Communications and Networks (SECON ’04),pp.
289–298, 2004.
[11] J. P. Monks, V. Bharghavan, and W. W. Hwu, “A power con-
trolled multiple access protocol for wireless packet networks,”
in Proceedings of the 20th Annual Joint Conference on the IEEE
Computer and Communications Societies (INFOCOM ’01), vol.
1, pp. 219–228, Anchorage, Alaska, USA, 2001.
[12] E S.JungandN.H.Vaidya,“ApowercontrolMACprotocol
for ad hoc networks,” Wireless Networks,vol.11,no.1-2,pp.
55–66, 2005.
[13] S. Agarwal, R. H. Katz, S. V. Krishnamurthy, and S. K. Dao,
“Distributed power control in ad-hoc wireless networks,” in
Proceedings of the 12th International Symposium on Personal,
Indoor and Mobile Radio Communications (PIMRC ’01),pp.
F59–F66, San Diego, Calif, USA, October 2001.
[14] M. Kubisch, H. Karl, A. Wolisz, L. Zhong, and J. Rabaey,
“Distributed algorithms for transmission power control in
wireless sensor networks,” in Proceedings of IEEE Wireless
Communications and Networking (WCNC ’03), vol. 1, New
Orleans, La, USA, 2003.
[15] S. Xiao, A. Dhamdhere, V. Sivaraman, and A. Burdett,
“Transmission power control in body area sensor networks
for healthcare monitoring,” IEEE Journal on Selected Areas in
EURASIP Journal on Wireless Communications and Networking 17
Communications, vol. 27, no. 1, Article ID 4740884, pp. 37–
48, 2009.
[16] Chipcon, “CC2240: 2.4GHz IEEE 802.15.4 / ZigBee-ready RF
Tr an sc eiv er,” .
[17] P. Liaskovitis and C. Schurgers, “Energy consumption of
multi-hop wireless networks under throughput constraints
and range scaling,” ACM SIGMOBILE Mobile Computing and
Communications Review, vol. 13, pp. 1–13, 2009.
[18] C. Williamson, “Internet traffic measurement,” IEEE Internet
Computing, vol. 5, no. 6, pp. 70–74, 2001.