Báo cáo sinh học: " Research Article A New-Fangled FES-k -Means Clustering Algorithm for Disease Discovery and Visual Analytics" pdf
Bạn đang xem bản rút gọn của tài liệu. Xem và tải ngay bản đầy đủ của tài liệu tại đây (9.15 MB, 15 trang )
Hindawi Publishing Corporation
EURASIP Journal on Bioinformatics and Systems Biology
Volume 2010, Article ID 746021, 14 pages
doi:10.1155/2010/746021
Research Article
A New-Fangled
FES-k
-Means Clustering Algorithm for
Disease Discovery and Visual Analytics
Tonny J. Oyana
GIS Research Laboratory for Geographic Medicine, Advanced Geospatial Analysis Laboratory, Department of Geography &
Environmental Resources, Southern Illinois University, 1000 Faner Drive, MC 4514,
Carbondale, IL 62901-4514, USA
Correspondence should be addressed to Tonny J. Oyana,
Received 22 November 2009; Revised 27 April 2010; Accepted 7 May 2010
Academic Editor: Haiyan Hu
Copyright © 2010 Tonny J. Oyana. This is an open access article distributed under the Creative Commons Attribution License,
which permits unrestricted use, distribution, and reproduction in any medium, provided the original work is properly cited.
The central purpose of this study is to further evaluate the quality of the performance of a new algorithm. The study provides
additional evidence on this algorithm that was designed to increase the overall efficiency of the original k-means clustering
technique—the Fast, Efficient, and Scalable k-means algorithm (FES-k -means). The FES-k-means algorithm uses a hybrid
approach that comprises the k-d tree data structure that enhances the nearest neighbor query, the original k-means algorithm,
and an adaptation rate proposed by Mashor. This algorithm was tested using two real datasets and one synthetic dataset. It was
employed twice on all three datasets: once on data trained by the innovative MIL-SOM method and then on the actual untrained
data in order to evaluate its competence. This two-step approach of data training prior to clustering provides a solid foundation
for knowledge discovery and data mining, otherwise unclaimed by clustering methods alone. The benefits of this method are that
it produces clusters similar to the original k-means method at a much faster rate as shown by runtime comparison data; and it
provides efficient analysis of large geospatial data with implications for disease mechanism discovery. From a disease mechanism
discovery perspective, it is hypothesized that the linear-like pattern of elevated blood lead levels discovered in the city of Chicago
may be spatially linked to the city’s water service lines.
1. Introduction
Clustering delineates operation for objects within a dataset
having similar qualities into homogeneous groups [1]. It
allows for the discovery of similarities and differences among
patterns in order to derive useful conclusions about them [2].
Determining the structure or patterns within data is a signif-
icant component in classifying and visualizing, which allows
for geospatial mining of high-volume datasets. While there
are many clustering techniques that have been developed
over the years (many of which have been improvements and
others have been revisions), the most common and flexible
clustering technique is the k-means clustering technique
[3]. The primary function of the k-means algorithm is to
partition data into k disjoint subgroups, and then the quality
of these clusters is measured via different validation methods.
The original k-means method, however, is reputable for
being feeble in three major areas: (1) computationally
expensive for large-scale datasets; (2) cluster initialization a
priori; and (3) local minima search problem [4, 5].
The first report to resolve these concerns about the k-
means clustering technique was published as a book chapter
[6]. In this paper, we have analyzed three distinct datasets and
also make additional improvements in the implementation
of the algorithm. Postprocessing work on discovered clusters
involved a detailed component of fieldwork for one of
the experimental datasets revealing key implications for
disease mechanism discovery. This paper is inspired by
an increasing demand for better visual exploration and
data mining tools that function efficiently in data-rich and
computationally rich environments. Clustering techniques
have played a significant role to advance knowledge derived
from such environments. Besides, they have been applied to
several different areas of study, including, but not limited
to, gene expression data [7, 8], georeferencing of biomedical
data to support disease informatics research [9, 10]in
2 EURASIP Journal on Bioinformatics and Systems Biology
terms of exploratory data analysis, spatial data mining, and
knowledge discovery [11–13].
2. Algorithm Description
2.1. The k-Means Clustering Method. Several algorithms are
normally used to determine natural homogeneous groupings
within a dataset. Of all the different forms of clustering,
the improvements suggested in this study are for the
unsupervised, partitioned learning algorithm of the k-means
clustering method [3]. MacQueen [3] describes k-means as a
process for partitioning an N-dimensional population into
k sets on the basis of a sample. Research shows that, to
date, k-means is the most widely used and simplest form
of clustering [14–16]. The k-means algorithm is formally
defined, for this study, as follows.
(1) Let k be the number of clusters and the input vectors
defined as X
= [b
1
, b
2
, ,b
n
].
(2) Initialize the centers to k random locations in the
data and calculate the mean center of each cluster, μ
i
(where i is the ith cluster center).
(3) Calculate the distance from the center of each cluster
to each input vector, assign each input vector to
the cluster where the distance between itself and μ
i
is minimal, recompute μ
i
for all clusters that have
inherited a new input vector, and update each cluster
center (if there are no changes within the cluster
centers, discontinue recomputation).
(4) Repeat step (3) until all the data points are assigned
to their optimal cluster centers. This ends the cluster
updating procedure with k disjoint subsets.
The partitions are based on a within-class variance, which
measures the dissimilarity between input vectors X
=
[b
1
, b
2
, ,b
n
], and cluster representatives μ
i
using the
squared Euclidean distance:
k
i=1
N
n=1
x
n
−μ
i
2
,(1)
where N and k are the number of data and the number of
cluster centers, respectively, x
n
is the data sample belonging
to center μ
i
[3, 7, 17–19].
The center of the kth cluster is chosen randomly and
according to the number of clusters in the data [8], where
k can be used to manipulate the shape as well as the
number of clusters. According to Vesanto and Alhoniemi
[19], the k-means algorithm prefers spherical clustering,
which assigns data to shapes whether clusters exist in the
data or not, making it necessary to validate the results of
the clusters. This can cause a problem because if a cluster
center lies outside of the data distribution, the cluster could
possibly be left empty, reflecting a dead center, as identified
by Mashor [18]. Another weakness of the algorithm is its
inability to deal with clusters having significantly different
sizes [2].
2.2. Davies-Bouldin Validity Index (DBI). The Davies-
Bouldin Index (DBI) is used to evaluate clustering quality
of the k-means partitioning methods because DBI is ideal
for indexing spherical clusters. Hence, the ideal DBI for
optimal clustering strives to minimize the ratio of the
average dispersions of two clusters, namely C
i
and C
j
, to the
Euclidean distance between the two clusters, according to the
following formula [7, 20],
1
k
k
i=1
max
i
/
= j
e
i
+ e
j
D
ij
,(2)
where k is the number of clusters, e
i
and e
j
are the average
dispersion of C
i
and C
j
,respectively.D
ij
is the Euclidean
distance between C
i
and C
j
. The average dispersion of each
cluster and the Euclidean distance are calculated according to
formulas (2)and(3), respectively [7],
e
i
=
1
N
i
x −μ
i
2
,
(3)
D
ij
=
μ
i
−μ
j
2
,
(4)
where μ
i
is the center of cluster C
i
consisting of N
i
points and
x is the input vector.
Although research tells us that one advantage of the
k-means algorithm is that it is computationally simplistic
[2], the direct application of the algorithm to large datasets
can be computationally very expensive because this method
requires time proportional to the product of number of
data points and the number of clusters per iteration [17,
19]. Vesanto and Alhoniemi [19] also suggested that DBI
prefers compact scattered data. Unfortunately, not all data
are compact and scattered; hence, an improved algorithm
is required to evaluate very large data sets. This declaration
comes 30 years after that of MacQueen [3] who proclaimed
that the k-means procedure is easily programmed and is
computationally economical.
2.3. The k-d Tree Data Structure. According to Bentley [21]
and Gaede and G
¨
unther [22], the k-d tree is one of the most
prominent d-dimensional data structures. The structure of
the k-d tree is a multidimensional binary search mechanism
that represents a recursive subdivision of the data space into
disjoint subspaces by means of d-1-dimensional hyperplanes
[14, 22, 23]. Note that the root of such a tree represents all
the patterns, while the children of the root represent subsets
of the patterns completely contained in subspaces. The nodes
at the lower levels represent smaller subspaces.
The two main properties of the k-d tree are that each
splitting hyperplane has to contain at least one data point and
that nonterminal nodes must have one or two descendants.
Thesepropertiesmakethek-d tree data structure an attrac-
tive candidate for reducing the computationally expensive
nature of k-means algorithm and providing a very good
preliminary clustering of a dataset [4, 14, 15, 17]. Several of
these studies have investigated the use and efficiency of the k-
d tree in a k-means environment, and they have concluded
that presenting clustered data using this data structure
EURASIP Journal on Bioinformatics and Systems Biology 3
provides enormous computational advantages. Alsabti et al.’s
[17] main principle was based on organizing vector patterns
so that all closest patterns to a given prototype can be found
efficiently. The method consists of initial prototypes that are
randomly generated or drawn randomly from the dataset.
There are two main strategies to realize Alsabti’s principle:
(1) consider that all the prototypes were potential candidates
for the closest prototype at the root level; (2) obtain good
pruning methods based on simple geometrical constraints.
Alsabti et al. [17] pruning method was based on
computing the minimum and maximum distances to each
cell. For each candidate μ
i
, they obtained the minimum
and maximum distances to any point in the subspace; then
they found the minimum of maximum distances (MinMax);
and later they pruned out all candidates with minimum
distance greater than MinMax. For their pruning technique,
Pelleg and Moore [23] used the bisecting hyperplane that
assigns the input vector based on the minimal distance to the
winning cell. Kanungo et al. [15] used the same approach,
but they assigned the input vector to a cell based on minimal
distance to the midpoint of the winning cell candidate. In
this study, we have adopted the pruning method of Kanungo
et al. [15] due to its presumed greater efficiency than that of
Alsabti et al. [17]andPellegandMoore[23].
2.4. Mashor’s Updating Method. A method intended to
resolve the k-means problem has been described by Mashor
[18], who suggested a multilevel approach. According to
Vesanto and Alhoniemi [19], the primary benefit of a
multilevel approach is the reduction of the computational
cost. Recall that most clustering algorithms employ a sim-
ilarity measure with a traditional Euclidean distance that
calculates the cluster center by finding the minimum distance
calculated using
k
i=1
N
n=1
x
n
−μ
i
2
,(5)
where k is the number of cluster centers, N is the total
number of data points, x
n
is the nth data point, and μ
i
is the
ith cluster center. In k-means clustering as the data sample is
presented, the Euclidean distances between the data sample
and all the centers are calculated, and the nearest center is
updated according to
Δμ
i
(
t
)
= η
(
t
)
x
(
t
)
−μ
i
(
t
−1
)
,(6)
where i indicates the nearest center to the data sample x(t).
The centers and the data are written in terms of time (t),
where μ
i
(t − 1) represents the cluster center during the
preceding clustering step, and η(t)is the adaptation rate.
The adaptation rate, η(t), can be selected in a number of
ways. Conventional formulas for η(t)are a variable adaptive
method introduced by MacQueen [3] and a constant adap-
tation rate and a square root method introduced by Darken
and Moody [24]. These methods adjust the cluster centers
at every instant by taking the cluster center at the previous
step into consideration. Some of the problems associated
with such adjustments are reviewed in Mashor [18], who
suggests a better clustering performance based on a more
suitable adaptation rate η(t). According to Mashor [18], a
good updating method is one that has a large clustering
rate at the beginning and a small steady state value of the
adaptation rate, η(t), at the end of training time.
Mashor [18] investigated five methods—three conven-
tional updating methods and two proposed. For this study,
we adopted one of two proposed methods introduced by
Mashor [18] into the Fast, Efficient, and Scalable k-means
algorithm (FES-k-means algorithm). By intervening with
the updating method, it is possible to facilitate the optimal
cluster centers in gaining a good cluster performance.
2.5. FES-k-Means Algorithm. The purpose of this study is to
address the problem that the k-means algorithm encounters
while dealing with data-rich and computationally rich
environments. Proposed modifications to produce the new
algorithm, FES-k-means, begin by initializing the k-d tree
data structure (based on a binary search tree that represents
recursive subdivision) and using an efficient search mecha-
nism based on the nearest neighbor query. This is expected
to handle large geospatial data, reduce the computationally
expensive nature of the k-means algorithm, and perform fast
searches and retrieval. The next modification is to implement
amoreefficient updating method using Mashor’s adaptation
rate. The purpose of this step is to intervene at the updating
stage of the k -means algorithm, because it suitably adjusts
itself at each learning step in order to find the winning
cluster for each data point efficiently, and it takes time
into consideration and analyzes the cluster centers during
the previous clustering steps while generating new cluster
centers.
The three specific issues that will be addressed by
implementing the proposed improvements of the k-means
algorithm are as follows.
(1) From ongoing experimentation of using the k-means
algorithm, it has been observed that the number of
clusters fluctuate between 2+ and 2
−.Itisbelieved
that Mashor’s method stabilizes the number of
clusters and converges faster.
(2) Vesanto and Alhoniemi [19] stated that DBI favors
small number of clusters. Hence, the DBI will not
serve a population of data with a very large number
of clusters. It is assumed that the k-d tree in
combination with Mashor’s method will eliminate
this problem also.
(3) Knowing that data clusters range in size and density,
it is safe to say that Vesanto and Alhoniemi’s [19]
suggestion that because DBI prefers compact scat-
tered data, it does not efficiently service all datasets.
For instance, the spatial patterns or multidimensional
nature of georeferenced data may not completely
fit into the compact scattered data description. By
intervening at the updating level, we expect Mashor’s
method to service the general population of datasets
by eliminating this problem.
4 EURASIP Journal on Bioinformatics and Systems Biology
The basic structure of FES-k-means Algorithm
(1) Determine the number and the dimensionality of points and set the number of clusters
in the training set
(2) Extract the data points
(3) Construct a k-d-treeforthedatapointsinreference
(4) Initialize centers randomly
(5) Find closest points to the centers using nearest neighbor search
(6) Find [center] as an array of centers of each cluster by centroid method
(7) Choose an adaptation rate (eta) for k-means with Mashor
(8) while (max iterations reached)
for each vector
for each cluster
Calculate the distance of vector to center of cluster
Find the nearest cluster
end
Calculate eta
= eta/exp(1/sqrt(cluster count + iter))
change
in center = eta(difference between vector and cluster center)
Calculate new center
= center + change in center
end
if (change
in center) < epsilon
break
end
// Compute MSE until it does not change significantly
// Update centers until cluster membership no longer changes
end
Algorithm 1: An improved pseudo code for the FES-k-means algorithm.
In k-means clustering an adaptive method is employed
where the cluster centers are calculated and updated using
(6). The plan of this study is to integrate Mashor’s updating
procedure, η(t), in (7) into (6) to derive the most appropriate
cluster centers,
η
(
t
)
=
η
(
t −1
)
e
[1/r]
,(7)
where r
= k + t. At each step of the learning, the adaptation
rate should be decreased so that the weights of the training
data can converge properly.
Formula (6) is rewritten by substituting η(t)from
formula (7) to obtain the final formula (8) as follows:
Δμ
j
(
t
)
=
η
(
t −1
)
e
[1/r]
x
(
t
)
−μ
i
(
t
−1
)
. (8)
It is hypothesized that the application of this updating
procedure in (8) to the existing cost equation of the k-means
will help generate clear and consistent clusters in the data.
It is also assumed that the improved k-means algorithm
if used in conjunction with the MIL-SOM algorithm [25]
will provide a better result than the original k-means
algorithm, which delineates cluster boundaries based on the
best DBI validation. The MIL-SOM algorithm is essentially
an improved version of the Self-Organizing Map (SOM), an
unsupervised neural network that is used to visualize high-
dimensional data by projecting it onto lower dimensions
by selecting neurons or functional centroids to represent a
group of valuable data [26].
Algorithm 1 gives the pseudo code of the FES-k -
means algorithm. The pseudo code for this hybrid approach
primarily comprises the k-d tree data structure that enhances
the nearest neighbor query, the original k-means algorithm,
and an adaptation rate proposed by Mashor.
3. Materials and Methods
3.1. Experimental Desig n. In this paper, we evaluated the
characteristics and assessed the quality and efficiency of the
FES-k-means clustering method. We invoked three distinct
datasets to realize this goal. Two published real datasets and
one published synthetic dataset were used for performance
evaluation of the method. The data distribution is illustrated
in Figure 1. The real datasets were (1) georeferenced
physician-diagnosed adult asthma data for Buffalo, New
York (Figure 1(a)); and (2) georeferenced elevated blood
lead levels (BLLs) linked with the age of housing units in
Chicago, Illinois (Figure 1(b)). Each of these datasets, that
is the raw data in its entirety (untrained) and the reduced
MIL-SOM trained version in conjunction with FES-k-means
algorithm, was explored. The third, shown in Figure 1(c),isa
computer-generated synthetic dataset with a predetermined
number of clusters. Post processing work involved a detailed
fieldwork on the BLL outliers generated after classification.
Photographs were taken and collected evidence led to the
development of superior study hypothesis.
3.2. Adult Asthma in Buffalo, New York. This dataset has vari-
ables depicting residential locations of adults with asthma
EURASIP Journal on Bioinformatics and Systems Biology 5
473
474
475
476
477
478
×10
4
665 670 675 680 685 690 695
×10
3
y-coordinate (utm, meters)
x-coordinate (utm, meters)
(a)
41.6
41.7
41.8
41.9
42
42.1
−88 −87.9 −87.8 −87.7 −87.6 −87.5
y-coordinate (decimal degrees, miles)
x-coordinate (decimal degrees, miles)
(b)
−20
0
20
40
60
80
−50 0 50 100 150
y-axis
x-axis
(c)
Figure 1: The spatial distribution of the actual, untrained datasets: (a) adult asthma; (b) elevated blood lead levels linked with age of housing
units; and (c) synthetic data.
in relation to pollution sites in Buffalo, New York, which
were collected at individual level. The untrained set for these
data comprises 4,910 records and the trained set contains
252 records. Both sets have 5 characterizing components:
namely, geographic location based on x-andy-coordinates,
case control code, distance to major road, distance to known
pollution source, and distance to field-measured particulate
matter. The last three variables were tracked using binary
digits (0 and 1), where 1 indicates whether the given location
is within 1,000 meters of the noted risk element and 0
otherwise.
3.3. Elevated BLL Linked with Age of Housing Units, Chicago
Illinois. This dataset contained the age of housing units
linked with the prevalence of children having elevated BLL
in Chicago, Illinois. According to the US Centers for Disease
Control and Prevention (CDC), elevated BLL has been
formalized as all test results
≥10 μg/dL (micrograms per
deciliter). The untrained and trained datasets comprise 2,605
records and 260 records, respectively. These data are at
census block group level. Both, the trained and untrained
sets have the following 16 dimensions: (dimension 1) child
population; (dimensions 2–10) homes built per decade,
spanning pre-1935 to 1999; (dimension 11) median year of
homes built; (dimension 12) elevated BLL prevalence in year
1997; (dimension 13) elevated BLL prevalence in year 2000;
(dimension 14) elevated BLL prevalence in year 2003; and
finally, (dimensions 15 and 16) geographic location based on
x-andy-coordinates.
3.4. Synthetic Dataset. The published synthetic dataset (in
2-dimensional feature space, n
= 36,000 data points with
more than 10 clusters, all connected at the edges) was
randomly generated. The untrained and trained dataset
comprised 36,000 and 258 records, respectively. A pair of x-,
y- coordinates was used to quantify its clusters.
6 EURASIP Journal on Bioinformatics and Systems Biology
3.5. Data Analysis. To achieve the goals of this research, we
ran several tests employing the new FES-k-means clustering
method. Our testing procedure comprised 3 major steps:
(1) data preprocessing, (2) experimentation, and (3) data
post processing. These experiments were conducted within
improved MIL-SOM and FES-k -means environments using
Matlab 7.0 (The MathWorks, Inc., Natick, Massachusetts).
We decided on these computational environments to per-
form the algorithms because the MIL-SOM algorithm and
Matlab provide the necessary environments to compute
complex equations. Exploratory analyses were conducted
using Statistical Programs, and spatial analysis was con-
ducted using ESRI ArcGIS 9.2 (ESRI, Inc., Redlands, Cali-
fornia).
3.6. Data Pre-Processing. This pre-processing consisted of
selecting viable datasets that would be used for testing
and validation. We chose published datasets because their
characteristics are well established and adequately known,
but this algorithm (FES-k-means) was initially tested using
up to 1 million records generated randomly by the computer.
The next step involved preparing the experimental datasets
for modeling. After pre-processing the three datasets, they
were imported into the work space environment for exper-
imentation.
3.7. Experimentation. During experimentation, we assessed
the performance of the FES-k-means algorithm by per-
forming three tasks: (1) evaluate speed efficiency using
runtime; (2) evaluate mean square error for processed data;
and (3) train the data. We compared the FES-k-means
method with the standard k-means and with MacQueens k-
means methods. MacQueen’s k-means method, as referenced
herein, is one that uses predefined parameters [18].
Using runtime, in seconds, speed efficiency was measured
against percentage of data processed for each of the three
aforementioned clustering methods. The percentage of data
processed was based on percentages that ranged from 10 to
100 and increased in 10 percent increments (10%, 20%, 30%,
etc.)
To test clustering quality of the FES-k-means method,
we graphically compared the mean square error (MSE)
measured in decibels (dB) of each dataset with the percentage
of data processed using the three methods.
Prior to cluster delineation of each dataset using the
FES-k-means method, the data were separately trained using
MIL-SOM. MIL-SOM training was used to initialize k—
the number of clusters. SOM, in a geographical context,
is used to reduce multivariate spatially referenced data to
discover homogeneous regions and to detect spatial patterns
[27]. In SOM, a winning neuron is randomly selected to
represent a subset of data, while preserving the topological
relationships [26]. The algorithm continues until all data are
assigned to a neuron. Assignments are based on similarity
characteristics using distance as a determinant; hence, similar
data are grouped together and dissimilar clusters are assigned
to separate clusters. The resulting clusters may be visualized
using a multitude of techniques such as the U-matrix,
histograms, and scatter plots, among others available within
the SOM toolbox. For the purposes of our testing, we
employed the U-matrix, which shows distances between
neighboring units and displays cluster structure of the data.
Clusters are typically uniform areas of low values; high values
allude to large distances between neighboring map units and
thus indicate cluster borders.
For the trained version of each dataset, we initialized the
number of centers, k, to 10; which proved to be insignificant
in determining the number of major clusters. On the other
hand, the initialized centers for the untrained data were
varied; the BLL housing data had 6 centers; the adult asthma
data was initialized to 8 clusters; and the synthetic dataset
was initialized to 10 clusters. For each cluster center, 20
iterations were run. The number of clusters was estimated via
visual interpretation of the U-matrix during the MIL-SOM
training.
3.8. Data Post Processing. For post processing and validation,
we complemented our FES-k-means with the traditional k-
means algorithm in the SPSS and found that our method is
comparable. Next, we wished to analyze cluster distribution,
thus a box plot was undertaken. In a box plot, each record is
plotted within a series of box plots corresponding to relative
cluster groupings. We refer to these clusters as major “best as
shown in the plots”. Each case is graphed, within its cluster,
based on distance from its classification cluster center. Visual
probing and spatial analysis using box plots revealed hidden
outliers, which prompted further investigation into the data.
Next, we mapped the clusters and outliers using GIS
to visualize, compare, and evaluate the cluster patterns and
point distributions for the MIL-SOM trained sets and the
full versions for each dataset. To further explore clusters
and outliers, we did fieldwork and communal/housing
investigations in Chicago, Illinois. Photos taken during this
fieldwork are provided to support findings in relation to the
link between BLL and potential risk factors.
4. Results
Each dataset was evaluated using the FES-k-means algorithm
to establish its key properties. Major benefits established
during the implementation and experimentation were (1) it
produces similar clusters as the original k-means method at
a much faster rate; and (2) it allows efficientanalysisoflarge
geospatial data. The results identifying some of these main
properties are presented in Figures 2 through 4. The first
sets of illustrations (Figures 2 and 3) show the runtime and
MSE results. The last illustration in Figure 4 shows delineated
clusters of untrained and trained data. A key health outcome
finding was deduced from the results of a postanalysis by
the means of descriptive statistics, box plots, cluster quality
re-evaluation using Davies-Bouldin validity index, and GIS
analysis and fieldwork photos (Figures 5 and 6).
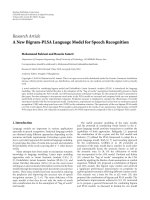
4.1. Runtime. Figure 2(a) plots the runtime of the adult
asthma dataset. The plot reveals that all three methods have
EURASIP Journal on Bioinformatics and Systems Biology 7
a consistent, upward trend. For the standard k-means and
MacQueen’s methods, at 10 percent of the data processed,
the runtime was 0.2 second, and at 100 percent, the runtime
was just above 1 second. The runtime for the FES-k-means
method was below 0.2 second for 10 percent of the data, but
it remained at approximately 0.2 second for processing the
remaining 90 percent of the data—a difference of at least 0.8
second from the other methods.
The runtime for the elevated BLL dataset is displayed
in Figure 2(b). The standard k-means, according to this
plot, has the slowest runtime for the entire data processing;
differing by no more than 0.8 second from MacQueen’s
method. Initially, the FES-k-means, at 10 percent of data
processed, is analogous to that of the other methods.
However, as the percentage of processed data increases, the
runtime for the FES-k-means becomes increasingly faster,
terminating at less than 0.25 second for 100 percent of
the data. The end times for the standard k-means and the
MacQueen’s methods were approximately 0.6 second and 0.5
second, respectively.
Figure 2(c) displays the runtime for the synthetic dataset.
It is apparent that there is similarity in behaviors for all three
methods, beginning at less than 1 second for 10 percent of
data processed. As percentage of data increases, the runtime
increases as well. The runtime for the standard k-means and
MacQueen’s methods increased greatly, while the time for
FES-k-means increased only slightly. At 50 percent, for both
the standard k-means and MacQueen’s methods, the times
were greater than 5 seconds, while it was less than 3 seconds
for the FES-k-means; and the end runtimes, at 100 percent
of data, were the same for the standard and MacQueen’s at
approximately 18 seconds, and approximately 6 seconds for
the FES-k-means at the shortest time.
4.2. Mean Square Error. Figure 3 displays curves of the
cluster performance of the standard k-means, the MacQueen
method, and FES-k-means using MSE versus percentage
of data processed. The Figure 3(a) curve reveals that all
three methods have a consistent, increasing trend. The mean
square error at the start of processing, 10 percent of data,
is comparable for all methods at approximately 14 dB, and
maximize, at 100 percent of data, slightly greater than 16 dB
for each of the three methods.
Figure 3(b) illustrates the elevated BLL block housing
data. The characteristics of the standard k-means and
MacQueen’s methods, according to this plot, are very similar.
Starting at an MSE of 11 dB for the standard k-means,
the MacQueen method, and the FES-k-means method and
ending at an MSE of approximately 13 dB, the results indicate
that the cluster performances are significantly close.
In Figure 3(c), synthetic dataset, the cluster performance
is comparable for all three methods: standard k-means,
MacQueen, and FES-k-means. The MSE at 10 percent of
the data is 10, and it increases incrementally for each step
of processing. At 100 percent of the data, the individual
methods maximizes at an MSE slightly higher than 12 dB.
The figure illustrates a continual increase in MSE with
respect to percentage of data.
4.3. FES-k-Means Clusters of M IL-SOM Trained versus
Untrained Data. Both the MIL-SOM trained and untrained
adult asthma datasets show similar geographic characteristics
when the FES-k-means method is applied (Figures 4(a) and
4(b)). For the trained data, the spatial distribution for each of
the clusters is more scattered than is the spatial distribution
for the clusters of the actual data. Using less data points for
the trained data may have caused this widespread spatial
distribution of points in order to fully represent the data
clusters of the actual data. The point pattern within this
cluster is compact in the farthest south western portion of
the cluster and is highly dense and compact. Also, as the
cluster migrates northeast, it becomes more scattered and less
compact and less dense.
Figures
4(c) and 4(d) illustrate the clustering results
of untrained and MIL-SOM trained elevated BLL data. In
comparison with the MIL-SOM trained data, we found that
both the trained and untrained datasets returned comparable
major clusters. The clusters for the MIL-SOM trained data
capture clusters on the near west side and south side of
Chicago; the untrained data reveal clusters in this same
geographic area; in addition, a reference area was identified
in the far north side. We also observe that the data points
of the untrained data have a spatial distribution throughout
the entire Chicago region (Figure 4(c)). This could be due
in part to variations of noise presence within the data, not
to mention that the untrained data are massively larger than
the trained data by an approximate multiple of 10. Also,
clusters 2 and 3 contain most of the outliers, which were
explored further in a separate analysis and field study leading
to the development of a study hypothesis. Overall, the FES-
k-means clustering employed on MIL-SOM trained data and
untrained data displays similar clustering characteristics for
elevated levels of BLL with regards to the age of housing units
for the city of Chicago.
Since we observed that the untrained elevated BLL linked
with the age of housing dataset had two clusters with several
outliers (Figure 4), we became curious about them. When
these outliers were mapped, we found that most of them are
primarily around the city perimeter and are within a distance
of 1.50 miles from Lake Michigan. Prevalence rates within
a 2-mile buffer radius of these outliers were analyzed using
proximity and statistical analysis. The buffered areas only
had the highest prevalence rate for all the three years under
consideration, but also had the oldest housing units. Cluster
outliers were further evaluated through a detailed fieldwork.
Photographs taken as result of the fieldwork are provided
in Figure 5. The photos were taken in November 2006 in
different geographic areas within the identified clusters in
the city of Chicago. Also, selected photos of housing units
located in areas that reportedly had outliers are also included.
For examples, outlier 2489 (sample photos were taken to
show these outliers) is from Roosevelt Road to Laflin Street
(Figure 5(a)) in the Chicago Housing Authority, it is also less
than 1.5 miles along Lake Shore Drive. The housing units in
this area are in the process of being demolished. Most units
are vacant, though some residents still live there. Outlier
1398 is along 4000 South King Drive (Figure 5(e)). It is a
lower middle class neighborhood and runs along Lake Shore
8 EURASIP Journal on Bioinformatics and Systems Biology
0
0.2
0.4
0.6
0.8
1
1.2
10 20 30 40 50 60 70 80 90 100
Data (%)
Time (sec)
(a)
0
0.1
0.2
0.3
0.4
0.5
0.6
0.7
10 20 30 40 50 60 70 80 90 100
Data (%)
Time (sec)
(b)
0
2
4
6
8
10
12
14
16
18
20
10 20 30 40 50 60 70 80 90 100
Data (%)
Time (sec)
k-means
MacQueen
FES-k-means
(c)
Figure 2: A comparison of three k-means algorithms using runtime versus percent of data processed: (a) adult asthma; (b) elevated blood
lead levels linked with age of housing units; (c) synthetic data.
Drive. Outlier 2492 is from Pulaski Road to Lawrence Avenue
(Figure 5(f)) and is an upper class neighborhood.
Three major clusters were identified in Figure 6: clusters
2 and 6 have elevated BLL, while Cluster 5 has the lowest
BLL (this can be used as a reference in epidemiological
investigations). Cluster 6, shown by two sample photos; is
from 107th Street and Commercial Avenue (Figures 5(b) and
5(c)) to 105th Street and Yates Boulevard (Figure 5(d)); it
includes the Industrial Belt and Cargill Industrial Plant and
is near the Altgeld Gardens Housing Projects. Also, located
in the same cluster is the Chicago Housing Authority where
some of the units are being renovated.
A significant number of outliers were observed in
the southeast side, far north region of Chicago along its
borderline and north suburb. We hypothesize that this linear-
like pattern of elevated BLL may be spatially linked to the city’s
water service lines. This hypothesis begs this question: in the
Chicago region, could lead pipes be a primary transportation
medium for lead-contaminated water supply in schools, homes,
and so forth? In reviewing the history of the city with regards
to the water service lines and despite the fact that the ban on
lead service mains was effected in 1988—critical information
contained in 1993 Consumer Reports and also in Wald, M.L.,
May 12, 1993, The New York Times—we discovered that
Chicago had lead levels which had more than 15 parts per
billion in the 17 percent of the first draw samples.
Regarding pediatric lead exposure, the overall prevalence
rates for 1997, 2000, and 2003 continuously declined as the
EURASIP Journal on Bioinformatics and Systems Biology 9
12.5
13
13.5
14
14.5
15
15.5
16
16.5
10 20 30 40 50 60 70 80 90 100
%ofdata
MSE (dB)
(a)
0
2
4
6
8
10
12
14
16
10 20 30 40 50 60 70 80 90 100
%ofdata
MSE (dB)
(b)
0
2
4
6
8
10
12
14
10 20 30 40 50 60 70 80 90 100
%ofdata
MSE (dB)
k-means
MacQueen
FES-k-means
(c)
Figure 3: A comparison of three k-means algorithms using MSE versus percent of data processed: (a) adult asthma; (b) elevated blood lead
levels linked with age of housing units; (c) synthetic data.
years passed. We also found that the prevalence rates were
higher in areas with older housing units. Lastly, we observed
higher prevalence rates in areas with high minority presence
and lower prevalence rates in areas with low minority
presence. The reference area identified in previous studies,
the northernmost region, is analogous to the findings in this
study. The FES-k-means was efficient in discovering a cluster
within a cluster, which was otherwise unnoticed in previous
studies. Findings from this study therefore prompt investigation
of soil samples to investigate whether there is an association
between potential water contamination in water service lines
and elevated BLL presence. Another study would be to sample
school children from all Chicago neighborhoods to investigate
any effects lead poisoning may have on their learning abilities
despite children’s socioeconomic status.
4.4. FES-k-Means Clusters of Synthetic Dataset. Figures 4(e)
and 4(f) give the plot of the delineated synthetic dataset. We
identified 10 clusters. The clusters closest to the origin are
more concentrated than those that are farther away from the
origin. In other words, as the x-andy-coordinates increase,
the clusters become less dense in Figure 4(f). In Figure 4(e),
the clusters of the untrained data are compact and highly
dense. The formed clusters are primarily well defined and
distinguished. This figure clearly shows that the 10 clusters
10 EURASIP Journal on Bioinformatics and Systems Biology
665 670 675 680 685 690 695
×10
3
4730000
4740000
4750000
4760000
4770000
4780000
x-coordinate (utm, meters)
y-coordinate (utm, meters)
FES-k-means clusters
1
2
3
4(best)
5(best)
6
7(best)
8
(a)
670 675 680 685 690
×10
3
4745000
4750000
4755000
4760000
4765000
4770000
x-coordinate (utm, meters)
y-coordinate (utm, meters)
FES-k-means clusters
1
2
3
4(best)
5(best)
6
7(best)
8
(b)
−88 −87.9 −87.8 −87.7 −87.6 −87.5
41.6
41.7
41.8
41.9
42
42.1
x-coordinate (decimal degrees, miles)
y-coordinate (decimal degrees, miles)
FES-k-means clusters
1
2(outliers)
3(outliers)
4(best)
5(best)
6(best)
(c)
−87.8 −87.75−87.7 −87.65−87.6 −87.55
41.7
41.75
41.8
41.85
41.9
41.95
42
x-coordinate (decimal degrees, miles)
y-coordinate (decimal degrees, miles)
FES-k-means clusters
1
2
3(best)
4(outliers)
5(best)
6(best)
(d)
−50 0 50 100 150
−20
0
20
40
60
80
x-axis
y-axis
FES-k-means clusters
1
2
3
4
5
6
7
8
9
10
(e)
−20 0 20 40 60 80 100 120
0
20
40
60
x-axis
y-axis
FES-k-means clusters
1
2
3
4
5
6
7
8
9
10
(f)
Figure 4: FES-k-means delineated boundaries of untrained and MIL-SOM trained data for: (a,b) adult asthma; (c,d) elevated blood lead
levels linked with age of housing units; and (e,f) synthetic data. (a,c,e) panel is the representation of untrained data, while on (b,d,f) is the
representation of trained data.
EURASIP Journal on Bioinformatics and Systems Biology 11
(a) (b) (c)
(d) (e) (f)
Figure 5: Photos depicting housing conditions in Chicago, Illinois (taken in November 2006). The first five photos (Figures 5(a) through
5(e)) were taken in the west and southern part of city; and the last photo (Figure 5(f)) was taken in the northern part of the city. The
fieldwork was partly based on the need to evaluate the quality of clusters and outliers identified in each class using the box plot while post
processing. Figure 5(b) displays the locations where the photos were taken.
found in here are a good representation of the clusters of
the original data. Both figures show that the clusters for the
synthetic dataset using the FES-k-means clustering approach
are comparable.
5. Discussions
In this study, we have presented an improved clustering
algorithm that overcomes some of the problems commonly
associated with the conventional k-means algorithm. Justi-
fication of our focusing on k-means is primarily because it
is a standard technique, is commonly used in a variety of
applications, is employed on different software platforms,
and is fairly easy to manipulate. Our goal of this study
was to further explore this newly developed algorithm and
understand its capacity in terms of disease mechanism
discovery. Based on the BLL dataset, we detected a robust and
consistent pattern of elevated blood levels among children
that was completely missed in previous analysis. This lead to
the formulation of a new study hypothesis revealing that the
linear-like pattern of elevated BLL discovered in this analysis
may be spatially linked to the city’s water service lines.
In terms of the benefits and properties of using this
algorithm, previous studies like those of Alsabti et al. [17],
Pelleg and Moore [23], and Kanungo et al. [15] used a two-
level approach by employing the k-d tree data structure.
Other integrative studies, those by Vesanto and Alhoniemi
[19] and Yano and Kotani [8] used the approach of
combining a self-organizing map and k-means clustering for
analyzing data. In this study, we explored the new algorithm
separately using untrained datasets and also applied it to
MIL-SOM trained datasets. Its design and implementation
involved the application of the k-d tree data structure,
nearest neighbor query, and a modified method to perform
cluster updating by employing Mashor’s adaptation rate.
To the best of our knowledge no study has synthesized a
conglomerate of these methods to enhance the efficiency in
the k-means algorithm. The major benefit of our method
is its procedural complexity that provides better speed and
its strength has been demonstrated on real-world spatial
datasets and synthetic datasets.
Although other clustering algorithms and many deriva-
tives of the k-means algorithm have been introduced in the
literature, the FES-k-means method has the advantage of
yielding efficient clusters when used in combination with
the MIL-SOM algorithm. We used the U-matrix (Sammon’s
mapping may also be used) results from the MIL-SOM
training data to determine the value of k. This then enabled
us to establish initial parameters for the number of clusters in
the data, foregoing our dependency on costly computational
wrapper methods like k-means with random restart [14]
or the costly task of searching for the best initializations
possible used by Bradley and Fayyad [28], among many other
researchers.
12 EURASIP Journal on Bioinformatics and Systems Biology
Cluster 6
Cluster 2
Cluster 5
2427
2178
2456
1838
2348
2492
1857
2416
2489
1398
1559
1855
2425
Cluster outliers
Expressways
Water bodies
10 miles
Exploring BLL and
age of housing units
02.55
N
S
EW
Figure 6: Three delineated clusters in reference to age of housing
units—revealing cluster outliers, proximity to major roadways, and
water bodies in the City of Chicago. We hypothesize that this linear-
like pattern of elevated BLL may be spatially linked to the city’s
water service lines. This hypothesis begs a question: In the Chicago
region, could lead pipes be a primary transportation medium for
lead-contaminated water supply in schools, homes, and so forth?
Our research confirmed previous studies that the
training—clustering combination provides considerably bet-
ter clusters than clustering without training. We witnessed
that clustering formed from the MIL-SOM trained data
is very similar and acceptable to the clusters formed by
clustering the data directly. Other studies suggest that using
a two-stage data reduction technique significantly improves
clustering over clustering the data directly [29]. This two-
stage procedure of clustering prototype vectors reduces the
computation time, enabling clustering of large geospatial
data [19].
Let us consider a few examples to support our claims.
Though limited in available literature, with the new k-
windows approach [5], the windows have to be prede-
termined and input by the user. The density-based clus-
tering algorithm DBSCAN accounts for arbitrary shapes
and varying cluster sizes [30]. However, it has two input
parameters that are limiting, the noise percentage has to
be determined by and input by the user; the minimum
number of points is automatically preset to 4 for all two-
dimensional datasets; and lastly it assumes uniform cluster
density—all pointing to a very limited fate with real-life
applications on large, high-dimensional datasets. CLARANS
is another incompetent algorithm because it is prohibitive
on large databases—when dealing with large clusters, it has
the tendency to split large clusters, and it has no explicit
notion of dealing with noise [31]. In addition, studies
performed by Ester et al. [30] have reported that DBSCAN is
superior to CLARANS. Therefore, though not scientifically
proven, we can assume that if FES-k-means is superior
to DBSCAN; it also outperforms CLARANS. The CURE
(clustering using representatives) uses cluster representatives
that are found using a shrinking method [32]. Although
this method can find arbitrary shapes and cluster sizes, the
algorithm can incorrectly merge clusters. The Chameleon
method partitions data into subclusters and then repeatedly
combines them to obtain final clusters [33]. This method also
relies on user-specified thresholds for its input parameters,
relative interconnectivity, and relative closeness between
cluster pairs in order to correctly merge clusters, possibly
resulting in under- or overestimates of interconnectivity. To
date, it has not proven successful on data with more than
two dimensions and does not accurately compute values
for small clusters. Consequently, we can assume that FES-
k-means outperforms each of these methods because the
aforementioned problems are inherently addressed by the
novel FES-k-means method.
Standard k-means has a time complexity based on the
product of the number of patterns, N, the number of
clusters, k, and the number of iterations—overwhelmingly
increasing costs for large datasets [34]. We discount this
costly computation by reducing the number of patterns
examined using the well-known k-d tree data structure.
The implementation of the k-d tree structure is used in
collaboration with nearest neighbor query to maximize
indexing and to provide a well-organized search and retrieval
mechanism. This approach introduces an efficient storage
structure that reduces the computational cost of match
queries and is so dynamic that it can be employed by
many applications according to Bentley [21] and Likas et
al. [14]. Data tree structures provide stability to the data
structure as mentioned by Kanungo et al. [15], along with
better partitioning accuracy [5] and preliminary clustering
of the dataset [14]. There are two main approaches for the
overall k-d structure: (1) splitting using the median-based
approach or midpoint-based approach and (2) splitting
across the dimensions or along the lengthiest side. We built
the k-d tree structure according to the suggestion of Alsabti
et al. [17] using the midpoint-based approach along the
lengthiest side, which they claim is the best k-d pruning
approach. Although more complex pruning strategies are
available, we found Kanungo’s pruning approach to be
efficient and did not require much computation time
[17].
FES-k-means was written in C and was then exported
and utilized in Matlab in conjunction with the MIL-SOM
algorithm. The efficiency and robustness of the algorithm
enables it to be used on multiple platforms and program
applications. The runtime plots for each dataset for each
method report that the FES-k-means scales linearly with
the percentage of data. It is important to note that the
EURASIP Journal on Bioinformatics and Systems Biology 13
variation in the data amounts in these datasets ranges from
2,605 records to 36,000 records; some scattered others are
tightly compact. These plots reveal that, unlike conventional
k-means, FES-k-means is not as sensitive to the size and
distribution of the data. Note that the untrained data is
plagued with noise and outliers. Initializing the clusters
using the MIL-SOM algorithm enables effective management
of these outliers. Furthermore, post processing using box
plots shows even greater performance of cluster formation
and is instrumental in identifying cluster outliers immedi-
ately.
6. Conclusions and Future Directions
The FES-k-means algorithm uses a hybrid approach that
comprises the k-d tree data structure [21], nearest neighbor
query for the k-d tree [35], the original k-means algorithm
[3], and an adaptation rate proposed by Mashor [18].
The main properties established during the implementation
and experimentation with the FES-k-means algorithm is as
follows: (1) it produces clusters similar to the original k-
meansmethodatamuchfaster rate; and (2) it provides
efficient analysis of large geospatial data with implications
for disease mechanism discovery. From a disease mechanism
discovery perspective, it is hypothesized that the linear-like
pattern of elevated blood lead levels discovered in the city
of Chicago may be spatially linked to the city’s water service
lines.
Additional observations made in this study that further
characterize the FES-k-means clustering approach are as
follows: (1) clustering previously trained data using the
MIL-SOM method is more beneficial than clustering an
entire dataset; (2) knowledge can be discovered based
on outlier detection that was otherwise undistinguishable
by traditional methods; and (3) FES-k-means clustering
algorithm produces interesting information that can lead to
further discoveries.
Possible expansion of the FES-k-means algorithm may
revolve around ways to evaluate and measure cluster and
subcluster qualities of the FES-k-means method by use of
established or newly developed dissimilarity calculations; use
of FES-k-means on nonnumeric data; implementation of
parallel processing for acceleration; and ability to handle
even larger datasets simultaneously. We believe that error
tracking at each major step of the algorithm will help to
improve the overall mean square error. Also, FES-k-means
has been developed to handle point data; therefore it is
limited in its ability to cluster other data types—that is, lines
or polygons.
Future developments for clustering, in general, may
include the ongoing effort on how to effectively visualize
multidimensional data; and as with the case of all clustering
algorithms, clusters formed via one cluster performance
are not necessarily the same clusters formed on processes
thereafter, focusing on an algorithm that can return identical
cluster structures for each subsequent cluster procedure of
a given dataset is a future attempt for cluster optimiza-
tion.
Protection of Human Subjects
All research was approved by the Southern Illinois Uni-
versity Carbondale Human Investigation Review Board in
accordance with national and institutional guidelines for the
protection of human subjects.
Acknowledgments
Dharani Babu Shanmugam and Haricharan Padmanabana
Computer Programmers assisted with program and code
implementation. Kara Scott for her help with the evaluation
of the algorithm, compilation, and fieldwork. Jameson
Lwebuga-Mukasa for asthma datasets and Anne Evens and
Patrick MacRoy for BLL dataset. Special thanks to anony-
mous reviewers for offering their insightful and critical
reviews of the FES-k-means algorithm. Timely feedback
helped with the design, implementation, and quality of
algorithm.
References
[1] Z. Huang, “Extensions to the k-means algorithm for clustering
large data sets with categorical values,” Data Mining and
Knowledge Discovery, vol. 2, no. 3, pp. 283–304, 1998.
[2] S. Theodoridis and K. Koutroumbas, Pattern Recognition,
Academic Press, San Diego, Calif, USA, 2nd edition, 2003.
[3] J. B. MacQueen, “Some methods for classification and analysis
of multivariate observations,” in Proceedings of the 5th Berkeley
Symposium on Mathematical Statistics and Probability,pp.
282–297, University of California, 1967.
[4] D. Pelleg and A. W. Moore, “X-means: extending k-means
with efficient estimation of the number of clusters,” in
Proceedings of the 17th International Conference on Machine
Learning (ICML ’00), pp. 727–734, 2000.
[5] M. N. Vrahatis, B. Boutsinas, P. Alevizos, and G. Pavlides,
“The new k-windows algorithm for improving the k-means
clustering algorithm,” Journal of Complexity,vol.18,no.1,pp.
375–391, 2002.
[6] T. J. Oyana and K. E. Scott, “A geospatial implementation of a
novel delineation clustering algorithm employing the k-means
(pp 135–157),” in The European Information Society, Taking
Geoinformation Science One Step Further Se ries,B.Lars,F.
Anders, and P. Hardy, Eds., Lecture Notes in Geoinformation
and Cartography, Springer, Heidelberg, Germany, 2008.
[7]A.Demiriz,K.P.Bennet,andM.J.Embrechts,“Semi-
supervised clustering using genetic algorithms,” in Proceedings
of the Artificial Neural Networks in Engineering (ANNIE ’99),
pp. 809–814, 1999.
[8] N. Yano and M. Kotani, “Clustering gene expression data using
self-organizing maps and k-means clustering,” in Ji do Seigyo
Rengo Koenkai Koen Ronbunshu SICE Annual Conference, vol.
3, pp. 3211–3215, Fukui University, Fukui, Japan, August 2003.
[9] A. Curtis, “Using a spatial filter and a geographic information
system to improve rabies surveillance data,” Emerging Infec-
tious Diseases, vol. 5, no. 5, pp. 603–606, 1999.
[10] T. J. Oyana, D. Boppidi, J. Yan, and J. S. Lwebuga-Mukasa,
“Exploration of geographic information systems-based med-
ical databases with self-organizing maps: a case study of adult
asthma,” in Proceedings of the 8th International Conference on
GeoComputation, University of Michigan, Ann Arbor, Mich,
USA, August 2005.
14 EURASIP Journal on Bioinformatics and Systems Biology
[11] D. Alahakoon, S. K. Halgamuge, and B. Srinivasan, “Dynamic
self-organizing maps with controlled growth for knowledge
discovery,” IEEE Transactions on Neural Networks, vol. 11, no.
3, pp. 601–614, 2000.
[12] T. Kohonen, S. Kaski, K. Lagus et al., “Self organization of
a massive document collection,” IEEE Transactions on Neural
Networks, vol. 11, no. 3, pp. 574–585, 2000.
[13] Y. Bengio, J. M. Buhmann, M. J. Embrechts, and J. M. Zurada,
“Introduction to the special issue on neural networks for
data mining and knowledge discovery,” IEEE Transactions on
Neural Networks, vol. 11, no. 3, pp. 545–549, 2000.
[14] A. Likas, N. Vlassis, and J. J. Verbeek, “The global k-means
clustering algorithm,” Pattern Recognition,vol.36,no.2,pp.
451–461, 2003.
[15] T. Kanungo, D. M. Mount, N. S. Netanyahu, C. D. Piatko,
R.Silverman,andA.Y.Wu,“Anefficient k-means clustering
algorithms: analysis and implementation,” IEEE Transactions
on Pattern Analysis and Machine Intelligence, vol. 24, no. 7, pp.
881–892, 2002.
[16]D.T.Pham,S.S.Dimov,andC.D.Nguyen,“Atwo-phase
k-means algorithm for large datasets,” Proceedings of the
Institution of Mechanical Engineers C, vol. 218, no. 10, pp.
1269–1273, 2004.
[17] K. Alsabti, S. Ranka, and V. Singh, “An efficient k-means
clustering algorithm,” in Proceedings of 1st IN/IPPS/SPDP
Workshop on High Performance Data Mining, pp. 34–39,
March 1997.
[18] M. Y. Mashor, “Improving the performance of k-means
clustering algorithm to position the centers of RBF network,”
International Journal of the Computer, The Internet and
Management, vol. 6, no. 2, pp. 121–124, 1998.
[19] J. Vesanto and E. Alhoniemi, “Clustering of the self-organizing
map,” IEEE Transactions on Neural Networks,vol.11,no.3,pp.
586–600, 2000.
[20] D. L. Davies and D. W. Bouldin, “A cluster separation
measure,” IEEE Transactions on Pattern Analysis and Machine
Intelligence, vol. 1, no. 2, pp. 224–227, 1979.
[21] J. L. Bentley, “Multidimensional binary search trees used for
associative searching,” Communications of the ACM, vol. 18,
no. 9, pp. 509–517, 1975.
[22] V. Gaede and O. G
¨
unther, “Multidimensional access methods,”
ACM Computing Surveys, vol. 30, no. 2, pp. 170–231, 1998.
[23] D. Pelleg and A. W. Moore, “Accelerating exact k-means
algorithms with geometric reasoning,” in Proceedings of the
5th ACM SIGKDD International Conference on Knowledge
Discovery and Data Mining, pp. 277–281, ACM Press, New
York, NY, USA, 1999.
[24] C. Darken and J. Moody, “Fast adaptive k-means clustering:
some empirical results,” in Proceedings of the International
Joint Conference on Neural Networks (IJCNN ’90), vol. 2, pp.
233–238, June 1990.
[25] T. J. Oyana, L. E. K. Achenie, E. Cuadros-Vargas, P. A. Rivers,
and K. E. Scott, “A mathematical improvement of the self-
organizing map algorithm. Chapter 8: ICT and mathematical
modeling (pp 522–531),” in Advances in Engineering and
Technology, J. A. Mwakali and G. Taban-Wani, Eds., p. 847,
Elsevier, London, UK.
[26] T. Kohonen, “The self-organizing map,” Proceedings of the
IEEE, vol. 78, no. 9, pp. 1464–1480, 1990.
[27] F. Bac¸
˜
ao, V. Lobo, and M. Painho, “Geo-self-organizing
map (Geo-SOM) for building and exploring homogeneous
regions,” in Proceedings of 3rd International Conference on Geo-
graphical Information Science (GIScience ’04),M.J.Egenhofer,
C. Freskes, and H. J. Miller, Eds., Springer, Adelphi, Md, USA,
October 2004.
[28] P. S. Bradley and U. M. Fayyad, “Refining initial points for k-
means clustering,” in Proceedings of the 15th International con-
ference on Machine Learning, pp. 91–99, Morgan Kaufmann,
San Francisco, Calif, USA, 1998.
[29] G. Hamerly and C. Elkan, “Alternatives to the k-means
algorithm that find better clusterings,” in Proceedings of the
11th International Conference on Information and Knowledge
Management (CIKM ’02), pp. 600–607, New York, NY, USA,
November 2002.
[30] M. Ester, H. P. Kriegel, J. Sander, and X. Xu, “A density based
algorithm for discovering clusters in large geospatial databases
with noise,” in Proceedings of the 2nd International Conference
on Knowledge Discovery and Data Mining (KDD ’96), pp. 226–
231, Portland, Ore, USA, 1996.
[31] R. Ng and J. Han, “Efficient and effective clustering methods
for spatial data mining,” in Proceedings of the 20th International
Conference of Very Large Data Bases (VLDB ’94), pp. 144–155,
Santiago, Chile, September 1994.
[32] S. Guha, R. Rastogi, and K. Shim, “Cure: an efficient clustering
algorithm for large databases,” in Proceedings of the ACM
SIGMOD Conference on Management of Data (SIGMOD ’98),
ACM Press, Seattle, Wash, USA, June 1998.
[33] G. Karypis, E. H. Han, and V. Kumar, “Chameleon: hierar-
chical clustering using dynamic modelling,” IEEE Computer
Special Issue on Data Analysis and Mining,vol.32,no.8,pp.
68–75, 1999.
[34] A. K. Jain, M. N. Murty, and P. J. Flynn, “Data clustering: a
review,” ACM Computing Surveys, vol. 31, no. 3, pp. 264–323,
1999.
[35] J. H. Friedman, J. L. Bentley, and R. A. Finkel, “An algorithm
for finding the best matches in logarithmic expected time,”
ACM Transactions on Mathematical Software, vol. 3, pp. 209–
226, 1977.
Photographȱ©ȱTurismeȱdeȱBarcelonaȱ/ȱJ.ȱTrullàs
Preliminaryȱcallȱforȱpapers
The 2011 European Signal Processing Conference (EUSIPCOȬ2011) is t he
nineteenth in a series of conferences promoted by the European Association for
Signal Processing (EURASIP, www.eurasip.org). This year edition will take place
in Barcelona, capital city of Catalonia (Spain), and will be jointly organized by the
Centre Tecnològic de Telecomunicacions de Catalunya (CTTC) and the
Universitat Politècnica de Catalunya (UPC).
EUSIPCOȬ2011 will focus on key aspects of signal processing theory and
li ti
li t d
b l
A t
f
b i i
ill
b
b d
lit
OrganizingȱCommittee
HonoraryȱChair
MiguelȱA.ȱLagunasȱ(CTTC)
GeneralȱChair
AnaȱI.ȱPérezȬNeiraȱ(UPC)
GeneralȱViceȬChair
CarlesȱAntónȬHaroȱ(CTTC)
TechnicalȱProgramȱChair
XavierȱMestreȱ(CTTC)
Technical Program Co
Ȭ
Chairs
app
li
ca
ti
ons as
li
s
t
e
d
b
e
l
ow.
A
ccep
t
ance o
f
su
b
m
i
ss
i
ons w
ill
b
e
b
ase
d
on qua
lit
y,
relevance and originality. Accepted papers will be published in the EUSIPCO
proceedings and presented during the conference. Paper submissions, proposals
for tutorials and proposals for special sessions are invited in, but not limited to,
the following areas of interest.
Areas of Interest
• Audio and electroȬacoustics.
• Design, implementation, and applications of signal processing systems.
l d
l
d
d
Technical
ȱ
Program
ȱ
Co
Chairs
JavierȱHernandoȱ(UPC)
MontserratȱPardàsȱ(UPC)
PlenaryȱTalks
FerranȱMarquésȱ(UPC)
YoninaȱEldarȱ(Technion)
SpecialȱSessions
IgnacioȱSantamaríaȱ(Unversidadȱ
deȱCantabria)
MatsȱBengtssonȱ(KTH)
Finances
Montserrat Nájar (UPC)
• Mu
l
time
d
ia signa
l
processing an
d
co
d
ing.
• Image and multidimensional signal processing.
• Signal detection and estimation.
• Sensor array and multiȬchannel signal processing.
• Sensor fusion in networked systems.
• Signal processing for communications.
• Medical imaging and image analysis.
• NonȬstationary, nonȬlinear and nonȬGaussian signal processing
.
Submissions
Montserrat
ȱ
Nájar
ȱ
(UPC)
Tutorials
DanielȱP.ȱPalomarȱ
(HongȱKongȱUST)
BeatriceȱPesquetȬPopescuȱ(ENST)
Publicityȱ
StephanȱPfletschingerȱ(CTTC)
MònicaȱNavarroȱ(CTTC)
Publications
AntonioȱPascualȱ(UPC)
CarlesȱFernándezȱ(CTTC)
I d i l Li i & E hibi
Submissions
Procedures to submit a paper and proposals for special sessions an d tutorials will
be detailed at www.eusipco2011.org
. Submitted papers must be cameraȬready, no
more than 5 pages long, and conforming to the standard specified on the
EUSIPCO 2011 web site. First authors who are registered students can participate
in the best student paper c ompetition.
ImportantȱDeadlines:
P l f i l i
15 D 2010
I
n
d
ustr
i
a
l
ȱ
Li
a
i
sonȱ
&
ȱ
E
x
hibi
ts
AngelikiȱAlexiouȱȱ
(UniversityȱofȱPiraeus)
AlbertȱSitjàȱ(CTTC)
InternationalȱLiaison
JuȱLiuȱ(ShandongȱUniversityȬChina)
JinhongȱYuanȱ(UNSWȬAustralia)
TamasȱSziranyiȱ(SZTAKIȱȬHungary)
RichȱSternȱ(CMUȬUSA)
RicardoȱL.ȱdeȱQueirozȱȱ(UNBȬBrazil)
Webpage:ȱwww.eusipco2011.org
P
roposa
l
sȱ
f
orȱspec
i
a
l
ȱsess
i
onsȱ
15
ȱ
D
ecȱ
2010
Proposalsȱforȱtutorials 18ȱFeb 2011
Electronicȱsubmissionȱofȱfullȱpapers 21ȱFeb 2011
Notificationȱofȱacceptance 23ȱMay 2011
SubmissionȱofȱcameraȬreadyȱpapers 6ȱJun 2011