Báo cáo sinh học: " Research Article Adaptive Wavelet Transform Method to Identify Cracks in Gears" pot
Bạn đang xem bản rút gọn của tài liệu. Xem và tải ngay bản đầy đủ của tài liệu tại đây (5.44 MB, 8 trang )
Hindawi Publishing Corporation
EURASIP Journal on Advances in Signal Processing
Volume 2010, Article ID 879875, 8 pages
doi:10.1155/2010/879875
Research Article
Adaptive Wavelet Transform Method to Identify Cracks in Gears
Ales Belsak and Joze Flasker
Laboratory for Computer Aided Engineering, Faculty of Mechanical Engineeri ng, University of Maribor, Smetanova ulica 17,
2000 Maribor, Slovenia
Correspondence should be addressed to Ales Belsak,
Received 20 January 2010; Revised 18 May 2010; Accepted 21 June 2010
Academic Editor: Ling Shao
Copyright © 2010 A. Belsak and J. Flasker. This is an open access article distributed under the Creative Commons Attribution
License, which permits unrestricted use, distribution, and reproduction in any medium, provided the original work is properly
cited.
Many damages and faults can cause problems in gear unit operation. A crack in the tooth root is probably the least desirable
among them. It often leads to failure of gear unit operation. By monitoring vibrations, i t is possible to determine the presence of
a crack. Signals are, however, very noisy. This makes it difficult to define properties of individual components. Wavelet analysis
is an effective tool for analysing signals and for defining properties. In this paper, a denoising method based on wavelet analysis,
which takes prior information about impulse probability density into consideration, is used to identify transient information from
vibration signals of a gear unit with a fatigue crack in the tooth root.
1. Introduction
The aim of maintenance is to keep a technical system (gear
unit) in the most suitable working condition, and its purpose
is to discover, to diagnose, to foresee, to prevent and to
eliminate damages. The purpose of modern maintenance,
however, is not only to eliminate failures but also to define
the stage of a potential danger of a sudden failure of
system operation. The aim of diagnostics is to define the
current condition of the system and the location, shape, and
reason of damage formation. The following diagnostic v alues
are used to define incorrect operation, the possibility and
location of damages, and the possibility of elimination of
these damages: different signals, condition parameters, and
other indirect signs. Identification of the form of damage is
based on deviations from the values typical of a faultless gear
system.
Gear units are often used in various industrial applica-
tions. Consequently, it is of utmost significance to identify
fault symptoms of a gear unit at an early stage. It is vibr ation
signals that are primarily used to identify faults but they are
always complex and it is difficult to identify faults in gear
units on the basis of vibration signals. Acquired vibration
signals often contain a lot of noise. With too much noise,
the useful information is corrupted to such an extent that
it is impossible to establish the condition or that a wrong
conclusion is made.
A gear unit consists of elements enabling the transmis-
sion of rotating movement. Although a gear unit is a complex
dynamic model, its movement is usually periodical; faults
and damages represent a disturbing quantity or impulse.
Local and time changes in vibration signals indicate the
disturbance [1, 2] and it is possible to expect time-frequency
changes [3]. This idea is based on kinematics and operating
characteristics [4, 5].
It is of key importance t o apply effective methods for the
identification (extraction) of properties from noisy signals.
Wavelet analysis is one such effective tool. It is especially
suitable when it comes to processing nonstationary signals.
Local energy distributions in time domain and frequency
domain are typical of transient property components of
vibration signals, which resemble a wavelet function. It is
possible to use wavelet functions to detect transient property
components due to similar structures.
It is possible to apply wavelets to extract features and
purge noise. Matching pursuits by Mallat [6] and soft-
threshold denoising by Donoho and Johnstone [7, 8]are
among such procedures. Threshold in the wavelet domain
2 EURASIP Journal on Advances in Signal Processing
is used for threshold denoising. It is possible to present
that this is asymptotically almost optimal for many signals,
which have been corrupted by additive white Gaussian noise.
However, feature components of many mechanical dynamic
signals consist of impulse components. This method, how-
ever, has not been proved effective for impulse component
extraction. Smoothness of the signal that will be isolated
is assumed by all previously mentioned methods, based on
orthogonal wavelet transforms. The transient components,
which are treated as noise, vary quickly. Some of these
methods result in an even greater smoothness than in
case of the original signal. Consequently, existing denoising
methods are not suitable for vibration analysis of signals
produced by gears as impulses that need to be isolated
are not smooth. For threshold denoising, Morlet wavelet is
used, and similarity between the Morlet wavelet and impulse
is applied. If nonorthogonal wavelet transform is used,
this does not ensure that, after the transform, independent
and identically distributed noise retains this characteristic
on each scale. After nonorthogonal wavelet transforms,
statistical noise attributes become different as rules that apply
for thresholding when orthogonal wavelet transforms are
used are not suitable for thresholding when nonorthogonal
wavelet transforms are involved.
The technique with high-order statistics was sometimes
more successful. The shape of the amplitude distribution
of vibration data is described on the basis of statistical
moments. However, oversensitivity to vibration and noise is
characteristic of higher moments whereas lower moments
are less sensitive to early-stage fault. As a result, in relation
to statistical moments used in pr actice, only the fourth nor-
malized moment (kurtosis) a nd third normalized moment
are useful. If a defect must be identified at a very early
stage, kurtosis is preferred over the third moment as this
implies higher sensitivit y to impulse signals [9]. Thus, the
third and fourth moments have some disadvantages, and to
eliminate these disadvantages, a class of new diagnostic gear
failure indexes have been derived, based on Renyi entropy, to
describe vibration signature and to optimise the parameter
of the wavelets. They present, so to speak, a generalization of
traditional statistical moments. Nannone and Morabito [10]
used wavelet entropy to extract features from complex signals
in medicine, and Tao et al. [11] and Qiu et al. [12] used in
mechanical systems.
In order to make denoising more effective, a new
denoising method based on Morlet wavelet with adjustment
of the shape of the wavelet filter based on the Renyi
entropy and maximum likelihood estimation denoising
method for non-Gaussian data is proposed in this paper;
this method is particularly useful to extract impulse com-
ponents. With the new specific threshold rule, based on the
maximum likelihood estimation, the information regarding
the probability density function of the impulse is taken into
consideration.
2. Wavelet Analysis
The continuous wavelet transform of function x(t) ∈ L
2
(R)
at the time and scale is expressed as follows [6]:
Wx
(
u, s
)
=
x, ψ
u,s
=
+∞
−∞
x
(
t
)
·
1
√
s
· ψ
∗
t −u
s
·
dt
=
1
√
s
n
t=1
x
(
t
)
···ψ
∗
t −u
s
,
(1)
ψ
s
(
t
)
=
1
√
s
· ψ
∗
−
t
s
,(2)
Ψ
s
(
ω
)
=
√
s · Ψ
∗
(
s
· ω
)
,(3)
where the transform is presented as the product of con-
volution; (2) presents the expression of an average wavelet
function and the corresponding Fourier integral transform,
(3).
At the continuous wavelet transform, the observed func-
tion x(t) is multiplied by a group of shifted and scaled wavelet
functions. A simultaneous change in time and frequency
dissemination of the continuous wavelet transform can be
observed. Wavelets, as locally limited functions, are used to
analyse the observed function x(t). The continuous wavelet
transform is very sensitive to local nonstationarities.
Morlet wavelet function, which is a representative of a
nonorthogonal wavelet function:
ψ
Morlet
t, σ, η
=
1
4
√
π
· e
−t
2
/2
· e
i·η·t
. (4)
Equation (5) yields a family of wavelet functions or a
shifted u and scaled s Morlet wavelet function is
ψ
Morlet
t, σ, η
=
1
√
s
·
1
4
√
π
· e
−(1/2)·((t−u)/s)
· e
i·η·((t−u)/s)
.
(5)
Various wavelet basis functions were selec ted in wavelet
applications. Theoretically speaking, any function that is
finite in time and frequency can be used for the basis
function. Several types of functions can be used as a
wavelet basis; the select ion depends on the application-
related requirements [13, 14].
The Morlet wavelet was used as the basis function
due to the similarity of formulation with Gabor transform
function that was researched in our laborator y. The Gabor
transform has some properties in Fourier transforms. The
only difference between the Morlet wavelet and Gabor
transform is in the exponent term, which helps determine
the shape of the wavelet.
Using the expression in (5), the time function can be
further transformed to the frequency domain as shown
below:
ψ
Morlet
(
ω, σ
)
=
4
√
π ·
2 · π
s
· e
−i·ω·u
· e
−(ω−(η/s))
2
·(s
2
/2)
.
(6)
EURASIP Journal on Advances in Signal Processing 3
The Morlet wavelet is a complex wavelet and it can be
decomposed into two parts—one of them for the real part
and the other one for the imaginary part:
ψ
Morlet real
t, σ, η
=
1
√
π
· e
−β
2
·(t
2
/2)
· cos
(
ω · t
)
,
ψ
Morlet imag
t, σ, η
=
1
√
π
· e
−β
2
·(t
2
/2)
· sin
(
ω · t
)
,
(7)
where β is the shape parameter, balancing time resolution
and frequency resolution of the Morlet wavelet.
It is evident from (6) that the shape of the basic wavelet
is controlled by parameter β. With the reduction of β, the
frequency resolution will increase whereas time resolution
will decrease. When β tends to be infinite, the Morlet wavelet
becomes a Dirac function w ith the finest time resolution.
With β tending to be 0, the Morlet wavelet becomes a cosine
function with the finest frequency resolution. Therefore,
there is always an optimal β with the best time-frequency
resolution for a certain signal localized in the time-frequency
plane.
Only the real part is usually used. The real part of the
Morlet wavelet is a cosine signal decaying exponentially on
the left and right side, and its function shape is similar to
an impulse. Because of this similarity the Morlet wavelet is
widely used in mechanical fault diagnostic applications.
By time translation and scale dilation, a daughter Morlet
wavelet is acquired from the mother wavelet:
ψ
Morlet
t, σ, η
=
1
√
π
· e
−β
2
·(t(t−u)
2
/(2·s
2
))
· cos
π ·
(
t
− u
)
s
,
(8)
where s is the scale parameter for dilation and u for
time translation. It is possible to construct, by selecting
parameters s and u, a daughter Morlet wavelet closely
matching the shape of a mechanical impulse.
It is required to first define the location and shape
of the frequency band corresponding to the impulses in
order to define the impulses by means of filtering. Location
and shape of the daughter Morlet wavelet are controlled
by scale s and parameter β. Due to this, it is possible to,
by optimising the two parameters for a daughter wavelet,
build an adaptive wavelet filter. The selection of the mother
wavelet that adapts best to the signal to be isolated was dealt
with by several researchers [15–17]. It is not required to
carry out optimal wavelet reconstruction but to find the best
daughter wavelet. Differences between single- and double-
sided Morlet wavelets were dealt with by Wang [18]. Their
frequency spectra are quite different. A real impulse is usually
nonsymmetric, and, consequently, the right-hand side of
Morlet wavelet was selected to be used as the basis. Such
wavelets should be most appropriate to match the behaviour
of hidden impulses.
It is required to determine the location and shape of the
frequency band corresponding to the impulses in order to
identify the immersed impulses by means of filtering. As a
result, it is possible to form an adaptive wavelet filter by
optimising the parameter β for a daughter wavelet. Here it
is presented how to find the best wavelet filter (the daughter
wavelet of a Morlet wavelet) instead of optimal wavelet
reconstruction.
In relation to optimising the wavelet base, sparsity is
usually applied in order to evaluate the wavelet base. Since
the wavelet that corresponds to the smallest number of signal
wavelet transformation coefficients is the most optimal, it is
possible to define the value β by establishing which wavelet
coefficients are the sparsest. Renyi entropy can be applied to
measure the diversity of a possibility series. It is, therefore,
possible to use entropy of wavelet coefficients to measure
sparsity of coefficients of these wavelets.
Renyi entropy, which is sometimes referred to as measure
of uncertainty, is of a random variable and is determined
on the basis of its probability distribution. It is possible to
present it as a good measure of randomness and sparseness.
Entropy, as information measure of randomicity of
random events, depends on event probability distribu-
tion. By analogy, considering signal amplitude distribution,
entropy is sensitive also to the shape of discrete signals
amplitude distribution. Small entropy values are associated
with peak signals for which small numbers of large amplitude
components are typical; on the other hand large entropy
values are related to signals dominated by equal amplitude
components. It is possible to consider wavelet transform
coefficients with minimal Renyi entropy as the sparsest
result. By means of this typical feature, Renyi entropy, on the
basis of which a class of new diagnostic indices are derived in
order to carry out condition monitoring of gear units, has
introduced a generalized statistical moment concept along
with its analytic expression.
Renyi entropy is sensitive to sharp variant structures in
signal, for example, impulses. Consequently it is applied
to detect fault symptoms [19]. The bigger the impulse in
signals, the smaller the Renyi entropy value.
Renyi entropy definition is based on the theory of means
[19]:
H
= ϕ
−1
⎛
⎝
N
k=1
p
k
ϕ
I
p
k
⎞
⎠
,(9)
where ϕ(
·) is a continuous and strictly monotonic function
subclass of Kolmogorov-Nagumo functions. To meet the
constraints of an information measure,
ϕ
(
x
)
=
x Shanon Entropy,
2
(1−α)·x
Renyi Entropy with order α
.
(10)
I(p
k
) is any information measure. By simplifying the
above relation,
H
α
=
1
1 − α
log
2
⎛
⎝
N
k=1
p
α
k
⎞
⎠
, α>0, α
/
=1. (11)
4 EURASIP Journal on Advances in Signal Processing
The third order Renyi entropy (α
= 3) is calculated on
the basis the wavelet representations:
H
W
3
=−
1
2
log
2
∞
−∞
W
3
(
a, b
)
dadb
. (12)
3. Wavelet Denoising
The aim of wavelet threshold denoising method, which was
introduced by Donoho [7], is to remove independent and
identically distributed Gaussian noise. A signal series x(t)
=
{
x
1
(t), x
2
(t), , x
n
(t)}, which is acquired using a sensor,
consists of impulses and noise. It is possible to express x(t)
as follows:
x
(
t
)
= p
(
t
)
+ n
(
t
)
, (13)
where p(t)
={p
1
(t), p
2
(t), , p
n
(t)} denotes the impulses
to be determined whereas n(t)
={n
1
(t), n
2
(t), , n
n
(t)}
denotes the noise with mean zero and standard deviation σ.
Wavelet threshold denoising method is based on the
idea of the concentration of energy of the signal that needs
to be identified on a few wavelet coefficients and of the
spreading of noise energy throughout all wavelet coefficients.
It is of importance to make signal concentrate on fewer
coefficients, in relation to which similarity between basic
wavelet and signal that must be identified plays an important
role. The components of the impulse must be made as
expressed as possible in order to improve the impulse
isolation performance.
It is assumed by all traditional methods that noise prop-
erties are known, meaning that the noise is independent and
identically distributed. In industrial applications, however,
some data on the signal to be detected is often available but
the exact behaviour of the noise is not known. The maximum
likelihood estimation denoising method is suitable for non-
Gaussian data.
Prior information on the impulse probability density
function is taken into consideration in a specific threshold
rule, based on the maximum likelihood estimation method.
As to this rule, it is not necessary that the noise is inde-
pendent and identically distributed Gaussian. It is, however,
required to know in advance the probability density function
of the impulse to be defined.
Hyv
¨
arinen introduced the so-called “sparse code shrink-
age” method, which estimates non-Gaussian data under
noisy conditions and is based on the maximum likelihood
estimation principle [20].
For a very sparse probability density function, Hyv
¨
arinen
[20] used the follow ing function to represent a sparse
distribution:
p
(
s
)
=
(
α +2
)
·
(
0.5
· α ·
(
α +1
))
0.5·α+1
2 · d ·
0.5 · α
(
α +1
)
+ |s/d|
α+3
, (14)
where d indicates the standard deviation of the impulse to
be isolated whereas α indicates the parameter controlling the
sparseness of the probability density function.
For an impulse, in relation to which the probability
density function can be represented by (9), Hyv
¨
arinen used
the sparse shrinkage threshold rule [20]:
g
(
u
)
= sign
(
u
)
max
0,0.5 ·
(
|u|−a · d
)
+0.5
·
(
|u|−a · d
)
2
− 4 · σ
2
·
(
α +3
)
,
(15)
where σ
=
0.5 · α · (α + 1) indicates the standard deviation
of the noise.
The following steps are used for the denoising method
based on appropriate wavelet Morlet filter.
(1) The procedure of achie ving the appropriate wavelet.
In order to produce different daughter wavelets,
modify the parameters β.
(2) Calculate the entropy for each daughter wavelet.
(3) To identify hidden impulses, it is very appropriate to
use the parameter β corresponding to the minimum
Renyi entropy .
(4) Signal decomposition. To perform a wavelet trans-
form for the signal, use the Morlet wavelet with
appropriate parameter β corresponding to the min-
imum Renyi entropy. To obtain the wavelet coeffi-
cients, use (8).
(5) To shrink the wavelet coefficients, use the threshold
rule from (15).
(6) Signal reconstruction. Perform the inverse transform
of the shrunken wavelet coefficients. The result
represents an approximation to the impulse to be
isolated. Let Wx(u, s) be reconstructed coefficients.
Then, to purify the signal, use the following equation
[6]:
x
(
t
)
=
1
C
ψ
·
+∞
−∞
Wx
(
u, s
)
·
1
√
s
· ψ
t −u
s
·
du ·
ds
s
2
.
(16)
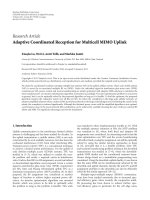
4. Practical Example
The test used for the measurements is shown in Figure 1.It
belongs to the Computer Aided Design Laboratory of the
Faculty of Mechanical Engineering, University of Maribor.
A single stage gear unit EZ6.B3.132 produced by Strojna
Maribor was used. A helical gear unit with straight teeth
was integrated into the gear unit [9]. The pinion had 19
and the w heel 34 teeth. Each gear unit had a carburised
spur gear pair (module: 4 mm). Accelometers for measuring
vibrations were fixed on the housings. Tests were carried
out under constant loads. The presented results refer to a
nominal pinion torque of 30 Nm and a nominal pinion speed
of 1200 rpm (20 Hz), which is, in industrial applications, a
very typical load condition for this type of gear units.
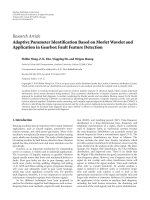
We used a standard ground gear pair, shown in Figure 2,
with teeth quality 6 but with a 4.5 mm crack in a tooth
EURASIP Journal on Advances in Signal Processing 5
Figure 1: Test plant.
Figure 2: Pinion with a fatigue crack in the tooth root [21].
root of a pinion. Measurements were performed under the
operating conditions typical of this type of a gear unit.
The measurement process and analysis preparations are
presented in detail in [9].
4.1. Comparison Analysis of Practical Signals. To c ar r y o ut
first comparisons, continuous wavelet transform for tested
gear unit with frequency scalograms was prepared.
Morlet wavelet function represents normalised and
square values of wavelet coefficients amplitudes. The repre-
sentation is c arried out in a time-frequency domain due to
the established connection between the scale and frequency.
It is much simpler to establish adequate characteristics
in time-frequency domain (frequency scalogram) than in
time-scale domain (scalogr a m). Consequently, this is very
appropriate when it comes to technical diagnostics. The
energy of wavelet transform equals the energy of the original
signal in time domain as, on the basis of normalization,
the transform matches the Parseval characteristic of energy
preservation.
The continuous wavelet transform with parameters η
= 6
and σ
= 1 was used. The representation of the frequency
scalogram is in the form of wavelet coefficients or their
square values. The analysis was based on a part of the signal
60
55
50
45
40
35
30
25
20
15
10
5
0
Frequency (Hz)
Acceleration (m/s
2
)
0 0.015 0.025 0.035 0.045 0.055
Time (s)
40
30
25
20
8
0
×10
2
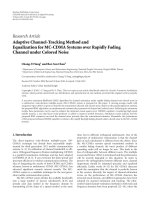
Figure 3: Frequency scalogram of wavelet coefficient of the
reference gear unit.
Acceleration (m/s
2
)
Frequency (Hz)
60
55
50
45
40
35
30
25
20
15
10
5
40
30
25
20
8
0
0
0.015 0.025 0.035 0.045 0.055
Time (s)
0
×10
2
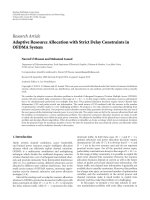
Figure 4: Frequency scalogram of square wavelet coefficient of the
reference gear unit.
only, representing one whole rotation of the gear (of a pinion
with a crack), which took 50 ms.
No particularities, which would denote local changes, can
be observed from the figures, in the frequency scalogram,
when it comes to the faultless gear. This applies both for
a normal representation (Figure 3)ofwaveletcoefficients
and for a square representation (Figure 4)ofwaveletcoef-
ficients. When it comes to normal representation of wavelet
coefficients (Figure 3), the resolution is much better in the
lower frequency area; the reaction of each single tooth at
the frequency of 380 Hz is expressed there. A minimum
local change in wavelet coefficients, at 11 ms, can be noticed
in the signal caused by a gear with a crack in frequency
scalograms with square representation (Figure 5). In normal
representation of wavelet coefficients, it is not possible
to define the changes (Figure 6). For those techniques, a
reference signal was used.
To carry out next comparisons, the standard denoising
method is used in concern to actual data (Figures 7 and 8)
related to practical signal presented. Different thresholds
6 EURASIP Journal on Advances in Signal Processing
40
30
25
20
8
0
Acceleration (m/s
2
)
60
55
50
45
40
35
30
25
20
15
10
5
0
Frequency (Hz)
0 0.015 0.025 0.035 0.045 0.055
Time (s)
×10
2
Figure 5: Frequency scalogram of wavelet coefficient of the gear
unit with a gear with a crack in a tooth root.
40
30
25
20
8
0
Acceleration (m/s
2
)
60
55
50
45
40
35
30
25
20
15
10
5
0
Frequency (Hz)
0 0.015 0.025 0.035 0.045 0.055
Time (s)
×10
2
Figure 6: Frequency scalogram of square wavelet coefficient of the
gear unit with a gear with a crack in a tooth root.
are used for this method. The signal de-noised by means
of Stein’s Unbiased Risk Estimation (SURE), Hybrid or
heuristic SURE, minimax thresholds, and universal thresh-
old, respectively, is presented in Figures 9, 10, 11,and
12. SURE threshold is associated with a quadratic loss
function. An estimate of the risk is given for a particular
threshold value. Minimizing the r isks yields threshold value
selection. Hybrid represents a heuristic variant of the SURE
threshold. A fixed threshold is applied for minimax, it gives
minimax performance for mean square error. The minimax
principle is applied in statistics in relation to estimators. It
is possible to assimilate the de-noised signal to the estimator
of the unknown regression function, therefore, the minimax
estimator realizes the minimum of the maximum mean
square error for the worst func tion in a certain set. Signal
length and noise standard deviation determine universal
threshold.
It is evident from denoising results, after having used
four different threshold strategies, that no strategy has
presented the original signal with one impulse belonging
40
20
0
−40
−20
0 0.005 0.01
0.015
0.02 0.025 0.03 0.035 0.04 0.045 0.05
Time (s)
Acceleration
(m/s
2
)
Figure 7: Measured signal of vibrations of a faultless gear unit.
40
20
−40
−20
0
0 0.005 0.01 0.015 0.02 0.025 0.03 0.035 0.04 0.045 0.05
Time (s)
Acceleration
(m/s
2
)
Figure 8: Measured signal of vibrations of a gear with a pinion with
acrack.
Acceleration
(m/s
2
)
40
20
−40
−20
0
0 0.005 0.01 0.015 0.02 0.025 0.03 0.035 0.04 0.045 0.05
Time (s)
Figure 9: De-noised signal of vibrations of a gear with a pinion with
a crack with SURE threshold.
Time (s)
30
10
−10
−30
0 0.005 0.01 0.015 0.02 0.025 0.03 0.035 0.04 0.045 0.05
Acceleration
(m/s
2
)
Figure 10: De-noised signal of vibrations of a gear with a pinion
with a crack with Hybrid threshold.
0 0.005 0.01 0.015 0.02 0.025 0.03 0.035 0.04 0.045 0.05
Time (s)
30
10
−10
−30
Acceleration
(m/s
2
)
Figure 11: De-noised signal of vibrations of a gear with a pinion
with a crack with Minimax threshold.
30
10
−10
−30
0
0.005 0.01 0.015 0.02 0.025 0.03 0.035 0.04 0.045 0.05
Time (s)
Acceleration
(m/s
2
)
Figure 12: De-noised signal of vibrations of a gear with a pinion
with a crack with Universal threshold.
EURASIP Journal on Advances in Signal Processing 7
Entropy
14
12
13
11
0
10
9
8
7
6
5
12345
β
Figure 13: Graph of the parameter β and Renyi Entropy.
to the crack in the tooth root. Also other factors have
impact upon effectiveness of denoising. These factors include
wavelet decomposition level and threshold rescaling method
selection.
4.2. Results Analysis Concerning Practical Signals. Morlet
wavelet was used to obtain the adaptive wavelet filter. The
graph of the parameter β and Renyi entropy relationship
is presented in Figure 13. The entropy is very sensitive to
the value β.Letparameterβ varyfrom0.1to5witha
step size of 0.1. The minimal value of Renyi entropy is
the optimal selection of β. When β
= 0.9, the minimum
value of entropy is 5.85, as shown in Figure 13.Asa
denoising method, the Morlet wavelet is used. Equation (14)
with α
= 0.1 can be used to approximate the impulse
probability density function. For each scale, MAD/0.6745 is
used as the noise deviation estimator. For Morlet wavelet, the
same parameters are applied as described before. Measured
signals of vibrations of a faultless gear and of vibrations
of a gear with a crack in the tooth root are presented
in Figures 7 and 8. Figure 14 shows denoising signals of a
faultless gear. It can be noted that no impulses exist in
the signals, whereas Figure 15 shows results of filtering with
optimized wavelet filter for signals of a gear with a crack; in
these signals it is possible to observe impulses at 11 ms also
after the noise has been removed.
The signal length is 50 ms, representing one rotation
of the pinion. 19 teeth are along the circumference. The
increased amplitude is located at 11 ms and belongs to the
fourth tooth in the direction of rotation from the reference
positional point of the gear unit.
5. Conclusion
By means of adaptive wavelet transform it is possible both
to define changes and to establish the presence of a damage
or fault, at the level of an individual tooth. Adaptive wavelet
denoising methods are very useful to determine local changes
in gears. Wavelets optimised by means of the Renyi entropy
6
2
−2
−6
0 0.005 0.01 0.015 0.02 0.025 0.03 0.035 0.04 0.045 0.05
Time (s)
Acceleration
(m/s
2
)
Figure 14: With Morlet wavelet de-noised signal of vibrations of a
faultless gear unit.
Acceleration
(m/s
2
)
6
2
−2
−6
0 0.005 0.01 0.015 0.02 0.025 0.03 0.035 0.04 0.045 0.05
Time (s)
Figure 15: With Morlet wavelet de-noised signal of vibrations of a
gear with a pinion with a crack.
match impulses very well. Consequently, it is possible to
define impulses hidden in noise signals by means of the
wavelet transform. The maximum likelihood estimation
threshold rule and prior information on the probability
density function of the signals to be identified are used.
On the basis of this method, impulses were extracted from
practical engineering signals; the results of this procedure are
very reliable.
When it comes to life cycle design, the actual condition
of a device and of its vital component parts, which influences
the operational capability significantly, can be observed. It
is beyond doubt that the reliability of operation control is
significantly improved with in-time detection of f aults and
damages. If faults are detected in a very reliable way, this
leads to a better prediction of the remaining life cycle of a
gear unit.
References
[1]S.A.AdewusiandB.O.Al-Bedoor,“Waveletanalysisof
vibration signals of an overhang rotor with a propagating
transverse crack,” Journal of Sound and Vibration, vol. 246, no.
5, pp. 777–793, 2001.
[2] A. G. Bruce, D. L. Donoho, et al., “Smoothing and robust
wavelet analysis,” in Proceedings of the Computational Statistics
11th Symposium, pp. 531–547, Vienna, Austria, 1994.
[3] J. I. Taylor, The Vibration Analysis Handbook,Vibration
Consultans, 1994.
[4] S. J. Derrek, Gear Noise and Vibration, Marcel Dekker, New
York, NY, USA, 1999.
[5] V. C. Chen and H. Ling, Time-Frequency Transforms,Artech
House Publishers, Boston, Mass, USA, 2002.
[6] S. Mallat, A Wavelet Tour of Signal Processing, Academic Press,
San Diego, Calif, USA, 1999.
[7] D. L. Donoho, “De-noising by soft-thresholding,” IEEE Trans-
actions on Information Theory, vol. 41, no. 3, pp. 613–627,
1995.
[8] D. L. Donoho and I. M. Johnstone, “Ideal spatial adaptation
by wavelet shrinkage,” Biometrika, vol. 81, no. 3, pp. 425–455,
1994.
8 EURASIP Journal on Advances in Signal Processing
[9] A. Belsak, Time-frequency analysis of the condition of gear units
(Abstract in English), Doctoral T hesis, Faculty of Mechanical
Engineering, University of Maribor, Slovenia, 2006.
[10] M. Nannone and F. C. Morabito, “Enhanced automatic
artefact detection based on independent componenet analysis
and Renyi entropy,” Neural Networks, vol. 21, pp. 1029–1040,
2008.
[11] B. Tao, L. Zhu, H. Ding, and Y. Xiong, “R
´
enyi entropy-
based generalized statistical moments for early fatigue defect
detection of rolling-element bearing,” Proceedings of the
Institution of Mechanical Engineers, vol. 221, no. 1, pp. 67–79,
2007.
[12] H. Qiu, J. Lee, J. Lin, and G. Yu, “Wavelet filter-based weak
signature detection method and its application on rolling
element bearing prognostics,” Journal of Sound and Vibration,
vol. 289, no. 4-5, pp. 1066–1090, 2006.
[13] G. Strang and T. Nguyen, Wavelets and Filter Banks,Wellesley-
Cambridge Press, Boston, Mass, USA, 1996.
[14] R. Coifman, G. Be ylkin, and V. Rokhlin, “Fast wavelet trans-
forms and numerical algorithms,” Journal of Communication
on Pure and Applied Mathematics, vol. 44, pp. 141–183, 1991.
[15] D. Boulahbal, M. F. Golnaraghi, and F. Ismail, “Amplitude
and phase wavelet maps for the detection of cracks in geared
systems,” Mechanical Systems and Signal Processing, vol. 13, no.
3, pp. 423–436, 1999.
[16] M. J. Shensa, “The discrete wavelet transform: wedding the
atrous and Mallat algorithms,” IEEE Transactions on Signal
Processing, vol. 40, no. 10, pp. 2464–2482, 1992.
[17] M. R. McClure and L. Carin, “Matching pursuits with a wave-
based dictionary,” IEEE Transactions on Signal Processing, vol.
45, no. 12, pp. 2912–2927, 1997.
[18] W. J. Wang, “Wavelets for detecting mechanical faults with
high sensitivity,” Mechanical Systems and Signal Processing, vol.
15, no. 4, pp. 685–696, 2001.
[19] O. Faust, R. Acharya, S. M. Krishnan, and L. C. Min,
“Analysis of cardiac signals using spatial filling index and
time-frequency domain,” BioMedical Engineering Online, vol.
3, article no. 30, 2004.
[20] A. Hyv
¨
arinen, “Sparse code shrinkage: denoising of non-
gaussian data by maximum likelihood estimation,” Neural
Computation, vol. 11, no. 7, pp. 1739–1768, 1999.
[21] A. Belsak and J. Flasker, “Detecting cracks in the tooth root of
gears,” Engineering Failure Analysis, vol. 14, no. 8, pp. 1466–
1475, 2007.