báo cáo hóa học:" Biorefinery process for protein extraction from oriental mustard (Brassica juncea (L.) Czern.) using ethanol stillage" docx
Bạn đang xem bản rút gọn của tài liệu. Xem và tải ngay bản đầy đủ của tài liệu tại đây (262.82 KB, 9 trang )
ORIGINAL Open Access
Biorefinery process for protein extraction from
oriental mustard (Brassica juncea (L.) Czern.) using
ethanol stillage
Kornsulee Ratanapariyanuch
1
, Robert T Tyler
1
, Youn Young Shim
2*
and Martin JT Reaney
2*
Abstract
Large volumes of treated process water are required for protein extraction. Evaporation of this water contributes
greatly to the energy consumed in enriching protein products. Thin stillage remaining from ethanol production is
available in large volumes and may be suitable for extracting pro tein rich materials. In this work protein was
extracted from ground defatted oriental mustard (Brassica juncea (L.) Czern.) meal using thin stillage. Protein
extraction efficiency was studied at pHs between 7.6 and 10.4 and salt concentrations between 3.4 × 10
-2
and 1.2
M. The optimum extraction efficiency was pH 10.0 and 1.0 M NaCl. Napin and cruciferin were the most prevalent
proteins in the isolate. The isolate exhibited high in vitro digestibility (74.9 ± 0.80%) and lysine content (5.2 ± 0.2 g/
100 g of protein). No differences in the efficiency of extraction, SDS-PAGE profile, digestibility, lysine availability, or
amino acid composition were observed between protein extracted with thin stillage and that extracted with NaCl
solution. The use of thin stillage, in lieu of water, for protein extraction would decrease the energy requirements
and waste disposal costs of the protein isolation and biofuel production processes.
Keywords: Biorefinery, Protein extraction, Thin stillage Mustard, Salt concentration, Ethanol
Introduction
Brassica spp. oilseeds are grown throughout the world
as sources of vegetable oil and p rotein-rich animal feed
(Henriksen et al. 2009,). According to statistical data
from the Canada Grains Council (2011),, the average
annual production of Canadian canola over the period
2001-2010 was 9.2 million tonnes, and the Canadian oil-
seed crushing in dustry produced an average of 2.1 mil-
lion tonnes of canola meal annually between 2001-2010.
Commercial oilseed extraction may include solvent
extraction, mechanical expeller-press extraction, or com-
binations of mechanical and solvent extraction to pro-
duce oil and meal. Canola meal is the portion remaining
after extraction of oil from canola seed and it is widely
used as a protein source in poultry, swine, beef, and
dairy cattle feeds because of its exc ellent amino acid
profile (Hickling 2011).
Thin stillage (TS) is a dilute stream of organic and
inorganic compounds produced as a coproduct of the
ethanol industry. Usually, TS is processed by dry ing
than added to distillers dried grains (DDG) to produce
DDG with solubles (DDGS). The latter is used in animal
feeds. In the manufacture of DDGS, TS is first concen-
trated into syrup before mixing with wet distillers grains.
TS drying consumes about 40-45% of the thermal
energy and 30-40% of the electrical energy utilized in a
dry-grind facility (Wilkin s et al. 2006,). The e nergy
required to evaporate the large amount of water
entrained in TS is a major cost in the ethanol industry
and contributes to the poor lifecycle assessment of etha-
nol production (Bremer et al. 2010). To overcome the
losses in energy for this process several strategies have
been proposed including feeding wet distiller’sgrains
with solubles. This has the advantage of decreasing the
cost of drying but necessitates transporting water with
the feed product to the animals. In additio n the wet
products may not be suited for storage.
Production of protein isolates is equally inefficient. For
examples,Newkirketal.(2006),discloseamultistage
* Correspondence: ;
2
Department of Plant Sciences, University of Saskatchewan, 51 Campus
Drive, Saskatoon, SK S7N 5A8, Canada
Full list of author information is available at the end of the article
Ratanapariyanuch et al. AMB Express 2012, 2:5
/>© 2012 Ratanapariyanuc h et al; licensee Springer. T his is an Open Access article distributed un der the terms of the Creative Commons
Attribution License ( .0), which permits unrestricted use, distribution, and reproduction in
any medium, provid ed the original work is properly cited.
protein extraction and recovery process using water and
CaO to adjust pH; Diosady et al. (1989), extracted 100 g
of rapeseed meal with 1,800 g of water; and Murray
(1998) extracted 50 kg of commercial canola me al with
500 L of water. In all of these extractions the percent of
protein concentrate recovered to water used in extrac-
tion and processing is less than 3%. Therefore, the con-
sumption of large volumes o f water, and its subsequent
remed iation are costly barriers to th e economic produc-
tion of protein concentrates and isolates.
If the ethanol, oilseed, and protein processing plants
are in close physically proximity, TS from the ethanol
production plant could be used directly as process water
by the protein processing facil ity. The ethanol producer
would avoid the costs of evaporating and drying or
treating TS. The protein producer would not have to
purchase water for the process and would reduce the
energy costs to heat the water for p rotein extraction.
The oilseed processor would provide defatted meal as
raw material for protein extraction, and in the case of
an oilseed plant that also produces biodiesel, alkaline
glycerol, a byproduct from biodiesel plants, could be
used for pH adjustment in the protein extraction pro-
cess. Thus, the e thanol, biodiesel and protein processes
would benefit.
In a previous study (Ratanapariyanuch et al. 2011), we
thoroughly characterized TS to determine the presence
of compounds that might affect protein extraction. The
use of TS for protein extraction from canola or mustard
meal ha s not been reported previously . However, a s
described above, the use of TS might offer several advan-
tages in the extraction of protein from oilseed meal.
Materials and methods
Materials, chemicals and reagents
Oriental mustard seed cultivar (B. juncea (L.) Czern. cv.
AC Vulcan) seed was obtained from Agriculture and
Agri-Food Canada, Saskatoon Research Centre (Saska-
toon, SK, Canada). All seed was from the 2006 harvest
and was grown on plots near Saskatoon. Pound-Maker
Agventures Ltd. (Lanigan, SK, Canada) provided TS
from wheat. Samples of TS were stored at 4°C for up to
4 months until used. TS samples were centrifuged at
1050 × g for 20 min at 4°C (Model Avanti
®
J-E, Beck-
man Coulter Canada Inc., Mississauga, ON, Canada).
Glycerol containing approxima tely 10% KOH was pro-
vided by an industrial biodiesel processor (Milligan Bio-
technology Inc., Foam Lake, SK, Canada). Reagents and
chemicals, unless otherwise noted, were pur chased from
Sigma-Aldrich (St. Louis, MO, USA).
Defatted meal preparation
Mustard seed was extracted mechanically using a con-
tinuous screw expeller (Komet, Type CA59 C; IBG
Monforts Oekotec GmbH & Co. KG, Mönchengladbach,
Germany) with a 6 mm choke and operating with a
screw speed of 93 rpm. Oil remaining in the press-cake
was removed using hexane as a solvent (Milanova et al.
2006,; Oomah et al. 2006) and the residual hexane in
the defatted meal was removed in a fume hood
overnight.
Protein content
Protein content of mustard seed and fractions were
determined by the Kjeldahl method as modified by
AOAC method 981.10 (AOAC 19 90). Mustard seed and
defatted meal samples (0.5 g) were digested b y heating
with concentrated H
2
SO
4
in a heating/digestion block
using a package of Kjeldahl digestion mixture 200
(VWR Scientific, Mississauga, ON, Canada) as a catalyst.
After digestion, samples were distilled using a steam dis-
tillation unit (Büchi Analytical Inc., New Castle, DE,
USA) with 30% (w/v) NaOH. Boric acid (4%) was used
to trap ammonia from the distillation. The distillate was
titrated with 0.2 N HCl using an N-Point indicator
(Titristar N point indicator, EMD Chemicals Inc.,
Gibbstown, NJ, USA). Nitrogen concentration (N in %)
was used to estimate protein concentration (%) by
means of a nitrogen-to-protein conversion factor 5.7
(Sosulski et al. 1990,) for TS and 5.5 (Lindeboom and
Wanasundara 2007) for mustard seed, meal, and protein.
Oil content
The oil content was determined using a Goldfisch
Extractor (Model 22166B, Labconco Corp., Kansas City,
MO, U SA) according to AOAC method 960.39 (AOAC
1990). Samples (20 g) were ground for 30 s in a coffee
grinder to pass through a 1 mm screen. A portion of
thegroundsample(3g)wasweighedonafilterpaper
(Whatman No. 4), which was t hen folded. The samples
were placed in cellulose thimbles (25 mm × 80 mm,
Ahlstrom AT, Holly Spring, PA, USA) and extracted for
6 h with hexane (50 ml). The hexane was distilled from
the oil extraction beakers, after which the beakers were
heated at low temperatures (30-40°C) using a hot plate
placed in a fume hood. The beakers were then trans-
ferred to an oven (105°C) for 30 min and then allowed
to cool to room temperature (25°C) in a desiccator.
Moisture content
The moisture content of mustard seed and defatted
meal was determined according to AOAC method
950.46 (AOAC 1990) using a Mettler Toledo halogen
moisture analyzer (Model HB43, Columbus, OH, USA),
which employed a quartz heater to dry samples of mate-
rial (1.0 g) at 105°C until the mass varied less than ±
0.001 g over a 30 s. The samples were allowed to cool
to room temperature in a desiccator for at least 1 h
Ratanapariyanuch et al. AMB Express 2012, 2:5
/>Page 2 of 9
before w eighing. Selected samples were frozen at -20°C
and lyophilized for 48 h.
The effects of pH and salt on protein extraction
The amount of liquid used for protein extraction may
determine both extraction efficiency and economics. A
1:30 ratio of defatted meal to solvent , and an extraction
time of 120 min were utilized in this study, as recom-
mended by Diosady et al. (2005). To avoid protein preci-
pitation and achieve the maximum protein extraction, it
is important to avoid pH near the isoelectric point of
protein. Based on the literature, the isoelectric precipita-
tion of B. juncea protein has been found to occur at
approximately pH 6.0 (Moure et al. 2006). Therefore,
alkaline conditions (pH > 7.0) were chosen to study pro-
tein extraction. Ground defatted meal (5.0 g) was mixed
with 150 ml of centrifuged TS. The pH of the system
was adjusted to pH 7.6-10.4 using alkaline gly cerol from
a biodiesel plant (~10% KOH) or 1.0 N HCl. NaCl was
used to adjust the ionic strength of the centrifuged TS.
The concentrations of NaCl ranged from 3.4 × 10
-2
M
to 1.2 M. The pH and salt concentrations employed are
provided in Table 1.
The mustard meal-TS mixture was stirred continu-
ously for 2 h at room tem perature (25°C). After stirring,
the solution was centrifuged at 10,000 rpm f or 10 min
at 4°C to remove suspended solids. The supernatant was
freeze-dried, after which the protein content of the
freeze-dried protein of the undissolved solids were ana-
lyzed. The moisture content of the undissolved solids
was also determined. The conditions that provided the
maximum protein extraction efficiency in this study
(NaCl concentration of 1.0 M and pH 10.0) were used
in subsequent studies of the effect s of TS constit uents
on protein extraction e fficiency. A control extraction
with an alkaline NaCl solution (1.0 M NaCl in deionized
water, pH 10.0), hereafter termed NaCl solution, was
conducted. The quality of the protein products from the
control and TS extractions was compared.
Thin stillage composition
The composition of TS was characterized according to
Ratanapariyanuch et al. (2011). Nuclear magnetic
resonance and high-performance liquid chromatography
(HPLC) were utilized to determine the content o f
organic compounds including ion chromatography and
inductive ly coupled plasma mass spectroscopy (ICP-MS)
provided a detailed analysis of inorganic constituents.
Protein extraction efficiency
Protein was removed fr om TS via ultrafiltration prior to
its use for protein extraction from mustard meal. Cen-
trifuged TS was filtered through a 3,000 MWCO regen-
erated cellulose membrane (Millipore Corp., Bedford,
MA, USA) using a stirred ultrafiltration cell (Millipore
Corp., Bedford, MA, USA), running at 55 psi with a
shear rate of 200 rpm. A solution of NaCl (1.0 M and a
pH of 10.0) was selected to obtain the highest protein
extraction efficiency (based on results from the previous
experiment above). Protein was extracted as described
above. The supernatant from the centrifuged protein
solution was dialyzed using Spectra/Por molecular-por-
ous membrane tubing (3,500 MWCO, Spectrum Labora-
tories Inc., Rancho Dominguez, CA, USA) at a
supernatant to deionized distilled water ratio of 1:1,000.
Water exchange with fresh deionised water was repeated
three times a day until the conductivity of permeate
water was equal to that of deionise d distilled water after
8 h of dialysis. The protein solution obtained by dialysis
was freeze-dried. Freeze-dr ied protein and undissolved
solids were analyzed for protein content, and the moist-
ure content of undissolved solids was also determined.
Protein products from TS and NaCl extraction were
pooled according to extraction solution type, and then
analyzed to determine the molecular weight, peptide
sequence, amino acid composition, digestibility, and
lysine availability of the proteins.
Molecular weight
Molecular weights of the extracted proteins were deter-
mined by electrophoresis separation using sodium dode-
cyl sulfate-polyacrylamide gel electrophoresis (SDS-
PAGE) (Laemmli, 1970). Ten micrograms of protein
from TS or NaCl extracti on and 5.0 μgofSeeBlue
®
Plus2 Pre-Stained Standard (Invitrogen, Carlsbad, CA,
USA) with a range of 4-250 kDa were applied onto 8.6
cm × 6.8 cm Ready Gels (Tris-HCl 4-15%, 10 wells, Bio-
Rad Laboratories, Hercules, CA, USA). Each of the pro-
teins products was mixed at a 1:1 ratio with loading buf-
fer (1.0 M Tris-HCl, pH 6.8, containing 20% glycerol,
10% SDS, 0.4% bromophenol blue), and heated on a
Gene Amp PCR System 9700 (Applied Biosystems, Fos-
terCity,CA,USA)at95°Cfor5min.TheMini-PRO-
TEAN 3 cell (Bio-Rad Laboratories, Hercules, CA, USA)
was filled with running buffer (Tris base 3.028 g/l, gly-
cine 14.414 g/l, SDS 1.0 g/l) adjusted pH to 8.3, and
electrophoresis was performed for 30 min at 50 V. The
Table 1 Coded values of independent variables used to
study the effect of pH and salt (NaCl) concentration on
protein extraction efficiency
Independent variable Code level
a
-1.414 -1.0 0.0 1.0 1.414
pH 7.6 8.0 9.0 10.0 10.4
Salt concentration (M) 0.034 0.2 0.6 1.0 1.2
a
All levels of each factor were chosen based on a central composite rotatable
design.
Ratanapariyanuch et al. AMB Express 2012, 2:5
/>Page 3 of 9
voltage was then increased to 100 V for 70 min. After
electrophores is, the gels were stained with 0.1% of Coo-
massie Brilliant Blue R-250 (Sigma, St. Louis, MO, USA)
mixed with 40% methanol and 10% acetic acid. Subse-
quently the stained gels were destained with 40% metha-
nol and 10% acetic acid to remove the background.
Peptide mass fingerprinting
Each of the stained protein containing bands observed
in the electrophoresis gel was excised from reference
gels for identification by matrix-assisted laser desorption
ionization time-of-flight mass spectrometry (MALDI-
TOFMS)accordingtothemethodofAlukoetal.
(2004). After MALDI-TOF analysis of tryptic peptides,
mass tags were searched against the mustard UniGene
database using the MS-FIT program of Protein Prospec-
tor (University of California, San Francisco, CA, USA)
with a utocatalytic trypsin fragments as internal calibra-
tion standards. All searches were performed against the
National Center for Biotechnolo gy Information (NCBI)
mustard UniGene database.
Amino acid composition
The amino acid profiles of extracted proteins were
determined using the method of Llames and Fontaine
(1994). Performic acid and HCl were used to oxidize
and hydrolyze the proteins, respectively. Hydrolysates
were analyzed for amino acids using an analytical ion
exchan ge column (AA911, Transgenomics Inc., Omaha,
NE, USA) and post column derivitization with ortho-
phthaldialdehyde (OPA). An Agilent 1100 series HPLC
system (Agilent Technologies, Waldbronn, Germany)
and fluorescence detector (RF-551, Shimadzu Scientific
Instruments, Columbia, MD, USA) were employed.
Amino acids were quantified with the i nternal standard
method of measuring the absorption of reaction pro-
ducts with ninhydrin at 570 nm. Tryptophan was deter-
mined by HPLC with fluorescence detection (extinction
280 nm, emi ssion 356 nm) after alkaline hydrolysis with
barium hydroxide o ctahydrate for 20 h at 110°C (Eur-
opean Commission 2000,). Tyrosine was not deter-
mined. Supplemented amino acid was determined by
extraction with 0.1 N HCl (European Commission
1998).
In vitro digestibility
The digestibility of extracted protein was determined
using the multi-enzyme technique of Hsu et al. (1977).
Lyophilized protein samples extracted with TS and NaCl
solution were dissolved in deionized water (6.25 mg pro-
tein/ml). The protein solutions (25 m l) were adjusted to
pH 8.0 with 0.1 N HC l or NaOH, while stirring at 37°C
in a water bath. The multi-enzyme solution (1.6 mg/ml
trypsin, 3.1 mg/ml chymotrypsin, and 1.3 mg/ml
peptidase) was prepared in water adjusted to pH 8.0 and
stored in an ice bath. Digestions were conducted by
adding the multi-enzyme solution (2.5 ml) to 25 ml of
protein solution while stirring at 37°C. The pH of the
protein solution was recorded over a 10 min period
using a recording pH meter. The percent protein digest-
ibility was calculated by the following eq 1:
Digestibility (%) = 210.46 − 18.10X
(1)
X is the pH at 10 min. The enzyme blank was run in
0.001 M phosphate buffer, pH 8.0.
Lysine availability
Lysine availability of extracted protein was measured
using a fluorometric technique (Ferrer et al. 2003). A
reconstituted protein sample (50 μl) containing 0.3-1.5
mg of protein was mixed with deionized water (950 μl),
and then 1 ml of SDS solution (120 g/l) was added. An
OPA solution was prepared by combining 80 mg O PA
in 2 ml 100% ethanol, 50 ml sodium tetraborate buffer
(pH 9.7-10.0), 5 ml SDS (200 g/l), and 0.2 ml b-mercap-
toethanol. OPA solution (3 ml) was added to 100 μlof
the reconstituted protein solution. The mixture was
incubated for 2 min at 25°C while shaking. Fluorescence
was measured between 2 and 25 min at 455 nm (Pi-Star
180 CD spectrophotometer, Applied Photophysics Ltd.,
Leatherhead, U.K.). The absorbance value of the protei n
sample was corrected by the absorbance of a blank and
the absorbance of the interference. The blank mixture
(1 ml of SDS solution, 120 g/l, and 1 ml of deionized
distilled water) was incubated at 4°C for 12 h, after
which it was sonicated (Branson 3200R-1, Sonic ator,
Branson Cleaning Equipment Company, Danbury, CT,
USA) for 15 min at 25°C. Interference in the determina-
tion stems from small peptides, free amino acids, and
amines. In order to determine the interference, trichlor-
oacetic acid (TCA) was added to precipitate protein in
the sample solution (2 ml of 10% (w/v) TCA and 2 ml
of protein extract), which was then centrifuged at 827g
(Allegra X-22R Centrifuge, Beckman Coulter Canada
Inc., Mississauga, ON, Canada). Blank controls were
prepared by combining 900 μlofdeionizedwater,1ml
of S DS solution ( 120 g/l), and 100 μl of supernatant. A
calibration curve was prepared using a mixture of casein
from bovine milk at concentrati ons ranging from 0.1 to
2.0 mg/ml (lysine contents of 8.48 × 10
-3
to 0.169 mg
lysine/ml) dissolved in 0.1 M sodium tetraborate buffer
(pH 9.0).
Color
The color of extracted protein was determined using a
HunterLab system (Color Flex, Hunter Associates
Laboratory Inc., Reston, VA, USA). The illuminator
Ratanapariyanuch et al. AMB Express 2012, 2:5
/>Page 4 of 9
condit ion was set at D65 (daylight), and the observer at
10°. In the Hunter scale, ‘L’ measures lightness and var-
ies fro m 100 for white to zero for black. The chromati-
city value ‘a’ measures redness when positive, gray when
zero, and greenness when negative. The ‘ b’ value mea-
sures yellowness when positive, gray when zero, and
blueness when negative. The colorimeter was calibrated
with standard black and white calibration tiles provided
with the instrument b efore measuring the colors of TS
and NaCl solution.
Large-scale protein extraction
The ratio of ground defatted meal to TS was increased
to 1:5 to simulate a more practical industrial process.
Ground defatted meal (180 g) was mixed with centri-
fuged TS (900 ml) having a NaCl concentration of 1.0
M. The pH was adjusted and protein extracted as
described previously. The supernatant from protein
extract centrifugation was dialyzed using Spectra/Por
molecular p orous membrane tubing (Spectrum Labora-
tories Inc., Rancho Dominguez, CA, USA), 6,000-8,000
MWCO, at a ratio of 1:20 supernatant to deionized
water. The meal was extracted twice more with 900 ml
of centrifuged TS for 2 h per extraction (1:5, meal: cen-
trifuged stillage ratio). The supernatant from each
extraction was dialyzed as described above. Water
exchange with fresh deionized water was repeated until
the conductivity of the permeate water was equal to that
of deionized w ater after 8 h of dialysis. The three dia-
lyzed protein extracts were combined and sub-sampled,
and the sub-samples were lyophilized and subsequently
analyzed for protein content.
Comparison of protein extraction efficiency with that of a
published protocol
Using the protocol of Milanova et al. (2006), ground
defatted meal (20 g) was mixed with 200 ml of 0.6 M
NaCl solution. The pH of the mixture was adjusted to
6.8 with a 0.1 N HCl solution, stirred continuously for
30minat25°Candthencentrifugedat10,000rpmfor
10 min. The supernatant was filtered using a stirred cell
with a 3,000 MWCO membrane until the volume of
protein solution was 10 ml. Subsequently, the protein
solution was diafiltered (3,000 MWCO) using 500 ml of
0.6 M NaCl solu tion at pH 6.0, until the volume of the
solution was 20 ml. The concentrated protein and salt
solution (20 ml) was then diluted 15-fold (to 300 ml)
with chilled water (4°C) to form a discrete protein
(micelle) in the aqueous phase. The protein micelle was
allowedtosettletoformanamorphous,gelatinous
mass. The protein mass was centrifuged at 10,000 rpm
for 10 min to separate protein particles from the liquid.
The p rotein sediment was lyophilized and subsequently
analyzed for nitrogen content using the Kjeldahl
method.
Statistical analysis
All measurements were undertaken in triplicate. T he
efficiency of protein extraction was determined using a
response surface methodology (RSM). Five levels of each
factor (pH and salt concentration) were chosen based
on a central composite rotatable design (CCRD) (Table
1) (Kuehl 2000).
Results
Composition of B. juncea mustard seed and defatted meal
The protein, oil, and moisture contents of whole mus-
tard seed were 22.1 ± 0.1, 38.7 ± 0.2, and 4.8 ± 0.1%,
respectively. For defatted meal, the protein, oil, and
moisture contents were 32.3 ± 0.2, 4.1 ± 0.1, and 6.3 ±
0.1%, respectively.
The effect of pH and salt on protein extraction
Both salt concentration and pH affect protei n solubility.
The effect of these two variables on the efficiency of
protein extraction was studied in order to determine the
optimum conditions for protein extraction from mus-
tard meal. Maximum protein extraction efficiency was
achieved at the highest pH and NaCl concentration
employed (10.4 and 1.2 M, respectively) (Table 1).
Protein extraction using thin stillage and sodium chloride
solution
Efficiency of protein extraction
The efficiency of protein extraction may be affected by
thepresenceofcompounds,suchasdivalentcations,
which are found in industrial TS (Ratanapariyanuch et
al. 2011) but not in the NaCl solution. TS used in this
study was first filtered with an ultrafiltration membrane
of 3,000 MWCO to remove large molecules such as
proteins and polysaccharides. The conditions that pro-
duced the highest protein extraction efficiency (pH 10.0,
NaCl concentration of 1.0 M) in preliminary experi-
ments were employed. The results did not show any sig-
nificant differences in the efficiency of protein
extraction obtained using TS (60.1 ± 4.4%) or NaCl
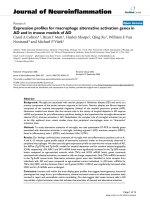
solution (56.3 ± 4.1%). The molecular weights of the
proteins extracted by TS and NaCl solution were deter-
mined by SDS-PAGE to be 14, 18-20, 20-22, 34, and 55
kDa (Figure 1).
Protein identification
The masses and peptide mass fingerprint of the peptides
are presented in Table 2. A number of abundant peaks
from singly-charged tryptic pept ides ranging from
973.49 to 2,088.19 m/z were observed. The results
showed that for n apin, only a 14 kDa peptide fragment
Ratanapariyanuch et al. AMB Express 2012, 2:5
/>Page 5 of 9
was observed. The masses obtained from the tryptic
digests matched predicte d digestion products. Specifi-
cally predicted tryptic digestion fragments [12 to 20
(EFQQAQHLR) and 100 to 109 (IYQTATHLPR)] were
matched with the sequence of B. juncea 1-E in the
database (Monsalve et al. 1993). Peptide fragments with
masses of 18-20, 20-22, 34, and 55 kDa were observed
that matched the predicted masses from tryptic diges-
tion of cruciferin. The protein peak appeared to consist
of a single protein purified to near-homogeneity as indi-
cated by both the MALDI-TOF MS data and SDS-
PAGE analysis (Table 2 and Figure 1).
Amino acid composition
The amino acid composition of protein extracted from
mustard meal using TS and NaCl solution was analyzed
by HPLC (Table 3). The differences in amino acid con-
tent among proteins extracted with TS and NaCl so lu-
tion were slight. The standard deviation of the valine
content of protein extracted with NaCl solution was
high, as the base line of the HPLC chromatogram was
not smooth. In proteins extracted by each of the two
solutions, glutamic acid an d methionine were present in
the highest and lowest concentrations, respectively. Of
the essential amino acids, leucine, and methionine were
present in the highest and lowest concentrations,
respectively.
In vitro digestibility
The protein products extracted with TS and NaCl solu-
tions had similar digestibility of 74.9 ± 0.8 and 74.5 ±
0.5%, respectively (Table 4). Alireza-Sadeghi et al. (2006)
found that the digestibility of defatted B. j uncea meal
and protein isolated from defatted B. juncea meal were
80.6 and 92.4%, respectively. The digestibility of protein
from this study was lower than reported by others pre-
viously (Table 4).
Lysine availability
The availabilities of lysine from protein product
extracted with TS and NaCl solution were similar at
43.0 ± 0.3% and 42.0 ± 0.4%, respectively (Table 4).
Color
The color of the protein product extracted with TS (L =
56.36 ± 0.08) was darker than that of protein extracted
with NaCl solution (L = 69.04 ± 0.07) (Table 5).
Figure 1 SDS-PAGE separation of protein extracted by
different methods. Lane A, thin stillage; lane B, NaCl solution; lane
M, broad range molecular marker.
Table 2 Amino acid sequences of tryptic peptide fragments of protein extracted from B. juncea using thin stillage
Subunit mass (kDa) Fragment sequence Calculated mass (m/z) Actual mass (m/z) Sequence assignment Position
14 EFQQAQQHLR 1155.58 1156.68 Allergen B. juncea 1-E 12-20
IYQTATHLPR 1198.64 1199.75 Allergen B. juncea 1-E 100-109
18-20 GLPLEVISNGYQISPQEAR 2070.07 2071.21 Cruciferin 338-386
20-22 GLPLEVISNGYQISLEEAR 2087.09 2088.19 Cruciferin 66-84
GLPLEVISNGYQISPQEAR 2070.07 2071.19 Cruciferin 368-386
34 CSGFAFER 972.41 973.49 Cruciferin 62-69
VQGQFGVIRPPLR 1465.85 1466.94 Cruciferin 251-263
IEVWDHHAPQLR 1499.76 1500.83 Cruciferin 50-61
55 GPFQVVRPPLR 1264.74 1265.79 Cruciferin 288-298
VQGQFGVIRPPLR 1465.85 1466.91 Cruciferin 251-263
IEVWDHHAPQLR 1499.76 1500.81 Cruciferin 50-61
GLPLEVISNGYQISPQEAR 2070.07 2071.13 Cruciferin 420-438
Ratanapariyanuch et al. AMB Express 2012, 2:5
/>Page 6 of 9
However, a (2.34 ± 0.01 - 3.45 ± 0.05) and b (19.33 ±
0.01 - 19.55 ± 0.05) values were similar in the two pro-
tein products.
Discussion
The composition of TS was reported separately (Ratana-
pariyanuch et al. 2011). In brief, stillage contained a
number of organic and inorganic constituents that con-
stituted a solution with about 3% dissolved matter. Our
original hypothesis was that some of the dissolved con-
stituents might either alter the efficiency of protein
extraction or affect the quality of the extracted protein.
Neither the efficiency of protein extraction nor the qual-
ity of protein was affected by the whole stillage. There-
fore, we did not have reported the effect of individual
components of the stillage on protein yield and quality.
In this study, the relative efficiencies of protein
extraction using TS and NaCl solution were used to
determine the effect of these solutions. In addition,
SDS-PAGE of extracted protein, amino acid sequences
of tryptic peptide fragments of extracted protein, digest-
ibility, and lysine availability of extracted protein were
compared for protein extracted using TS and NaCl
solution.
High pH an d salt concentrations are not necessarily
practical if they are not cost effective even if they
increase protein extraction efficiency. At alkaline pH,
most proteins have a net negative charge, which results
in strong intramolecular electrostatic repulsion. This
would cause swelling and unfolding of protein molecules
(Damodaran 1996,) and possible loss of functionality.
Similarly, when pH is above the isoelectric pH, protein
solubility increases. Typically, the maximum solubility of
protein occurs in alkaline solutio ns. Damodaran (1996),
notedthatwhenionicstrengthislow(NaCl
Table 3 Amino acid composition of protein extracted from B. juncea using thin stillage and NaCl solution.
Amino acid Thin stillage
a
NaCl solution
a
Protein isolated from B. juncea
b
FAO
c
Cysteine 5.3 ± 0.0 5.2 ± 0.2 2.9 ± 0.1 N
Asparagine 5.4 ± 0.2 6.0 ± 0.1 N
d
N
Methionine 2.2 ± 0.2 2.3 ± 0.0 2.7 ± 0.0 2.5
e
Threonine 3.1 ± 0.1 3.5 ± 0.2 4.3 ± 0.1 3.4
Serine 3.9 ± 0.1 4.2 ± 0.0 4.5 ± 0.0 N
Glutamic acid
f
22.2 ± 0.1 23.0 ± 0.2 20.8 ± 0.1 N
Glycine 4.6 ± 0.1 4.9 ± 0.1 5.2 ± 0.0 N
Alanine 3.9 ± 0.1 4.3 ± 0.1 4.4 ± 0.1 N
Valine 6.0 ± 0.2 3.0 ± 0.2 5.2 ± 0.1 3.5
Isoleucine 3.4 ± 0.0 3.8 ± 0.1 3.7 ± 0.1 2.8
Leucine 6.6 ± 0.1 7.5 ± 0.1 7.8 ± 0.0 6.6
Phenylalanine 3.6 ± 0.2 4.1 ± 0.4 4.5 ± 0.0 N
Histidine 4.5 ± 0.1 4.5 ± 0.1 2.8 ± 0.0 1.9
Lysine 5.2 ± 0.2 5.9 ± 0.3 4.9 ± 0.1 5.8
Arginine 7.0 ± 0.2 7.6 ± 0.1 10.0 ± 0.0 N
Tryptophan N N 1.5 ± 0.0 N
Tyrosine N N 2.3 ± 0.0 6.3
g
Aspartic acid N N 7.0 ± 0.1
h
N
Proline N N 5.6 ± 0.0 N
Data expressed as g/100 g of prote in are the mean ± standard deviations (SD) of three analyses.
a
1.0 M NaCl added.
b, c
From references (Alireza-Sadeghi et al. 2006,; FAO 2002).
d
N means no analysis.
e
Value for methionine + cysteine.
f
Value for glutamic acid + glutamine.
g
Value for tyrosine + phenylalanine.
h
Value for aspartic acid + asparagine.
Table 4 In vitro digestibility and lysine availability of
protein extracted from mustard meal using thin stillage
or NaCl solution
Constituent Thin stillage
a
NaCl solution
a
Digestibility (%) 74.9 ± 0.8 74.5 ± 0.5
Lysine availability
(g/kg of sample)
43.0 ± 0.3 42.0 ± 0.4
Values are the means of triplicate determinations with SD of a single sample.
a
1.0 M NaCl added.
Table 5 Color of protein extracted from mustard meal
using thins or NaCl solution
Color parameter Thin stillage
a
NaCl solution
a
L 56.36 ± 0.08 69.04 ± 0.07
a 3.45 ± 0.05 2.34 ± 0.01
b 19.33 ± 0.01 19.55 ± 0.05
Values are the means of triplicate determinations with SD of a single sample.
a
1.0 M NaCl added.
Ratanapariyanuch et al. AMB Express 2012, 2:5
/>Page 7 of 9
concentration < 0.5 M) the solubility of proteins that
contain polar surface domains typically increases. The
effects of pH and salt concentration demonstrated i n
this study are in agreement with the literature. Linde-
boom and Wanasundara (2007) extracted protein from
yellow mustard (Sinapis alba)usingwateratdifferent
pHs (3.5-10.0). They discovered that the protein content
of the extracts increased when the pH was above 7.5,
and was as high as 25 mg/ml at pH 10.0.
According to the molecular weights of the proteins
extracted by TS and NaCl solution (Figure 1), Aluko
and McIntosh (2001) reported that a 52 kDa polypeptide
was present in a purified 12S globulin storage protein
(cruciferin) from Brassica napus seed. Aluko et al.
(2004) stated that in S. alba protein isolates, a 2S albu-
min storage protein (napin) band appeared at 5 kDa and
cruciferin bands at 22, 28, and 35 kDa. Aluko and
McIntosh (2004), demonstrated that 12 and 13 kDa
polypeptides were subunits of the napin of mustard
seed. Shim and Wanasundara (2008) reported that a sin-
gle protein band of 14.5 kDa polypeptides were two
polypeptide chains of 4.5 and 10 kDa linked by disulfide
bonds. From the above information, it was concluded
that the bands found in SDS-PAGE were cruciferin and
napin, and that they could be extracted with either TS
or NaCl solution. These results were then confirmed by
peptide sequencing.
A combination of in-gel trypsin digestion of protein
separated by SDS-PAGE followed by MALDI-TOF MS of
the digests produced the masses used for searching pep-
tide-mass databases. Table 2 shows the search results,
which identifies peptide fragments of B. juncea.These
results are in agreement with those of Aluko and McIn-
tosh (2001),Aluko et al. (2004),Aluko and McIntosh
(2004),, and Shim and Wanasundara (2008),, as described
above. In addition, using fragment exact ma ss, the same
peptide sequences of cruciferin were separated into dif-
ferent bands by gel electrophoresis. This can be explained
by: (1) possible degradation of the extracted protein to
smaller molecules by enzyme, pH or hydrolysis during
processing and (2) the cruciferin present in rapeseed is a
memb er of the 12S globulins which are hexameric mole-
cules consisting of homologous but non-identical subu-
nits (Tandang et al. 2004). Surprisingly, no peptides
arising from yeast, bacteria o r wheat were found. Only
napin and cruciferin were identified in the extracted pro-
tein. These protei ns isolates are, there fore, similar to
those prepared from related Brassica species. The poten-
tial exists to process these isolates using hydrolytic
enzymes to produce bioactive peptides and antioxidants
that may be added to feed and food (Xue et al. 2009).
The amino acid composition is comparable to the
amino acid composition of proteins isolated from B.
juncea analyzed by Alireza-Sadeghi et al. (2006). I n
addition, the quantity of essential amino acids extracted
is sufficient to meet Food and Agriculture Organization
(FAO) standards (2002) (Table 3). Lysine is frequently
the factor limiting the protein quality of mixed diets for
human food and animal feed. When the total lysine con-
tent was compared with the available lysine content, it
was found that approximately 75% of the lysine in the
extracted protein would be available in feed. T hese
results agree with those of Larbier et al. (1991), who
found that lysine digestibility of whole rapeseed meal,
dehulled rapeseed meal, and soybean meal for co ckerels
were 80.1, 86.0, and 88.9%, respectively. The available
lysine values for chicks were 72.8, 78.3, and 85.5%,
respectively. The digestibility of the isolates produced in
this study was below that reported by Alireza-Sadeghi et
al. (2006). The higher reported digestibility may be the
result of charcoal adsorption treatment of the mustard
protein isolates that was used in that study.
The darker color of protein extracted with TS may be
due to the inclusion of colored compounds with the
protein o r reactions between compounds in the stillage
and protein to produce color. In addition, protein
extracted with TS could have absorbed colored materials
from the alkaline glycerol or TS. Therefore, the com-
pound present in T S may affect the other protein prop-
erties such as in vivo digestibility, which were not
examined in this study. Consequently, other quali ties of
the extracted protein should be tested in future studies.
The efficiency of protein extraction is affected by the
ratio of meal to solvent, where a higher ratio leads to
lower efficiencies. However, t he energy required to eva-
porate water from the protein solution in the final pro-
cessing step would ma ke the overall process inefficient at
low meal to solvent ratios. The ratio of ground defatted
meal:solvent (1:30, w/v) used in the preliminary experi-
ments would not be practical for industrial application,
thus the use of a higher ratio (1:5, w/v) was evaluated. As
expected, the results showed that when the meal: solvent
ratio used for protein extraction was increased from 1:30
to 1:5, protein extraction efficiency decreased from 80%
to 60%. The efficiency of the protein extraction process
developed in this study was compared with that of a pub-
lished protocol (Milanova et al. 2006). In the published
protocol, the cold-water treatment caused the protein to
salt out in micelle form. The percent recovery from the
protein micelle was only 7.6%. This protein recovery was
significantly lower than the 80% achieved with extrac-
tions at pH 10.0 and a NaCl concentration of 1.0 M. It
can be concluded that the process developed in this
research was more efficient in terms of protein extraction
than the published protocol.
In conclusions, a biorefinery process was developed that
linked coproducts of bio-ethanol and biodiesel production.
TS was used for protein extraction from defatted B. juncea
Ratanapariyanuch et al. AMB Express 2012, 2:5
/>Page 8 of 9
meal, a coproduct of biodiesel production from oilseed. In
addition, biodiesel plants can provide alkali to increase pH
and protein solubility. Therefore, ethanol, biodiesel, and
protein industries benefit from process integration. TS did
not affect the efficiency of protein extraction or nutritional
qualities of the protein extracts. The use of a byproduct,
TS, as a part of a protein extraction process would
increase the viability of the linked industrial processes.
The current work demonstrates that the protein products
of stillage-based e xtractions are of acceptable quality for
use in feeds.
Acknowledgements
The authors acknowledge the Saskatchewan Agriculture Development Fund
for funding this research. The authors thank Pound-Maker Agventures Ltd.
for TS samples, Milligan Biotechnology Inc. for glycerol from a biodiesel
process and the Saskatchewan Structural Sciences Centre, University of
Saskatchewan, for the use of equipment and technical assistances. The
authors also thank Brogden, D. M. (deceased) for HPLC analysis and Dr.
Olkowski, A. Department of Animal and Poultry Sciences, University of
Saskatchewan, for amino acid analysis.
Author details
1
Department of Food and Bioproduct Sciences, University of Saskatc hewan,
51 Campus Drive, Saskatoon, SK S7N 5A8, Canada
2
Department of Plant
Sciences, University of Saskatchewan, 51 Campus Drive, Saskatoon, SK S7N
5A8, Canada
Competing interests
The authors declare that they have no competing interests.
Received: 5 January 2012 Accepted: 12 January 2012
Published: 12 January 2012
References
Alireza-Sadeghi M, Appu-Rao AG, Bhagya S (2006) Evaluation of mustard (Brassica
juncea) protein isolate prepared by steam injection heating for reduction of
antinutritional factors. LWT-Food Sci Technol 39:911–917. doi:10.1016/j.
lwt.2005.06.012.
Aluko RE, McIntosh T (2001) Polypeptide profile and functional properties of
defatted meals and protein isolates of canola seeds. J Sci Food Agric
81:391–396. doi:10.1002/1097-0010(200103)81:43.0.CO;2-S.
Aluko RE, McIntosh T (2004) Electrophoretic and functional properties of mustard
seed meals and protein concentrates. J Am Oil Chem Soc 81:679–683.
doi:10.1007/s11746-004-961-0.
Aluko RE, Reaney M, McIntosh T, Ouellet F, Katepa-Mupondwa F (2004)
Characterization of a calcium-soluble protein fraction from yellow mustard
(Sinapis alba) seed meal with potential application as an additive to calcium-
rich drinks. J Agric Food Chem 52:6030–6034. doi:10.1021/jf0496907.
AOAC (1990) Official Methods of Analysis of the Association of Official Analytical
Chemists. Association of Official Analytical Chemists, Inc., Arlington, VA, 15
Bremer VR, Liska AJ, Klopfenstein TJ, Erickson GE, Yang HS, Walters DT,
Cassman KG (2010) Emissions savings in the corn-ethanol life cycle from
feeding coproducts to livestock. J Environ Qual 39:472–482. doi:10.2134/
jeq2009.0283.
Canada Grains Council (2011) Online Statistical Handbook. http://
canadagrainscouncil.ca/html/handbook.html
Damodaran S (1996) Amino acids, peptides, and proteins. In: Fennema OR (ed)
Food chemistry, 3rd edn. Marcel Dekker Inc., New York, NY pp 321–430
Diosady LL, Rubin LJ, Tzeng Y-M (1989) Production of rapeseed protein materials.
USA Patent, 4889921
Diosady LL, Xu L, Chen B (2005) Production of high-quality protein isolates from
defatted meals of Brassica seeds. USA Patent, US2005/6905713 B2
European Commission (1998) Community methods for the determination of
amino-acids, crude oils and fats and olanquindox in feeding stuff and
amending Directive 71/393/EEC, Annex Part A. Determination of amino acids.
Off J Eur Comm L 257:14–23
European Commission (2000) Community methods for the determination of
vitamin A, vitamin E and tryptophan, Annex Part C. Determination of
tryptophan. Off J Eur Comm L 174:45–50
FAO/WHO/UNU (2002) Agricultural bulletin board on data collection,
dissemination and quality of statistics. Geneva, World Health Organization
Ferrer E, Alegría A, Farré R, Ablellán P, Romero F (2003) Fluorometric
determination of chemically available lysine: adaptation, validation and
application to different milk products. Nahrung/Food 47:403–407.
doi:10.1002/food.200390090.
Hsu HW, Vavak DL, Satterlee LD, Miller GA (1977) A multienzyme technique for
estimating protein digestibility. J Food Sci 42:1269–1273. doi:10.1111/j.1365-
2621.1977.tb14476.x.
Henriksen BIF, Lundon AR, Prestlokken E, Abrahamsen U, Eltun R (2009) Nutrient
supply for organic oilseed crops, and quality of potential organic protein
feed for ruminants and poultry. Agronomy research 7:592–598
Hickling D (2011) Canola meal feed industry guide. olacouncil.
org/meal4.aspx
Kuehl RO (2000) Design of experiments. In: statistical principles of research
design and analysis. Duxbury Press, Pacific Grove, CA, 2
Laemmli UK (1970) Cleavage of structural proteins during the assembly of the
head of bacteriophage T4. Nature 227:680–685. doi:10.1038/227680a0.
Larbier ZM, Chagneau AM, Lessire M (1991) Bioavailability of lysine in rapeseed
and soyabean meals determined by digestibility trial in cockerels and chick
growth assay. Anim Feed Sci Technol 35:237–246. doi:10.1016/0377-8401(91)
90130-K.
Lindeboom N, Wanasundara PKJPD (2007) Interference of phenolic compounds
in Brassica napus, Brassica rapa, and Sinapis alba seed extracts with the
Lowry protein assay. Food Chem 104:30–38. doi:10.1016/j.
foodchem.2006.10.067.
Llames CR, Fontaine J (1994) Determination of amino acids in feeds:
collaborative study. J AOAC Int 77:1362–1402
Milanova R, Murray D, Westdal PS (2006) Protein extraction from canola oil seed
meal. USA Patent, US2006/6992173 B2
Monsalve RI, Gonzalez de la Pena MA, Menendez-Arias L, Lopez-Otin C,
Villalba M, Rodriguez R (1993) Characterization of a new oriental-mustard
(Brassica juncea) allergen, Bra j IE: detection of an allergenic epitope.
Biochem J 293:625–632
Moure A, Sineiro J, Dominguez H, Parajo J (2006) Functionality of oilseed protein
products: a review. Food Res Int 39:946–963
Murray ED (1998) Oil seed protein extraction. USA Patent, 5844086
Newkirk RW, Maenz DD, Classen HL (2006) Oilseed processing. USA Patent,
US2006/7090887 B2
Oomah BD, Der TJ, Godfrey DV (2006) Thermal characteristics of flaxseed (Linum
usitatissimum L.) proteins. Food Chem 98:733–737. doi:10.1016/j.
foodchem.2005.07.017.
Ratanapariyanuch K, Shen J, Jia Y, Tyler RT, Shim YY, Reaney JTM (2011) Rapid
NMR method for the quantification of organic compounds in thin stillage. J
Agric Food Chem 59:10454–10460. doi:10.1021/jf2026007.
Shim YY, Wanasundara PKJPD (2008) Quantitative detection of allergenic protein
Sin a 1 from yellow mustard (Sinapis alba L.) seeds using enzyme-linked
immunosorbent assay. J Agric Food Chem 56:1184–1192. doi:10.1021/
jf072660u.
Sosulski FW, Imafidon GI (1990) Amino acid composition and nitrogen-to-protein
conversion factors for animal and plant foods. J Agric Food Chem
38:1351–1356. doi:10.1021/jf00096a011.
Tandang MRG, Adachi M, Utsumi S (2004) Cloning and expression of rapeseed
procruciferin in Escherichia coli and crystallization of the purified
recombinant protein. Biotechnol Lett 26:385–391
Wilkins MR, Singh V, Belyea RL, Buriak P, Wallig MA, Tumbleson ME, Rausch KD
(2006) Effect of pH on fouling characteristics and deposit compositions in
dry-grind thin stillage. Cereal Chem 83:311–314. doi:10.1094/CC-83-0311.
Xue Z, Yu W, Liu Z, Wu M, Kou X, Wang J (2009) Preparation and antioxidative
properties of a rapeseed (Brassica napus) protein hydrolysate and three
peptide fractions. J Agric Food Chem 57:5287–5293. doi:10.1021/jf900860v.
doi:10.1186/2191-0855-2-5
Cite this article as: Ratanapariyanuch et al.: Biorefinery process for
protein extraction from oriental mustard (Brassica juncea (L.) Czern.)
using ethanol stillage. AMB Express 2012 2:5.
Ratanapariyanuch et al. AMB Express 2012, 2:5
/>Page 9 of 9