báo cáo hóa học:" Resource reservation for mobile hotspots in vehicular environments with cellular/WLAN interworking" ppt
Bạn đang xem bản rút gọn của tài liệu. Xem và tải ngay bản đầy đủ của tài liệu tại đây (554.35 KB, 28 trang )
This Provisional PDF corresponds to the article as it appeared upon acceptance. Fully formatted
PDF and full text (HTML) versions will be made available soon.
Resource reservation for mobile hotspots in vehicular environments with
cellular/WLAN interworking
EURASIP Journal on Wireless Communications and Networking 2012,
2012:18 doi:10.1186/1687-1499-2012-18
Wei Song ()
ISSN 1687-1499
Article type Research
Submission date 30 June 2011
Acceptance date 17 January 2012
Publication date 17 January 2012
Article URL />This peer-reviewed article was published immediately upon acceptance. It can be downloaded,
printed and distributed freely for any purposes (see copyright notice below).
For information about publishing your research in EURASIP WCN go to
/>For information about other SpringerOpen publications go to
EURASIP Journal on Wireless
Communications and
Networking
© 2012 Song ; licensee Springer.
This is an open access article distributed under the terms of the Creative Commons Attribution License ( />which permits unrestricted use, distribution, and reproduction in any medium, provided the original work is properly cited.
Resource reservation for mobile hotspots in vehicular envi-
ronments with cellular/WLAN interworking
Wei Song
Faculty of Computer Science, University of New Brunswick, Fredericton, Canada
Email address:
Abstract
Nowadays, the pervasive wireless networks enable ubiquitous high-rate wireless access from everywhere. There
have been extensive studies on interworking of complementary wireless technologies in an indoor (residential or
business) environment such as offices, hotels, and airport terminals. Nonetheless, there are ever-increasing
demands for systematic deployment of moving networks in a vehicular environment such as public transits (e.g.,
a bus, train, or airplane). Due to the high mobility, it is very challenging to deliver smooth and high-quality
video services for such a vehicular network. In this article, we focus on a two-hop moving network integrating
both the cellular network and wireless local area network. By means of proper bandwidth reservation, we can
satisfy the quality of service constraints of video applications with respect to data loss rate and packet delay.
Analytical approaches are introduced to effectively estimate the achievable performance and derive the required
bandwidth. To characterize video traffic, a sigmoid function is proposed to model video flows as a
Markov-modulated pro cess and fluid-flow analysis is feasible to evaluate data loss rate. At a finer packet level,
the batch structure of packet arrivals is captured in the queueing analysis and packet delay is evaluated. On the
other hand, for aggregate traffic multiplexed at a local gateway for the vehicular network, we use a fractional
Brownian motion process to model the self-similar traffic and estimate data loss rate and packet delay.
According to the performance evaluation, we can derive the required channel bandwidth for such a mobile
hotspot. Numerical results are presented to demonstrate the application for bandwidth reservation, which is
especially useful in case of handover.
Keywords: vehicular networks; vehicular interworking; video transmission; handoff management; resource
reservation; cellular/WLAN integration; quality of service.
1
1 Introduction
Nowadays, mobile communications and wireless networks are ushering in a new era. The pervasive wireless
networks enable ubiquitous high-rate wireless access from everywhere, such as the third-generation (3G)
cellular networks, IEEE 802.16 wireless metropolitan area networks/WiMAX (worldwide interoperability
for microwave access), IEEE 802.20 broadband wireless access/MobileFi, IEEE 802.11 wireless local area
networks (WLAN)/Wi-Fi, and IEEE 802.15 wireless personal area networks (WPAN). With
well-entrenched infrastructure, the cellular networks provide ubiquitous coverage but relatively low data
rates, whereas WLANs support high data rates with cost-effective deployment over smaller geographic
areas. To enable ubiquitous services, there have been intensive studies on the interworking between the
complementary 3G cellular networks and WLANs by means of vertical handoff, access selection, and load
balancing [1,2]. Most of the previous studies on cellular/WLAN interworking focus on a simple scenario
with static WLAN deployment in an indoor environment such as offices, hotels, and airport terminals.
In addition to such slow-moving or static scenarios in an indoor (residential or business) environment,
there are ever-increasing demands for systematic deployment of moving networks in a vehicular
environment such as public transits (e.g., a bus, train, or airplane). For mobile hotspots in a vehicular
environment, it is usually not feasible to take advantage of the overlay structure of the cellular/WLAN
integrated network in an indoor environment. The high speed of vehicles poses more stringent constraints
for fast, smooth, and reliable handoff. Gogo In-flight Internet by Aircell () is one
successful story under an extremely high mobility condition, where in-flight broadband access is provided
for planes flying at an altitude above 10,000 ft and at a speed of 500 miles per hour. Gogo is a
ground-to-air system using the 3G cellular technology evolution-data optimized (EV-DO) integrated with
802.11 WLAN for last-hop access. However, at a high moving velocity, when the plane is crossing over
ground radio towers, data rates degrade due to handoff between neighboring cells. As a result, slow
playback and even halting of video streaming has been observed in previous Gogo tests [3].
It is known that mobile video will generate most of the mobile traffic growth through 2015 as predicted by
Cisco [4]. The statistics collected from leading mobile operators worldwide in 2010 [5] also show video
streaming accounts for 37% of mobile data usage, which is the largest part next to file sharing (30%) and
2
Web browsing (26%). There are two major types of video services, i.e., conversational video (e.g.,
videoconference) and video streaming [6]. Conversational video is characterized by very stringent
end-to-end latency constraint and two-way traffic with a bursty pattern due to the use of live video
encoder. In contrast, video streaming usually only involves with one-way downlink traffic. Video streams
can be pre-stored at application servers and allow for a pre-rolling delay of a few seconds before the start of
video playback. As such, video streaming applications are more concerned with playback smoothness and
the delay constraint is relaxed in a sense.
Due to high vehicular mobility, it becomes very challenging to deliver good-quality video applications for a
mobile hotspot. Usually, a multi-mode wireless gateway can be deployed to connect end users in the vehicle
with the backbone network. In case that a handoff is required between neighb oring cells, the ongoing
traffic can be multiplexed at a local gateway and handed over as a whole [7], since all end users are moving
together. The multiplexing gain is thus exploited to reduce bandwidth demands. Considering the high
vehicular mobility and intensive bandwidth demands of video traffic, it is essentially important to reserve
bandwidth in advance for handoff traffic so as to minimize service interruptions. In order to estimate
bandwidth requirement of video flows, we need to appropriately evaluate the achievable quality of service
(QoS) with a given bandwidth from the two-hop vehicular network. User perceived video quality is subject
to stringent QoS constraints in terms of data loss rate and packet delay.
In the literature, there has been extensive work modeling the varying data rate and frame size of video
traffic [8,9]. Traditionally, video traffic can be viewed as a fluid flow and characterized with a
Markov-modulated pro cess by neglecting traffic discreteness. To capture both frame size variation and
auto-correlation, we extend the Markov-modulated Gamma-based model (MMG) proposed in [8] for
performance evaluation. As discussed above, because of the group mobility feature, the ongoing traffic
within a vehicular network can be multiplexed at a local gateway and handed over together. Due to the
long-range dependency of video traffic, the resulting aggregate traffic exhibits self-similarity and high
variability over a wide range of time scales [10]. The fractional Brownian motion (FBM) process is a
powerful to ol to analyze self-similar data flows [11]. Based on such traffic models, we analytically evaluate
data loss rate of video traffic at the fluid-flow level and average transfer delay at the packet level for a
two-hop vehicular network. Accordingly, the bandwidth requirement for a backhaul connection can be
estimated to satisfy the QoS constraints of video traffic.
The rest of the article is organized as follows. Section 2 gives the two-hop relay network structure and
video traffic models considered in this study. In Section 3, we introduce the approaches to analyze video
3
performance over a two-hop wireless channel. Numerical results are presented in Section 4, followed by
conclusions and future study in Section 5.
2 System model
2.1 Two-hop network structure
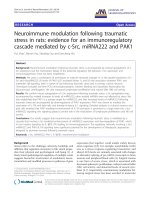
As shown in Fig. 1, we focus on a vehicular network with a two-hop relay structure, which is supported by
the cellular/WLAN interworking. In a vehicular environment within mobile ambulances or public transits,
user traffic can be first delivered and multiplexed at a local multi-mode WLAN router, which further relays
the aggregate traffic through a cellular backhaul connection. As such, an end user in the vehicular network
is served by a two-hop wireless relay channel via heterogeneous technologies. The wide-area coverage of
cellular networks provides continuous access via seamless handoff. During a handoff between neighboring
cells, the ongoing traffic from the moving network can be buffered at the WLAN router and handed over as
a whole. It is known that the knowledge of moving patterns can assist handoff process. In the scenario of
Fig. 1, it is worth noting that the routes of public transits are usually pre-defined and known a priori.
Taking advantage of this feature, we can reserve resources in advance for the group handoff traffic within
the vehicular network.
2.2 Video traffic model
It is known that video traffic is inherently long-range dependent and highly correlated due to compression
coding. In the 3G cellular networks, H.264 Advanced Video Coding (AVC) is recommended for
high-quality video [12]. To remove temp oral redundancy, intracoded (I) frames are interleaved with
predicted (P) frames and bidirectionally coded (B) frames. I frames are compressed versions of raw frames
independent of other frames, whereas P frames only refer preceding I/P frames and B frames can refer
both preceding and succeeding frames. A sequence of video frames from a given I frame up to the next I
frame comprise a group of pictures (GoP). Because P and B frames are encoded with reference to
preceding and/or succeeding I/P frames, the transmission traffic follows the batch arrivals shown in Fig. 2.
Here, 3 B frames are coded between two key I/P frames and the GoP follows a structure of size 16 such as
“I
0
P
4
B
1
B
2
B
3
P
8
B
5
B
6
B
7
P
12
B
9
B
10
B
11
I
16
B
13
B
14
B
15
. . .” In contrast, video frames are decoded and
displayed at the receiver in a reorganized order.
In the literature, there has been extensive work modeling the varying rate and frame size of video
traffic [8,9]. The Markov chain-based models enable tractable queue analysis with the well-established
4
fluid-flow analytical framework [13]. A MMG framework is proposed in [8] to model highly correlated video
frame size. For a video flow consisting of frame bursts, video clips are grouped into a small number of shot
classes depending on the burst size. As shown in Fig. 3, state transitions between video shot classes are
characterized by a Markov process. The size of I, P, and B frames for each shot class is modeled by an
axis-shifted Gamma distribution, whose probability density function is given by
f
G
(x) =
x
σ
k
−1
e
−x/θ
k
Γ(σ
k
)θ
σ
k
k
, σ
k
> 0, θ
k
> 0, k = 1, 2, . . . , K (1)
where K is the number of video classes, Γ(·) is the Gamma function, and σ
k
and θ
k
are the shape
parameter and scale parameter, respectively, for shot class k.
In the original MMG model, the GOP size boundaries for classification are geometrically separated. As
observed in [14], the size of video frames based on H.264 exhibits heavy-tailed property. That is, extremely
large frames exist with a non-negligible probability. The experimental results in [15] show that the
boundaries between shot classes should be set appropriately so that the video statistics are captured
accurately and video frames are balanced among the classes. To discern differences of large-size video clips
in classification, we propose to use the following sigmoid function to determine the class boundaries:
s
k
=
1
1 + e
−α·(k−β)
, k = 1, 2, . . . , K + 1. (2)
As this sigmoid function takes values within (0, 1), we map the total size of video frames in a burst to the
range
S
min
, S
max
such that
s
1
=
S
min
δ · S
max
, s
K+1
=
1
δ
(3)
where δ (0 < δ < 1) is a scale factor.
As an example, we take a video sequence Tokyo Olympics coded with single layer H.264/AVC from the
video trace library of Arizona State University [16]. The video trace has a common intermediate format
(CIF) resolution (352 ×288), a fixed frame rate at 30 frames/s, a GoP size of 16 with 3 B frames between
I/P key pictures, and a quantization step size indexed at 24. Figure 4 shows the size boundaries to classify
video clips following a geometric function or a sigmoid function, respectively. As seen, the S-shaped size
boundaries can also differentiate differences when the GOP size is very large.
According to the size boundaries, video clips are classified into shot classes. The transition probability p
ij
from class i to class j can be estimated from the normalized relative frequency of transitions:
p
ij
= f
ij
/f
i
(4)
5
where f
ij
is the total number of transitions from state i to j and f
i
is the total number of transitions out of
state i. The resulting K × K matrix of transition probabilities, denoted by P, can be translated into a
corresponding infinitesimal generating matrix in a continuous-time domain, denoted by M, as follows
M = g(P −I) (5)
where g is the arrival rate of video bursts and I is the identity matrix. Let J denote the number of B frames
between two key I/P pictures and f the constant frame rate. Then, the video burst rate g = f/(J + 1).
2.3 FBM model for aggregate traffic
As shown in Fig. 1, traffic flows from a vehicular network can be first multiplexed at a local gateway and
then relayed to a remote cellular base station. Due to the long-range dependency of video flows, the
aggregate traffic exhibits self-similarity and high variability over a wide range of time scales [10]. In this
study, we use the well-known FBM model [11] to characterize the self-similar data traffic. In particular, the
cumulative arrival process of an aggregate traffic flow, denoted by Λ(t), can be approximated by an FBM
process as follows
Λ(t) = mt +
√
amZ(t) (6)
where m is the mean data arrival rate (the average number of data units arrived in a time interval), a is
the variance coefficient (the ratio of variance to mean of data arrivals), and Z(t) is a normalized FBM
process with Hurst parameter H ∈ [0.5, 1). The normalized FBM process Z(t) processes the following
properties [17]: (1) Z(t) is a Gaussian process with stationary and ergodic increments; (2) Z(0) = 0 and
E
Z(t)
= 0 for all t; (3) Z(t) has continuous paths; and (4) Var
Z(t)
= t
2H
.
3 Resource reservation for aggregate handoff traffic
3.1 Video quality indicators
As specified in [18], video quality is indicated by two components, namely, the loss rate and delay factor.
Video distortion is a most direct QoS metric from the end user’s perspective. It depends on data loss rate
resulting from channel errors and encoding parameters that provide error resilience features. According to
the R-D model proposed in [19], video distortion due to channel errors is defined as
D =
a
1 − b + ψb
P L
1 − PL
E
F(k, k − 1)
(7)
6
where P L is the data loss rate, b is a parameter that describes the motion randomness of the video scene, a
is the energy loss ration of the enco der filter, ψ is the percentage of intra-coded frames, and E
F(k, k − 1)
is the average value of the successive frame difference F(k, k − 1). As seen from (7), data loss rate is an
important factor determining perceived video quality.
In Fig. 1, a two-hop wireless relay via heterogeneous technologies is applied for a vehicular network to
facilitate ubiquitous access, alleviate power constraint, and enhance transmission rate. An end user within
a vehicle is served by both a local wireless router connected with a remote cellular radio tower. In contrast
to wired networks, wireless channel is highly time-varying and supports a relatively low data rate. Hence,
the performance over the two-hop wireless channel contributes significantly to the end-to-end QoS. Hence,
video distortion perceived at the receiver is closely related to the data loss rate over the last-hop WLAN,
denoted by P L
w
, and that of the cellular relay channel, denoted by P L
c
.
Moreover, b ecause video frames are captured and coded in constant intervals, there is a deadline to play
back a designated video frame at the receiver end. If a frame to play has not been completely delivered to
the buffer at fetch time, the playback is interrupted. Hence, the transfer delay is an important factor to
ensure playback smoothness and continuity. The mean wireless access delay (denoted by T ) should be
upper-b ounded by ∆, i.e.,
T = T
w
+ T
c
≤ ∆ (8)
where T
w
is the mean transfer delay over the last-hop WLAN and T
c
is that between the WLAN router
and the cellular base station. For 802.11 WLAN, the wireless channel is shared in a contention-based
access manner. It is quite limited in QoS provisioning. On the other hand, in the cellular network,
reservation-based resource allocation is enabled with a centralized infrastructure. As such, the aggregate
traffic of a mobile hotspot can be delivered with dedicated cellular channels. The mean transfer delay is
thus dep endent on the reserved bandwidth of the cellular channel.
3.2 Fluid-flow data loss rate
As shown in Fig. 3, an individual video flow within the mobile hotspot is modelled by a continuous-time
Markov-modulated pro cess, whose infinitesimal generating matrix M can be obtained from video traces
according to a sigmoid classification function. The data rate for each shot class k is denoted by R
k
(bps),
which equals the average of total frame sizes of video bursts in the state over the burst duration (1/g).
Without loss of generality, the shot classes (states) are arranged in an ascending order with respect to date
rates R
k
. Viewing the video stream as a fluid flow, we can derive the equilibrium queue length distribution
7
at the local wireless router. Let F
k
(x) denote the stationary probability that the buffer occupancy is less
than or equal to x, given that the video source is in state k.
It is known that channel access in a WLAN follows a contention-based random access protocol, i.e., the
carrier sensing multiple access with collision avoidance (CSMA/CA) algorithm and binary exponential
backoff. As shown in [20], there exists an optimal operating point for the WLAN in the unsaturated case,
beyond which the packet delay increases dramatically and the throughput drops quickly. When a WLAN
operates in the unsaturated range, packet collision probability is quite small and each packet sees an
approximately constant service rate. Assuming a constant channel service rate C
L
(bps) for the last-hop
WLAN and a Markov-mo dulated fluid process for the video flow, we can derive the equilibrium queue
length distribution following the fluid-flow analytical approach [13]. That is,
d
−→
F (x)
dx
B =
−→
F (x)M (9)
where
−→
F (x) =
F
1
(x), F
2
(x), . . . , F
K
(x)
, B is a diagonal matrix defined by B = R − C
L
I,
R = diag
R
1
, R
2
, . . . , R
K
, and M is the infinitesimal generating matrix of the underlying Markov process.
Alternatively,
d
−→
F (x)
dx
=
−→
F (x)M
, M
= MB
−1
. (10)
Based on the above set of first-order linear differential equations, we can obtain the solution to
−→
F (x):
−→
F (x) =
−→
π +
k:Re[z
k
]<0
a
k
−→
Φ
k
e
z
k
x
(11)
where
−→
π is the steady-state distribution of the continues-time Markov chain and satisfies
−→
π M =
−→
0 , z
k
and
−→
Φ
k
are the kth negative eigenvalue and the corresponding eigenvector of MB
−1
, that is
z
k
−→
Φ
k
=
−→
Φ
k
MB
−1
. (12)
It is worth mentioning that
−→
Φ
k
are the row eigenvectors of M
, which are equivalent to the transpose of
the column eigenvectors of (M
)
T
, i.e., the transpose of M
. The coefficients a
k
can be obtained from the
boundary conditions, i.e., F
k
(0) = 0 for R
k
> C
L
.
The cumulative distribution function (CDF) of the queue length is then
F (x) =
K
k=1
F
k
(x). (13)
Given certain delay constraint, the queue occupancy is required to be less than a threshold Ψ
w
, beyond
which newly arrived data are very likely to be dropped at the receiver due to expiration for playback. Such
8
data loss due to an intolerable long delay directly affects video distortion perceived by end users. Based on
(13), we can estimate data loss rate P L
w
for the last-hop WLAN caused by backlogging:
P L
w
≈ 1 −F (Ψ
w
). (14)
When a large numb er of data flows are multiplexed at the local gateway and forwarded toward their final
destinations, the aggregate flow presents self-similar properties. The cumulative arrival process of
aggregate traffic can be captured by a FBM process given in (6). Based on the analytical method in [21],
we can evaluate the tail distribution of the queue length (Q
A
) over the second-hop relay channel, given by
G(x) P
Q
A
> x
=
2π
1 +
√
Hx
1−H
2
−
1
4
exp
−
1
2
Hx
2−2H
(15)
where
H =
(C
A
− m)(1 −H)
2H
am(1 − H)
2
H
2H
(16)
and C
A
(bps) is the transmission rate of cellular relay channel for aggregate traffic and m is the mean
arrival rate of the aggregate traffic flow per second. Similar to (14), data loss rate P L
c
for the second-hop
relay channel can be estimated from (15) as
P L
c
≈ G(Ψ
c
). (17)
3.3 Packet delay performance
As shown in the R-D model in (7) for video distortion, data loss rate directly affects user perceived video
quality. Packet delay is another important factor, which not only determines playback smoothness but also
implicitly influences video distortion as expired packets violating delay constraints might be dropped.
Assume that video frames are segmented into packets of fixed-size L for transmission. In (6), the
self-similar aggregate traffic flow is modelled by an FBM process. Letting the data unit changed from bits
to packets, we have the channel transmission rate (in packets per second) given by
˜
C
A
= C
A
/L. The mean
and variance coefficient of data arrivals become ˜m = m/L and ˜a = a/L, respectively. As empirically
observed in [21], packet size has a relatively slight effect on the self-similarity of traffic flows. At the packet
level, the traffic flow is still self-similar and the same Hurst parameter is preserved. Hence, similar to the
derivation in (15), we can evaluate the mean packet delay over the second-hop relay channel as follows:
T
c
=
L
C
A
+
1
˜m
∞
0
P
˜
Q
A
> x
dx. (18)
9
On the other hand, it is more complicated to evaluate the packet transfer delay (T
w
) over the hop between
end users and the local gateway. As shown in Fig. 2, video frames actually arrive in bursts due to forward,
backward, or bidirectional prediction in video coding and compression. If video frames are fragmented and
encapsulated into fixed-size transmission packets, a random number of packets are actually generated as a
batch for each video burst. Although video traffic correlation can be mo delled by a Markov process
described in Fig. 3, it is observed in [14] that the use of a theoretical and independent distribution for
frame sizes approximates the trace behavior fairly well and gives close performance statistics. The key is to
preserve the batch structure of packet arrivals and fixed inter-arrival time. As the sizes of video frame
bursts for different shot classes are modelled by axis-shifted Gamma distributions, we approximate the
number of packets in a “packet train” with a negative binomial distribution NB(r, p), which is a discrete
analog of Gamma distribution. The probability mass function (PMF) of the number of packets in a batch
(denoted by A) is given by
P[A = k] f
A
(k) =
k + r − 1
r −1
(1 − p)
r
p
k
, r > 0, 0 < p < 1, k = 0, 1, . . . (19)
where the binomial coefficient
k + r − 1
r −1
=
(k + r − 1)(k + r − 2) . . . (r)
k!
. (20)
The parameters r and p can be obtained by fitting the mean and variance of the batch size:
A =
rp
1 − p
, σ
2
A
=
rp
(1 − p)
2
. (21)
To analyze the packet delay over the last-hop WLAN, we use a small time unit τ to discretize the time
scale. The inter-arrival time of video bursts is then N = 1/(g ·τ) time units, where g is the video burst
rate. Given fixed packet size L, the packet transmission time over the WLAN channel is assumed to be h
time units, where h = L/(C
L
· τ ). With the aforementioned batch structure and fixed burst inter-arrival
time, the average delay experienced by a tagged packet in a video batch (T
w
) consists of three independent
components: (1) the waiting time of the first packet of that batch to be served, denoted by W
G
; (2) the
waiting time due to the transmission of the packets of that batch queued before the tagged packet, denoted
by W
R
; and (3) the transmission time of the tagged packet, which is assumed to be deterministic and equal
to h time units.
To evaluate the component W
G
with a queueing system model, a batch can be viewed as a single customer
whose service time is the total transmission time of all packets in a batch. An analytical approach is
10
introduced in [22] for the waiting time of a D/G/1 queue, whose inter-arrival time is deterministic and
service time follows a general distribution. Let G denote the batch service time and G(z) the
corresponding probability generating function (PGF). The average waiting time for W
G
is derived by
W
G
= −
N(N − 1) −G
(1
−
)
2[N − G
(1
−
)]
+
N−1
k=1
1
1 − z
k
(22)
where N is the inter-arrival time of video batches, z
1
, . . . , z
N−1
are the unique roots of z
N
− G(z) = 0
within the unit circle | z |< 1, and G
(1
−
) and G
(1
−
) are the first-order and second-order derivatives of
G(z) at z = 1
−
.
The component W
R
is the average waiting time due to the transmission of other packets prior to the
tagged one in a batch. Obviously, it depends on the statistics of the number of packets queued before a
tagged packet. According to the analysis in [23], the PGF of the probabilities that n packets in the current
batch of a tagged packet are to be served prior to the tagged one is given by
Y (z) =
∞
n=1
z
n
∞
k=n+1
k ·P[A = k]
A
·
1
k
=
1 − A(z)
A(1 − z)
(23)
where A(z) is the PGF of the number of packets in each non-zero sized video batch according to (19),
given by
A(z) =
p
1−(1−p)z
r
− (1 −p)
r
1 − (1 − p)
r
. (24)
Since the packet transmission time is assumed to be deterministic with h time units, the PGF of the
waiting time W
R
due to the transmission of the packets in a batch before a tagged one is then
W
R
(z) = Y (z
h
). (25)
Therefore, the average waiting time W
R
are obtained as
W
R
= lim
z→1
−
dW
R
(z)
dz
. (26)
The overall packet delay is then given by
T
w
= h + W
R
+ W
G
. (27)
Based on the evaluation of data loss rate in Section 3.2 and the delay analysis this section, we can see that
the achievable video quality depends on the available bandwidth within the last-hop WLAN and that of
the cellular relay channel. To satisfy the QoS constraints for video transmission, we can derive the required
bandwidth to be reserved for video flows within the vehicular network.
11
4 Numerical results and discussion
In this section, we present numerical examples to illustrate the use of our analysis for bandwidth
reservation. Table 1 gives the system parameters for numerical experiments.
4.1 Effective bandwidth for video flows
As discussed in Section 2.2, we extend MMG to characterize video traffic as fluid flows. A sigmoid function
is applied to determine shot class boundaries. In this section, we give numerical examples for traffic
modelling based on a Markov-modulated process. Here, we consider H.264/AVC video sequences of Tokyo
Olympics from the video trace library [16]. These video sequences have a CIF resolution, a fixed frame rate
at 30 frames/s, a GoP size of 16, and 7 B frames between two I/P key pictures. The quantization level
varies with the step size and a higher quantization index (between 0 and 51) results in a lower encoding bit
rate. Taking the number of video classes K = 6, we use the classification function defined in (2) to
determine the classes (states) of video clips. Table 2 gives the approximate matrix of transition
probabilities P for the video sequence at the quantization level 34. To bound data loss rate P L
w
at the
flow level, the effective bandwidth can be derived from the analysis in Section 3.2. Figure 5 demonstrates
the effective bandwidth requirements of video flows at different quantization levels when data loss rate is
upper bounded by 0.01. For instance, at the quantization level 34, the effective bandwidth requirement of
the video flow is 634.8 kbit/s.
4.2 Bandwidth reservation to ensure fluid-flow and packet-level QoS
As intro duced in Section 3.1, video distortion is one of the most direct quality indicators for video
applications. It depends on various factors including encoding parameters and transmission p erformance
such as data loss rate. Packet delay affects not only playout smoothness but also video distortion level due
to dropping of expired packets. In Sections 3.2 and 3.3, we have presented the analytical approaches we
can leverage to estimate the achievable performance int terms of data loss rate and packet delay. In this
section, we will give some numerical examples to demonstrate the use of the above analysis to derive
required channel bandwidth. It is especially useful for the the handover of a mobile hotspot between
neighboring cells.
Consider an H.264/AVC video sequence of Tokyo Olympics at the quantization level 34. The average bit
rate of an individual video flow is 153.5 kbit/s. Suppose the effective one-way channel rate of the WLAN is
around 3 Mbit/s. By changing the number of video flows in the mobile hotspot, we can obtain a varying
12
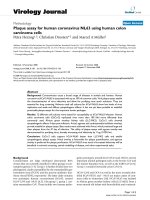
traffic load to the WLAN channel. Figure 6 shows the data loss rate under different load conditions. As
seen, the data loss rate increases slowly with a light traffic load but grows much faster when the traffic load
becomes heavy. Based on the Markov-mo dulated video traffic model and fluid-flow analysis, we can
effectively evaluate the data loss rate.
As shown in Fig. 1, a two-hop wireless channel is applied for the moving network in a vehicular
environment. In case of a handoff between neighboring cells, the ongoing traffic within the mobile hotsplot
can be multiplexed at a local gateway and handed over together. Suppose we have a number of video flows
in progress and the aggregate flow rate is around 767.3 kbit/s. Figure 7 illustrates the relationship between
the bandwidth of cellular relay channel and the corresponding data loss rate over it. Due to self-similarity
of the aggregate traffic flow, we use the FBM model in (6) to capture the data arrival process. Accordingly,
the data loss rate over the cellular channel can be estimated. As seen from Fig. 7, sufficient bandwidth
should be reserved from the cellular network so as to bound the data loss rate by 0.01. In this example, the
minimum bandwidth requirement is around 4.06 Mbit/s.
To enable real-time transmission of video packets over the two-hop scenario in Fig. 1, the overall delay
should also be upper bounded. Given the same parameters as ab ove, Figs. 8 and 9 show the delay
performance at the packet level. For the last-hop WLAN, because of inter-coded frames, video traffic
actually arrives in bursts and results in a batch of encapsulated packets for each video burst. Based on the
queueing analysis in Section 3.3, packet delay can be evaluated according to a D
[A]
/G/1 queueing system.
The analysis preserves the essential video traffic features such as fixed burst inter-arrival time and batch
structure for packet arrivals. The packet delay over the WLAN hop is approximated fairly well. As an
example, we can see in Fig. 8 that the average packet delay is around 75.7 ms when the load factor is 0.26.
Because the WLAN channel is based on random access, it is hard to supp ort bandwidth allocation. In
contrast, sufficient bandwidth can be reserved for the relay channel from the cellular network so that the
overall QoS constraints are satisfied. In Fig. 9, the dashed red line shows the delay bound for the cellular
relay channel excluding the WLAN-hop delay. The black dotted curve shows the variation of packet delay
with cellular channel bandwidth. The packet delay is obtained according to (18). As seen, when the mean
packet delay decreases with the increase of the cellular channel rate, we can obtain the channel bandwidth
to be reserved by locating the intersection point with the line of delay bound. In this case, if a cellular
channel with a bandwidth around 4.58 Mbit/s is reserved, the overall wireless access delay can be bounded
by 350 ms on average.
13
5 Conclusions and future work
In this article, we investigate the resource reservation issue for moving networks in a vehicular environment.
A two-hop relay structure integrates heterogeneous technologies of the cellular network and wireless local
area network. Focusing on the ever-increasing video applications, we have introduced feasible analytical
approaches to effectively evaluate video performance in terms of data loss rate and packet delay. To satisfy
video QoS constraints, we can derive the bandwidth to be reserved for handover. Our performance
evaluation has taken into account the two-hop relay structure and the essential characteristics of video
traffic. At the flow level, we use a sigmoid function to model video flows as a Markov-modulated process
and calculate data loss rate with fluid-flow analysis. At a finer packet level, due to inter-coded frames,
video traffic arrives in bursts and results in transmission packets as a batch for each video burst. Our
queueing analysis for packet delay has considered this feature and provided fairly accurate estimate. On the
other hand, video flows from end users within a vehicular network can be multiplexed at a local gateway.
As the aggregate traffic exhibits self-similarity, we use a FBM process to characterize the aggregate traffic
flow beyond the wireless gateway. The data loss rate and packet delay for the second hop are approximated
accordingly. As demonstrated in the numerical examples, the performance evaluation can be applied to
derive bandwidth requirement during handover. In our future study, we would examine the impact of
varying channel rates due to radio fading and access contention. To optimize video delivery quality, we can
develop an efficient handoff algorithm depending on the vehicular mobility and traffic variation.
Competing interests
The authors declare that he has no competing interests.
Acknowledgment
This research was supported by research grants from Natural Sciences and Engineering Research Council
(NSERC) of Canada and New Brunswick Innovation Foundation (NBIF).
References
1. W Song, W Zhuang, Multi-service load sharing for resource management in the cellular/WLAN
integrated network. IEEE Trans. Wirel. Commun. 8(2), 725–735 (2009)
2. P Si, H Ji, FR Yu, Optimal network selection in heterogeneous wireless multimedia networks.
ACM/Springer Wirel. Netw. 16(5), 1277–1288 (2009)
14
3. WS Mossberg, Internet-a-Gogo: Airlines to offer in-flight access. The Wall Street J.
(2008)
4. Cisco: Cisco visual networking index: Global mobile data traffic forecast update, 2010–2015, 2011
5. Allot: Allot mobile trends: Global mobile broadband traffic rep ort, 2010
6. S Wenger, H.264/AVC over IP. IEEE Trans. Circ. Syst. Video Technol. 13(7), 645–656 (2003)
7. X Cai, F Liu, Network selection for group handover in multi-access networks, in Proc. IEEE ICC,
2008, pp. 2164–2168
8. UK Sarkar, S Ramakrishnan, D Sarkar, Markov-modulated Gamma-based framework. IEEE/ACM
Trans. Netw. 11(4), 638–649 (2003)
9. DP Heyman, The GBAR source model for VBR videoconferences. IEEE/ACM Trans. Netw. 5(4),
554–560 (1997)
10. WE Leland, MS Taqqu, W Willinger, DV Wilson, On the self-similar nature of Ethernet traffic
(extended version). IEEE/ACM Trans. Netw. 2, 1–15 (1994)
11. Y Cheng, W Zhuang, X Ling, FBM model based network-wide performance analysis with service
differentiation, in Proc. ICST Qshine, 2007
12. 3GPP: Transparent end-to-end packet-switched streaming service (PSS); Protocols and codecs. 3GPP
TS 26.234 V9.3.0 2010
13. B Maglaris, D Anastassiou, P Sen, G Karlsson, J Robbins, Performance models of statistical
multiplexing in packet video communications. IEEE Trans. Commun. 36(7), 834–844 (1988)
14. DMB Masi, MJ Fischer, DA Garbin, Video frame size distribution analysis. Telecommun. Rev. 19,
74–86 (2008)
15. F Wan, L Cai, TA Gulliver, A simple, two-level Markovian traffic model for IPTV video sources, in
Proc. IEEE GLOBECOM, 2008
16. P Seeling, M Reisslein, B Kulapala, Network performance evaluation with frame size and quality traces
of single-layer and two-layer video: a tutorial. IEEE Commun. Surv. Tutorials 6(3), 58–78 (2004)
15
17. I Norros, On the use of fractal Brownian motion in the theory of connectionless networks. IEEE J. Sel.
Areas Commun. 13(6), 953–962 (2002)
18. J Welch, J Clark, RFC 4445: A proposed media delivery index (MDI), 2006
19. Z He, J Cai, CW Chen, Joint source channel rate-distortion analysis for adaptive mode selection and
rate control in wireless video coding. IEEE Trans. Circ. Syst. Video Technol. 12(6), 511–523 (2002)
20. H Zhai, X Chen, Y Fang, How well can the IEEE 802.11 wireless LAN support quality of service?
IEEE Trans. Wirel. Commun. 4(6), 3084–3094 (2005)
21. X Jin, G Min, QoS analysis of queuing systems with self-similar traffic and heavy-tailed packet sizes, in
Proc. IEEE ICC, 2008, pp. 100–104
22. LD Servi, D/G/1 queues with vacations. Oper. Res. 34(4), 619–629 (1986)
23. PJ Burke: Delays in single-server queues with batch input. Oper. Res. 23(4), 830–833 (1975)
Fig. 1: Two-hop relay structure for vehicular moving networks.
Fig. 2: Transmission and display orders of video frames.
Fig. 3: Markov-modulated video traffic model.
16
Fig. 4: Size boundaries to classify video clips.
Fig. 5: Effective bandwidth of video flows at different quantization levels.
Fig. 6: Data loss rate over WLAN channel (PL
w
).
Fig. 7: Data loss rate over cellular relay channel (P L
c
).
Fig. 8: Packet delay over WLAN channel (T
w
).
Fig. 9: Packet delay over cellular relay channel (T
c
).
Table 1: System parameters for numerical analysis
Symbol Value Definition
α 1.3484 Parameter of sigmoid function for video classification
β 5.2924 Parameter of sigmoid function for video classification
δ 1.1 Scale factor to segment video flows
f 30 Video frame rate (/s)
g 3.75 Video frame burst rate (/s)
J 7 Number of B frames between two key I/P frames
K 6 Number of video classes for traffic modelling
a 175.38 Variance coefficient of aggregate traffic (kbit/s)
˜a 29.23 Variance coefficient of aggregate traffic (packets/s)
H 0.7 Hurst parameter
C
L
∼ 3.0 One-way channel rate of last-hop WLAN channel (Mbit/s)
τ 0.006 Time unit (s)
L 6000 Transmission packet size (bits)
p 0.4424 Parameter of negative binomial distribution for video batch size A
r 2.5812 Parameter of negative binomial distribution for video batch size A
σ 1.4847 Shape parameter of Gamma distribution for video burst size G (kbits)
θ 27.56 Scale parameter of Gamma distribution for video burst size G (kbits)
17
Table 2: Matrix of transition probabilities for a video flow
State
State
1 2 3 4 5 6
1 0.1866 0.5598 0.2493 0.0044 0 0
2 0.1384 0.2796 0.5345 0.0468 0.0007 0
3 0.0200 0.1811 0.6670 0.1308 0.0011 0
4 0.0007 0.0267 0.2459 0.6945 0.0322 0
5 0 0 0.0227 0.4838 0.4708 0.0227
6 0 0 0 0 0.7778 0.2222
18
WWAN Connection:
3G, WiMAX, MobileFi,
Base Station
WWAN
WLAN or WPAN
WLAN or WPAN
Connection
IP Backbone
Figure 1
Transmission order
Display order
……
P
B
B
B
P
B
B
B
I
B
B B
P
0 321 4
0 4 8
I
Figure 2
K321
…
2,1
λ
3,1
λ
2,3
λ
2,K
λ
K,1
λ
1,2
λ
) ,(
11
ϑσ
Γ
Markov process
State-dependent
Gamma distribution
for frame sizes
) ,(
22
ϑσ
Γ
) ,(
KK
ϑσ
Γ
Figure 3
1 3 5 7 9 11 13 15
0
0.5
1
1.5
2
2.5
3
3.5
4
x 10
4
Video class indexes
GOP size boundaries (byte)
Geometrically separated
Sigmoid function-based
Figure 4
15 20 25 30 35 40 45 50
0
1
2
3
4
5
6
Index of video quantization step size
Effective bandwidth and average flow rate (Mbit/s)
Average video flow rate
Effective bandwidth
Figure 5
0.2 0.3 0.4 0.5 0.6 0.7 0.8 0.9 1
0
0.02
0.04
0.06
0.08
0.1
0.12
0.14
0.16
0.18
0.2
Video traffic load factor
Data loss rate over WLAN
Individual video flow rate: 153.5 kbit/s
Quantization level index: 34
Total available channel rate: 3.0 Mbit/s
Figure 6