báo cáo hóa học:" Mobile operators have set ambitious targets-is it possible to boost network capacity while reducing its energy consumption?" potx
Bạn đang xem bản rút gọn của tài liệu. Xem và tải ngay bản đầy đủ của tài liệu tại đây (493.58 KB, 31 trang )
This Provisional PDF corresponds to the article as it appeared upon acceptance. Fully formatted
PDF and full text (HTML) versions will be made available soon.
Mobile operators have set ambitious targets-is it possible to boost network
capacity while reducing its energy consumption?
EURASIP Journal on Wireless Communications and Networking 2012,
2012:34 doi:10.1186/1687-1499-2012-34
Gilbert Micallef ()
Preben Mogensen ()
Hans-Otto Scheck ()
ISSN 1687-1499
Article type Review
Submission date 31 August 2011
Acceptance date 6 February 2012
Publication date 6 February 2012
Article URL />This peer-reviewed article was published immediately upon acceptance. It can be downloaded,
printed and distributed freely for any purposes (see copyright notice below).
For information about publishing your research in EURASIP WCN go to
/>For information about other SpringerOpen publications go to
EURASIP Journal on Wireless
Communications and
Networking
© 2012 Micallef et al. ; licensee Springer.
This is an open access article distributed under the terms of the Creative Commons Attribution License ( />which permits unrestricted use, distribution, and reproduction in any medium, provided the original work is properly cited.
Mobile operators have set ambitious targets—is it possible to boost
network capacity while reducing its energy consumption?
Gilbert Micallef*
1
, Preben Mogensen
2
and Hans-Otto Scheck
3
1
Radio Access Technology, Department of Electronic Systems, Aalborg University, Niels
Jernes Vej 12 A6, 9220 Aalborg Ø, Denmark
2
Nokia Siemens Networks, Aalborg, Denmark
3
Nokia Siemens Networks, Kista, Sweden
*Corresponding author:
Email addresses:
PM:
H-OS:
Abstract
While operators have to upgrade the capacity of their networks, they have committed
themselves to reduce their CO
2
emissions, partly by reducing their energy consumption.
This article investigates the challenges faced by operators and quantifies, through a
number of case studies, the impact of specific solutions and how the energy consumption
trend can be expected to develop over the next decade. With different options for
upgrading capacity, studies show that a hybrid macro-pico upgrade is more energy-
efficient than a macro or pico only solution. The study is extended further by quantifying
the possible savings by adopting an energy-efficient capacity evolution together with an
equipment replacement and site upgrade strategy. Results show that network operators
Page 2 of 23
can get relatively close to their targets, with energy reductions of up to 40% noted. While
this can be improved further through software-based energy saving features, further CO
2
emissions can be offset through the use of carbon-neutral energy sources.
Keywords: Green radio; energy saving; network evolution; network upgrade; HSPA;
LTE; base station site; remote radio head.
1. Introduction
With the increasing importance of wireless communications, the need for green radio has
gained considerable traction. The reduction of CO
2
emissions has become a global
objective, with governments, companies, and the general public, all expected to play a
role and adhere to the guidelines set by the Kyoto protocol. Within many industries,
emissions are directly associated with the energy consumption. To some extent, the
growth of an industry can be measured through increasing CO
2
emissions, which for the
ICT industry is expected to double its every 4–6 years.
The telecommunications industry has taken a bold position in reducing its CO
2
emissions,
primarily by reducing the energy consumption. Energy costs have soared, making energy
bills a burden for mobile network operators (MNOs). Besides, with the expected growth
in traffic, MNOs have also got to invest and upgrade their networks, which inherently
further increases the energy consumption. Besides the financial gains, a commitment in
reducing the energy consumption also plays a public relations (PR) role. Many of the
major MNOs have pages dedicated to ‘Corporate Social Responsibility’ in which they
express commitment [1] towards the climate, environment, and a variety of other work
ethics. In regard to reducing their carbon footprint, MNOs go a step further by setting
specific targets and timelines, with Telenor [2] and Vodafone [3] aiming to reduce their
Page 3 of 23
carbon footprint by 40 and 50%, respectively.
For these reasons, MNOs and equipment vendors alike have been investigating methods
for reducing the energy consumption of mobile networks, kick-starting the concept of
green radio. The need for reducing the energy consumption provides an opportunity for
equipment vendors, who compete in offering diverse, reliable, feature-rich, and energy-
efficient equipment for supporting the deployment of new networks and the upgrade of
existing ones.
2. Base station site overview
In mobile networks, more than 80% of the energy is consumed by the network
infrastructure [2], of which more than 70% at the base station sites [4, 5]. These sites are
on the access part of the network and host equipment that enables wireless transmission
and reception, connecting subscriber mobile terminals to the core network. The reason
why these sites are responsible for so much of the overall energy consumption is twofold.
Besides having to deploy a large quantity of such sites, to ensure full network coverage,
these sites are very energy inefficient. Assuming that the effective transmitted power of a
typical 3-sector base station site is in the order of 120 W, while the total input power for
the site is in excess of 2 kW, this gives an efficiency of just 6%. Thus, the biggest saving
opportunities are likely to be achieved from optimizing base stations.
Besides the modules providing the core communication functions, base station sites also
host components that ensure the equipment is kept safe, in adequate ambient conditions,
and protected from any external interruptions. While all these components are required to
ensure reliable communication networks, they all add energy overheads, increasing
Page 4 of 23
consumption and reducing the efficiency of each site. Major technological improvements
have allowed for the availability of more energy-efficient equipment. For instance, within
base station sites, active cooling is considered to consume around 30% of the energy.
Improvements have allowed for equipment to support higher operational temperatures,
reducing or in some cases eliminating the need for active cooling. Other energy-related
improvements within base station sites include more efficient rectifiers, battery backup
units, and system designs. Overall, advancements in technology have allowed for more
compact, flexible, and efficient equipment packed with a wider array of features.
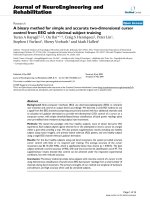
As shown in Figure 1, equipment in a base station site can be represented through a
modular structure. With regard to the core communications equipment, this is composed
of two modules, the RF module and the systems module (SM). The latter provides all
functionalities related to baseband processing, control, and backhaul transmission to the
core network. The RF module houses the power amplifiers, which in a 3G base station
are responsible for 50–65% of the energy consumption. This is partly due to the need of
power amplifiers to compromise efficiency for linearity [6]. Different site configurations
exist, depending on particular operator requirements, and restrictions at site locations. A
further energy loss at these sites is attributed to long feeder cables connecting the RF
module to the antenna. This is due to dielectric losses and skin-effect, which is mainly
dependent on the transmission frequency and cable length [7]. In most sites, feeder cable
losses of about 50% (3 dB) are assumed [8], requiring the RF module to transmit at
higher power (double) in order to ensure the desired power at the antenna. A solution to
this is to install the RF module in close proximity to the antenna, with an optical
connection linking it back to the system module. As illustrated in Figure 2, these are
known as remote radio head (RRH) units, and are often noted as small boxes mounted on
the antenna mast. Due to a number of practical restrictions, the use of RRH units is not
Page 5 of 23
possible at all sites, for reasons that may include space and positioning on the mast, rental
agreements, and visual pollution. It should be noted that even with RRH units, some
losses still arise from the shorter jumper cables, and connectors.
As in [4], a linear base station site power model is used to estimate the consumption of
the network. The model is based on measurements carried out by an equipment vendor
and considers only the RF module, and SM. The model can be split into two main
components, a load dependent and independent component. Measurements show that the
load-independent component is the most dominant, meaning that even at very low load
the power consumption of a site remains relatively high. The comparison of power
consumption at different loads is graphically represented in Figure 3. The load-
independent component arises from the base power that is required to run the equipment
itself, prior to any communications. Based on the transmitted power required at the
antenna, the PA has to be biased in a way to overcome any feeder cable losses.
P
BTS
(Watts) = N
Sectors
* [P
Load_Indep
+ (Load * P
Load_Dep
)] (1)
(P
Load_Indep
) > (P
Load_Dep
∝ P
PA_Out
) (2)
P
Antenna
= P
PA_Out
– P
Feeder_Loss
(3)
With base station sites identified as main energy consumers, a number of options for
improving their efficiency include: hardware improvement, site design, software features,
and deployment optimization.
Page 6 of 23
2.1. Base station switch off for energy saving
With traffic patterns noted to vary over a period of 24-h, the relation of power
consumption with load suggests that an efficient way to save energy during hours of low
traffic is to switch off a number of the base station sites [9]. While in residential areas,
the period of low traffic can be expected during night time, this can change depending on
the area. For instance an industrial area is expected to have less traffic already in the late
afternoon period and on weekends when people are away from work. Such a feature
would, based on the conditions of the network, select a number of sites that have a load
less than a pre-defined threshold, and systematically deactivate core components at the
site.
In a dedicated study [10], results show that over a 24-h period, switching off sites, or
individual sectors, can result in energy savings of around 30%. The idea is to power off
components that consume most energy, in particular the RF power amplifiers, and leave
active only equipment required for triggering a wakeup mechanism. The amount of
savings possible is dependent on the area, traffic patterns, and network topology. A dense
urban area with high site density is the most suitable scenario for such a feature,
specifically when applying the feature to capacity enhancing sites. While this can be
regarded as one of the most effective methods for reducing the energy consumption, this
may have an impact on the performance of the remaining sites. It is undesired for a
network operator to have subscribers note a difference in services, especially during
hours when users would expect better network conditions. Simulation results show that
even though the network can still guarantee a minimum required data rate, the energy
savings through site switch off comes at the cost of a 25% reduction in average user data
Page 7 of 23
rate. Such an impact on network performance can be limited by enabling the feature in
very dense urban areas (intersite distance approximately 300 m), and limited to pure
capacity enhancing sites. A further issue with such a feature is that existing equipment is
limited in how fast it can be switched, with existing delays in the order of a few seconds.
Other issues also being investigated include methods for transferring control between
adjacent sites and the procedure of going into and out of sleep mode.
3. Network capacity evolution
The upgrade of UMTS networks to HSPA allows for MNOs to provide reliable high
speed data services, dubbed ‘mobile broadband’. A variety of smartphones (particularly
the iPhone) provided an enriched user experience, and together with flat-rate pricing for
mobile broadband, were among the reasons why mobile broadband took off when it did.
Since then, mobile operators have been reporting annual traffic growths over their
networks ranging from 300 to 700% [11]. Besides an increase in the number of
broadband users, each user is consuming more traffic, which can be attributed to an
increase in the number of available devices (e.g., eBook readers, laptops, GPS systems,
cars), and the amount of dedicated content, especially multimedia (e.g., YouTube) and
social networking (e.g., Facebook), being made available.
As a result of this sustained data traffic growth, some MNOs are finding themselves in a
situation of approaching, in some areas, their network capacity limit. In an attempt to
avoid or at least delay this from happening, some MNOs have started to limit or abolish
completely their unlimited data plans [12]. At the same time network upgrades of various
types are being carried out where necessary. In countries where licenses have already
been auctioned off, operators have also started rolling out and testing LTE. By utilizing a
Page 8 of 23
more flexible frequency multiplexing technique (OFDM) and advanced antenna
techniques, LTE can use different carrier bandwidths of up to 20 MHz, resulting in
reduced latency, and a boost in data rates beyond the 100 Mbps mark [13]. Since the
uptake of any new technology could take a number of years, until the penetration rate of
LTE compatible devices reaches certain levels [14], traffic can still be expected to grow
on the HSPA layer. As the number of network layers increases, MNOs have to manage
and maintain all layers (including GSM) prioritizing different resources and service
levels to a variety of subscriber groups.
3.1. Available capacity options
A network site with limited capacity can result in subscribers experiencing low data rates,
long delays, and in some cases no connection. In order to avoid this, MNOs plan ahead,
estimating traffic growth, and upgrade networks. Network capacity is increased by
upgrading existing sites, and/or through the deployment of additional sites. When
possible, upgrading existing sites is preferred, since already owning the site makes it
logistically and financially simpler than commissioning an entirely new site.
Assuming an existing HSDPA network and the availability of additional spectrum,
MNOs can boost network capacity by increasing the number of active carriers (5 MHz).
Within some equipment versions, these can be supported within the same unit.
Alternatively, if additional spectrum is not available, existing sites can be upgraded
through sectorization, typically going from a 3 to 6 sector site. From a capacity point of
view, doubling the available spectrum effectively doubles the capacity of the site,
whereas increasing the number of sectors improves the spectral efficiency, but results in
lower capacity gains. Another option for operators is to deploy additional sites, which can
Page 9 of 23
vary in type, depending on the expected and type of traffic requirements in the area.
While traditional macro sites can cover large areas, smaller micro or pico sites are
intended for dense urban areas to provide high capacity hotspots. Small site deployment,
such as outdoor pico sites, reduces the extent to which surrounding macro sites need to be
upgraded. When such upgrades are not enough, MNOs can rollout a new network
technology (LTE), which is likely to be added at existing sites.
MNOs are faced with the need to make decisions about where, how, and when to upgrade
networks, in an attempt to define an appropriate evolution path. As in every other
business, operators balance network investment decisions around performance and costs.
However, since operators have committed themselves to reduce energy consumption, this
new third dimension has to now also be considered when making these decisions.
3.2. An energy-efficient approach to network evolution
To establish which network evolution path is the most energy-efficient, investigations are
carried out through case studies based on dense urban European networks. Different
techniques are considered and compared through detailed system-level downlink network
simulations. Independent on the evolution path, simulations are aimed at having the
network provide the same performance. This is achieved by assigning a key performance
indicator (KPI) which is used throughout all cases. This KPI is referred to as ‘user
satisfaction rate’, which gives the percentage of active users within the network area that
can achieve a pre-defined minimum data rate. For the network to be considered as having
a satisfactory performance, at least a 95% user satisfaction rate is required. This allows
for a fairer energy comparison for the different evolution paths. A full buffer traffic
model is used, and all base station sites are assumed to be running at 100% load. With
Page 10 of 23
regard to the radio resource management (RRM) algorithm, its first cycle attempts to
maximize the percentage of satisfied users. Since full load is assumed, requiring all
resources to be utilized, if all users achieve this minimum data rate, remaining resources
are shared in a round robin fashion. While different topologies can achieve the target
KPI, running sites at full load allows distinction with regards to average network data rate
and hence an energy-efficiency measure. In addition, this also provides a worst case
scenario from an interference point of view. Busy hour traffic is simulated by adding a
number of active users within the network area. Through statistical analysis of actual
traffic data, a traffic density map of the area is generated, and then used to distribute
active users accordingly. A more comprehensive view of the main parameters is
presented in Table 1.
In the first network evolution scenario investigated [15], macro sites are upgraded by
increasing the number of carriers, and finally MIMO. In these case studies, MIMO
performance is modeled through a second SINR to throughput mapping curve, generated
through separate system-level simulations. In a second scenario, the final upgrade is cell
sectorization, going from 3 to 6 sectors. In both cases a variant that includes the
deployment of pico sites is also considered. Pico sites are especially useful in small
spatial areas with high traffic densities. For this reason, when deploying pico sites, their
location is based on a function that combines traffic density and areas suffering low user
satisfaction rate. When considering a hybrid evolution path with new pico sites and
macro upgrades, a fixed number of pico sites are first deployed, followed by any
additional macro upgrades necessary to meet the KPI are carried out. With regard to the
energy consumption of pico sites, energy models give an approximate ratio of 5:1 for the
number of pico sites required to consume the same energy as a regular 3 sector single
carrier macro site.
Page 11 of 23
In all evolution cases, since the assumption is that all sites have the same type of
equipment, network evolution always results in increased network energy consumption.
By comparing the extent to which the energy consumption increases for the different
scenarios, it becomes clear that some paths result in lower consumption. In order to put
the capacity and data carrying capability of a network in contrast with the energy
consumption, the term ‘energy-efficiency’ is defined. For a given network under full load,
this term gives the energy cost for transferring a unit volume of traffic.
The purpose of a first HSPA evolution scenario is to determine the most energy efficient
network evolution path between macro only upgrades, and a joint macro and (out-of-
band) pico solution. In addition, the impact of different pico deployment densities is also
investigated, with three categories being considered. In the network area, pico sites are
deployed at the rate of 0 (macro only), 4, 8, or 12 sites per year.
Simulation results show that a macro only upgrade path leads to the greatest increase in
energy consumption when compared to paths that include the deployment of pico sites. In
the case when macro only upgrades are allowed, through additional carriers and MIMO,
this results in a consumption increase of around 75%. The cases of deploying 8, or 12
pico sites per year, gave comparable energy results, with the increase in consumption
limited to 30%. This mainly comes from the fact that deploying pico sites reduces the
number of macro upgrades required (Figure 4), altogether removing the need for MIMO
upgrades, the most energy expensive upgrade. When a large number of pico sites are
deployed, use of the third carrier is not necessary either, leaving the network with
possibilities of additional capacity upgrades. The heavy impact of MIMO on the energy
consumption comes from the fact that a second, in the case of 2 × 2 MIMO, parallel RF
module is required.
Page 12 of 23
A second network evolution case study is carried out on a 2 carrier HSPA layer, which in
2011 is complemented by LTE, deployed at all existing macro sites. Energy efficiency of
the network is investigated on both the HSPA and LTE layers, allowing for 6-sector
upgrades and/or the deployment of pico sites. Network evolution simulations are carried
over a period of 9 years, following a traffic prediction growth model. The reference
model portrays an average yearly traffic growth of 70%, which is considered to be on the
more aggressive side, while the second model considers an average yearly growth of
55%, leading to an overall growth over the nine-year period of ×75 and ×30, respectively.
Traffic is then split between the two layers (Figure 5), with LTE expected to surpass
HSPA in terms of carried traffic around the year 2015–2016. The latest traffic predictions
by CISCO support the aggressive traffic model, with predictions foreseeing a growth by a
factor of 26 between 2010 and 2015 [16].
In the case of an aggressive traffic growth, results show that a hybrid solution is the most
energy-efficient, on both layers, with pico sites playing the role of offloading some of the
macro sites in areas of high traffic density. By considering the rollout of LTE, and the
upgrade of both HSPA and LTE layers, this leads to an increase in the energy
consumption of the network, over a 9-year period, by 200%. In the case of a slower
traffic growth, a pico only solution is sufficient and hence more energy-efficient over
upgrading macro sites, with the increase in energy consumption limited at 132% [17].
When upgrading the network for an aggressive traffic growth with a pico only solution, it
is noted that a large number of pico sites are required to reach the required performance,
making the solution unpractical. One of the key issues with small cells is how to provide
the backhaul communication. While this depends on the country and infrastructure that
the operator has, a simple cost analysis has been carried out for the HSPA network
Page 13 of 23
evolution for different pico densities. Cost data related to the equipment, installation,
backhaul, and running costs for different upgrades are chosen based on discussions
between the equipment vendor and operator. The selected backhaul assumption reflects
the situation of most MNOs that do not own a fixed network and are required to lease
capacity from other operators. Results show that the operational costs of a network
increase dramatically as the number of deployed pico sites increase. On the other hand
the macro layer upgrades require a higher initial capital expenditure, but have lower
annual running costs [15].
4. Replacing the old with the new
In all energy-related studies it is assumed that all sites are the same, having the same
setup and type of equipment. While this can be used to give an indication of the energy
consumption of a network and the possible gains of some features, this does not represent
a realistic network energy consumption evolution trend. In a real network, MNOs manage
different network layers, the sites of which have been deployed over a number of years.
Some of the equipment at these sites has been there since the first rollout wave, whereas
others would have been deployed for capacity or coverage upgrades at a later stage.
Over the last decade, a number of technological advancements have brought considerable
equipment improvements, also in terms of energy consumption. Figure 6 gives an
overview of how the energy consumption of base station equipment, setup in the same
configuration, has evolved. This shows how two adjacent sites might have the same
configuration and capacity, but one might be more efficient than the other. Since the
rollout of 3G networks in the year 2000, a particular equipment vendor has released at
least three versions of base station equipment, with considerable improvements in
Page 14 of 23
energy-efficiency from one release to another. This improvement means that MNOs can
reduce the energy consumption of their networks simply by replacing older equipment
with modern energy-efficient versions, absorbing parts of the increase in consumption by
network upgrades. It is however interesting to understand what happens to the overall
energy consumption of the network, if old equipment is replaced throughout the
evolution of the network. Is it possible for MNOs to actually meet their targets of
reducing the energy consumption, while at the same time meeting growing traffic
demands?
4.1. Energy gains through equipment replacement
Based on the previous network evolution case study, the possible gains from equipment
replacement are investigated. In these studies, base station sites are assumed to have the
same type of equipment, specifically the version released in 2008, reference case, on
which the energy models are based. Actual network data used to setup the simulation
scenarios also reveals the type of base station equipment used at each site. For the
considered case study, the network is composed of the first two generations of the
equipment released in years 2000 and 2006, respectively.
The idea is to consider an equipment replacement strategy along the years, with the
MNOs prioritizing the replacement of older and less efficient versions of the equipment.
Network upgrades and the rollout of LTE are assumed to be carried out with the latest
available equipment at the time. Besides replacing the equipment, this study also
considers the option of upgrading sites with RRH units, an upgrade not considered in any
of the previous cases. It is assumed that all sites equipped with the 2008 and 2013
versions of the equipment, have RRH units, thus reducing the feeder cable losses from 3
Page 15 of 23
to 1 dB.
In the previous study, the upgrade of an existing HSPA network, together with the rollout
and upgrade of an LTE layer results in an increases energy consumption of 200%. This
considers an evolution period of 9 years, aggressive traffic growth prediction, and all
sites having the same equipment version. The fact that an increase in carried traffic, by a
factor of 75, can be accommodated by increasing the energy consumption of the network
by a factor of three represents a noticeable improvement in energy-efficiency, with 63%
less energy required to transfer the same volume of data. Nonetheless, in comparison
with the targets set by MNOs to reduce, and in some cases even half, their consumption,
an increase by a factor of 3 does not help meeting these objectives.
In a first step, equipment replacement is carried out in a way to prioritize the gradual
replacement of older equipment. The first version of the equipment is completely phased
out within the first 3 years of the evolution period, whereas the second version (2006) is
reduced to a 20% level, representing those sites that do not require any capacity upgrades
over the evolution period (Figure 7, left). This also reflects other possible restrictions,
primarily financial, since the operator is investing heavily in the LTE roll-out and
capacity upgrades at other sites. Phasing out the year 2000 version of the equipment gives
further savings, since it is assumed that no active cooling is required for the other
versions of the equipment due to increased operational temperatures. While the extent of
this varies from country to country, this assumption is based on the fact that in the case
study area, temperatures are always within the operational temperature range of the
equipment (–35°C to +55°C), meaning that passive cooling is sufficient for ensuring the
safe operation of the equipment [18].
Energy consumption figures show, for the case with aggressive traffic growth, that the
Page 16 of 23
increase in energy consumption can, through equipment replacement, be limited from the
original 200% to a mere 12%. In contrast to previous single equipment assumptions,
including older equipment increases the energy consumption during the first year even
further, while modern equipment and RRH reduces it in the following years, effectively
limiting the dynamic range between the first and last years. Since the same volume of
traffic is assumed, these savings increase the energy efficiency of the network, reducing
the amount of energy required for transferring the same unit volume of data.
Since the LTE layer is deployed very close to the release of a more efficient equipment
version, a variation of this investigation looks at the impact of delaying the deployment
of LTE until 2013 in order to exploit more efficient equipment (Figure 7, right). While it
is assumed that this could trigger earlier HSPA upgrades, in the final years, the split
between the two layers is kept unchanged as defined by the traffic growth model. This
deployment delay brings an energy status-quo, meaning that the increase in carried traffic
(×75) is achieved at no extra energy cost. A further best case scenario is to change all
equipment to the latest equipment when these are made available. This gives further
savings, with an overall reduction in energy consumption of 20%. This shows that a
reduction in energy consumption while increasing network capacity is in fact possible.
This amount of savings approach the targets set by some MNOs. These results and the
equivalent for the slower traffic growth model are summarized in Table 2.
5. Conclusions
While the commitment of MNOs to reduce the amount of energy used for running their
networks is undisputed, this article presents the key challenges and conflicts that exist.
Since the need for network capacity upgrades is nevertheless crucial, leading to a further
Page 17 of 23
increase in energy consumption, operators have to achieve considerable energy savings
through other methods. While no single solution is likely to put operators anywhere near
their ambitious targets, realistic gains from a number of options have been investigated.
These options include: energy-efficient network capacity evolution, energy saving
through the replacement of old base station equipment, and the possible gains and
limitations of an energy saving feature such as switching off base station sites. Results
show that it is advisable for MNOs to upgrade the capacity of their networks through a
solution that involves a combination of macro upgrades in conjunction with small cell
deployment, providing savings of 25% when compared to a macro only solution. If
during the evolution period old equipment is replaced, and upgraded with RRH, this can
result in a net energy consumption reduction ranging from 20 to 40%. On a yearly basis,
these results can be enhanced further through a range of energy saving features,
exploiting network redundancies and traffic variations. Even though a feature such as
switching off sites has potential for considerable savings (approximately 30% daily), its
implementation is currently impeded by technical limitations and risks of potential
service deterioration.
This article brings together a number of practices which demonstrate that in a realistic
network scenario, MNOs are actually capable of reducing the overall energy consumption
of their networks. While other options are available (traffic steering, Wi-Fi offloading,
etc.), the realization of these ambitious targets requires that equipment vendors keep
improving the technology and efficiency of site equipment, and that MNOs give a higher
priority to energy consumption when making network evolution decisions. In order to
reach their CO
2
emission reduction targets, it is likely that some MNOs might still need
to invest in carbon-neutral energy to offset the difference.
Page 18 of 23
Abbreviations
CO
2
, carbon dioxide; GSM, global system for mobile communications; HSPA, high
speed packet access; KPI, key performance indicator; LTE, long term evolution; MIMO,
multiple input multiple output; MNO, mobile network operator; OFDM, orthogonal
frequency-division multiplexing; PA, power amplifier; PR, public relations; RF, radio
frequency; RRH, remote radio head; RRM, radio resource management; SM, system
module.
Competing interests
The authors declare that they have no competing interests.
Acknowledgements
The authors would like to acknowledge that the work and results presented in this paper
have been carried out as part of a doctoral research project at Aalborg University,
Denmark, which is partly funded by Nokia Siemens Networks. In addition the authors
have participated in and contributed to OPERA-Net, a Celtic-Initiative European
consortium on the topic of energy saving in mobile networks. OPERA-Net has in
December 2011 been extended by 3 more years under the new name OPERA-Net2.
References
[1] Orange Labs, Towards a Greener World. (Orange Labs, 2010)
Accessed 30 Aug 2011
Page 19 of 23
[2] Operational Efficiency (Telenor 2010). />responsibility/environment-and-climate/operational-efficiency/. Accessed 30 Aug 2011
[3] Pressing Forward. Vodafone Group Plc Sustainability Report, March 2010
[4] F Richter, AJ Fehske, GP Fettweis, Energy efficient aspects of base station
deployment strategies for cellular networks. Paper presented at the 70
th
IEEE Vehicular
Technology Conference 2009, pp. 1-5, Anchorage, USA, September 2009
[5] Y Chen, S Zhang, S Xu, G Ye Li, Fundamental trade-offs on green wireless networks.
Huawei Technologies & Georgia Institute of Technology, IEEE Commun. Mag. 49(6),
pp. 30-37, 2011
[6] ABIresearch, Equipment and RF Power Device Analysis for Cellular and Mobile
Wireless Infrastructure Markets. 4Q 2010
[7] N Idir, Y Weens, J Franchaud, Skin effect and dielectric loss models of power cables.
IEEE Trans. Dielectrics Electric. Insulat. 16(1), pp. 147-154, 2009
[8] S Bhaumik, G Narlikar, S Chattopadhyay, S Kanugovi, Breathe to stay cool: adjusting
cell sizes to reduce energy consumption, Alcatel-Lucent, Green Networking, August
2010
[9] O Blume, H Eckhardt, S Klein, E Kuehn, WM Wajda, Energy savings in mobile
networks based on adaptation to traffic statistics. Bell Labs Tech. J. 15(2), pp. 77-94,
2010
[10] G Micallef, P Mogensen, HO Scheck, Cell size breathing and possibilities to
introduce cell sleep mode. Paper presented at the European Wireless 2010 Conference,
pp. 111-115, Lucca, Italy, April 2010
Page 20 of 23
[11] A Brydon, M Heath, Will 3G Networks Cope? Telecoms Market Research,
September 2009
[12] J Halliday, C Arthur, Mobile operators signal end of flat-rate data tariffs as app use
grows. The Guardian (2010), . Accessed 13 Dec 2011
[13] Nokia Siemens Networks, LTE Performance for Initial Deployments. White Paper,
www.nokiasiemensnetworks.com, 2009
[14] I Kovács, P Mogensen, B Christensen, R Jarvela, Mobile broadband traffic forecast
modeling for network evolution studies. Paper presented at the 74
th
IEEE Vehicular
Technology Conference 2011, pp. 1-5, San Francisco, September 2011
[15] G Micallef, P Mogensen, HO Sheck, E Lang, Energy efficient evolution of mobile
networks—macro-only upgrades vs. a joint-pico strategy. Paper presented at the 73
rd
IEEE Vehicular Technology Conference 2011, pp.1-5, Budapest, May 2011
[16] CISCO Visual Network Index: Global Mobile Data Traffic Forecast Update, 2010-
2015, CISCO White Paper, February 2011
[17] G Micallef, P Mogensen, HO Sheck, Energy savings through site renewal in an
HSPA/LTE network evolution scenario. Paper presented at the Wireless Innovation
Forum, MVCE Green Radio Workshop, pp. 187-191, Brussels, Belgium, 2011
[18] Nokia Siemens Networks Flexi Multiradio BTS - All-purpose Flexi BTS featuring 3
technologies in 1, Nokia Siemens Networks (2009),
. Accessed 13 Dec 2011
Figure 1. Modular overview of the components in a typical macro base station site.
Page 21 of 23
The RF and system modules are the components required for a base station site to carry
out its core communication functionalities.
Figure 2. The upgrade of macro sites to RRH involves moving the RF module close
to the antenna, reducing feeder cable length and losses. A data connection with the
system module is kept through an optical link.
Figure 3. Base station power consumption comparison for different loads values.
The plot demonstrates how the power consumption of base station sites is impacted by
load. The reference site is a regular three sector, single carrier HSPA site.
Figure 4. Network configuration at the last year of the evolution period,
highlighting the impact of increasing pico sites. A low density of pico sites is noted to
avoid the need for MIMO upgrades. Medium and high densities also avoid the need for
third carrier upgrades, with the latter requiring few upgrades.
Figure 5. Traffic growth prediction model for the aggressive case (average of 70%
annually), split between HSPA and LTE network layers. To note how the total growth
between 2010 and 2015 matches that predicted by CISCO of ×26.
Figure 6. – Site power consumption overview for different equipment versions, with
same configuration (3 sector single carrier HSPA with no MIMO and RRH). The
figure shows how over the last decade, advances in technology brought considerable
improvements, which have slowed in more recent versions.
Figure 7 – Two of the equipment replacement strategies considered for the HSPA
and LTE layers. The left side of the figure represents the regular, more conservative,
replacement strategy, whereas the right hand shows the impact of delaying the
deployment of LTE until 2013.
Page 22 of 23
Table 1. Overview of the network layout, and parameters used in setting up the
system level Monte Carlo based network simulator
Cellular layout
Realistic dense-urban scenario with 35 sites in
the investigated area. Majority of sites have 3
sectors
Simulation pixel restitution
25 × 25 m
2
Macro path loss model
Cost-Hata model + 20 dB penetration loss for
indoor users
Pico path loss model 3GPP outdoor-to-indoor model for all users
Traffic model
Full Buffer, with minimum data rate requirement of
512 kbps
Simulation KPI 95% user satisfaction (or 5% network outage)
Transmission power
macro/pico
43 dBm/30 dBm per carrier (transmission at
antenna)
Macro antenna (Gain)
3D antenna pattern with tilting values from actual
network (14 dBi)
Pico antenna (Gain) Omni-directional antenna (5 dBi)
Single carrier 2150 MHz, 5 MHz bandwidth
UE receiver type
1 × 2 Rx diversity with 2 dB body loss and 1 dB
implementation margin
Multi-user scheduling gain 1 dB
Feeder cable loss (with
RRH)
3 dB (1 dB)
Page 23 of 23
Table 2. A summary of results comparing the evolution in energy consumption in an
evolving HSPA and LTE mobile network, for two traffic growth models
Change in energy consumption between 2010 and
2018
×
××
×75 Traffic growth (%) ×
××
×30 Traffic growth (%)
Reference case +200 +132
Regular replacement +12 –3
Delay LTE to 2013 0 –21
Best case scenario –20 –38
Figure 1