báo cáo hóa học:" Research Article Virtual Prototyping and Performance Analysis of Two Memory Architectures" docx
Bạn đang xem bản rút gọn của tài liệu. Xem và tải ngay bản đầy đủ của tài liệu tại đây (2.07 MB, 12 trang )
Hindawi Publishing Corporation
EURASIP Journal on Embedded Systems
Volume 2009, Article ID 984891, 12 pages
doi:10.1155/2009/984891
Research Article
Virtual Prototyping and Performance Analysis of
Two Memory Architectures
Huda S. Muhammad1 and Assim Sagahyroon2
1 Schlumberger
2 Department
Corp., Dubai Internet City, Bldg. 14, Dubai, UAE
of Computer Science and Engineering, American University of Sharjah, Sharjah, UAE
Correspondence should be addressed to Assim Sagahyroon,
Received 26 February 2009; Revised 10 December 2009; Accepted 24 December 2009
Recommended by Sri Parameswaran
The gap between CPU and memory speed has always been a critical concern that motivated researchers to study and analyze the
performance of memory hierarchical architectures. In the early stages of the design cycle, performance evaluation methodologies
can be used to leverage exploration at the architectural level and assist in making early design tradeoffs. In this paper, we use
simulation platforms developed using the VisualSim tool to compare the performance of two memory architectures, namely, the
Direct Connect architecture of the Opteron, and the Shared Bus of the Xeon multicore processors. Key variations exist between
the two memory architectures and both design approaches provide rich platforms that call for the early use of virtual system
prototyping and simulation techniques to assess performance at an early stage in the design cycle.
Copyright © 2009 H. S. Muhammad and A. Sagahyroon. This is an open access article distributed under the Creative Commons
Attribution License, which permits unrestricted use, distribution, and reproduction in any medium, provided the original work is
properly cited.
1. Introduction
Due to the rapid advances in circuit integration technology,
and to optimize performance while maintaining acceptable
levels of energy efficiency and reliability, multicore technology or Chip-Multiprocessor is becoming the technology of
choice for microprocessor designers. Multicore processors
provide increased total computational capability on a single
chip without requiring a complex microarchitecure. As a
result, simple multicore processors have better performance
per watt and area characteristics than complex single core
processors [1].
A multicore architecture has a single processor package that contains two or more processors. All cores can
execute instructions independently and simultaneously. The
operating system will treat each of the execution cores as
a discrete processor. The design and integration of such
processors with transistor counts in the millions poses a
challenge to designers given the complexity of the task and
the time to market constraints. Hence, early virtual system
prototyping and performance analysis provides designers
with critical information that can be used to evaluate
various architectural approaches, functionality, and processing requirements.
In these emerging multicore architecture, the ability to
analyze (at an early stage) the performance of the memory
subsystem is of extreme importance to designers. The latency
resulting by the access of different levels of memory reduces
the processing speeds causing more processor stalls while the
data/instruction is being fetched from the main memory.
Ways in which multiple cores send and receive data to the
main memory greatly affect the access time and thus the
processing speed. In multicore processors, two approaches
to memory subsystem design have emerged in recent years,
namely, the AMD DirectConnect architecture and the Intel
Shared Bus architecture [2–5]. In the DirectConnect architecture, a processor is directly connected to a pool of memory
using an integrated memory controller. A processor can
access the other processors’ memory pool via a dedicated
processor-to-processor interconnect. On the other hand, in
Intel’s dual-core designs, a single shared pool of memory is at
the heart of the memory subsystem. All processors access the
pool via an external front-side bus and a memory controller
hub.
2
EURASIP Journal on Embedded Systems
2. Overview of Processors Memory Architecture
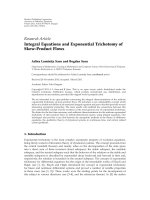
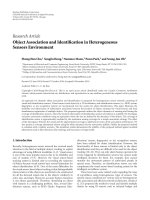
2.1. The AMD Opteron Direct Connect Architecture. The
AMD’s direct Connect Architecture used in the design of the
dual core AMD Opteron consists of three elements:
(i) an integrated memory controller within each processor, which connects the processor cores to dedicated
memory,
(ii) a high-bandwidth Hyper Transport Technology link
which goes out the computer’s I/O devices, such as
PCI controllers,
(iii) coherent Hyper Transport Technology links which
allow one processor to access another processor’s
memory controller and Hyper Transport Technology
links.
The Opteron uses an innovative routing switch and a
direct connect architecture that allows “glueless” multiprocessing between the two processor cores. Figure 1 shows
an Opteron processor along with the system request queue
(SRQ) and host bridge, Crossbar, memory controller, DRAM
controller, and HyperTransport ports [3, 8].
The Crossbar switch and the SRQ are connected to the
cores directly and run at the processor core frequency. After
an L1 cache miss, the processor core sends a request to
CPU0
64 K
I-cache
CPU1
64 K
D-cache
64 K
I-cache
1M
L2 cache
64 K
D-cache
1M
L2 cache
System request queue
HTLink
HTLink
72-bit
Memory/DRAM
controller
HTLink
Crossbar
72-bit
In this work, virtual system prototyping is used to
study the performance of these alternatives. A virtual
systems prototype is a software-simulation-based, timingaccurate, electronic systems level (ESL) model, used first
at the architectural level and then as an executable golden
reference model throughout the design cycle. Virtual systems
prototyping enables developers to accurately and efficiently
make the painful tradeoffs between that quarrelling family of
design siblings functionality, flexibility, performance, power
consumption, quality, cost, and so forth.
Virtual prototyping can be used early in the development
process to better understand hardware and software partitioning decisions and determine throughput considerations
associated with implementations. Early use of functional
models to determine microprocessor hardware configurations and architectures, and the architecture of ASIC in
development, can aid in capturing requirements, improving
functional performance and expectations [6].
In this work, we explore the performance of the two
memory architectures introduced earlier using virtual prototyping models built from parameterized library components
which are part of the VisualSim Environment [7]. Essentially,
VisualSim is a modeling and simulation CAD tool used
to study, analyze, and validate specification and verify
implementation at early stages of the design cycle.
This paper is organized as follows: in Section 2 we
provide an overview of the two processors and the corresponding memory architectures. Section 3 introduces the
VisualSim environment as well as the creation of the
platform models for the processors. Simulation Results and
the analysis of these results form Section 4 of this paper.
Conclusions are summarized in Section 5.
Figure 1: AMD dual core Opteron.
the main memory and the L2 cache in parallel. The main
memory request is discarded in case of an L2 cache hit. An
L2 cache miss results in the request being sent to the main
memory via the SRQ and the Crossbar switch. The SRQ maps
the request to the nodes that connect the processor to the
destination. The Crossbar switch routes the request/data to
the destination node or the HyperTransport port in case of
an off chip access.
Each Opteron core has a local on-chip L1 and L2
cache and is then connected to the memory controller
via the SRQ and the Crossbar switch. Apart from these
external components, the core consists of 3 integer and
3 floating point units along with a load/store unit that
executes any load or store microinstructions sent to the
core [9]. Direct Connect Architecture can improve overall
system performance and efficiency by eliminating traditional
bottlenecks inherent in legacy architectures. Legacy frontside buses restrict and interrupt the flow of data. Slower
data flow means slower system performance. Interrupted
data flow means reduced system scalability. With Direct
Connect Architecture, there are no front-side buses. Instead,
the processors, memory controller, and I/O are directly
connected to the CPU and communicate at CPU speed [10].
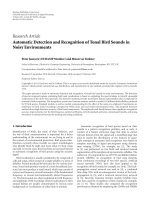
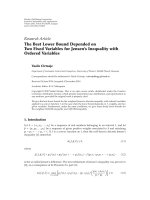
2.2. Intel Xeon Memory Architecture. The Dual-Core Intel
Xeon Processor is a 64-bit processor that uses two physical
Intel NetBurst microarchitecture cores in one chip [4]. The
Intel Xeon dual core processor uses a different memory
access technique, by including a Front-Side-Bus (FSB) to
the SDRAM and a shared L3 cache instead of having only
on-chip caches like the AMD Opteron. The L3 cache and
the two cores of the processor are connected to the FSB
via the Caching Bus Controller. This controller controls
all the accesses to the L3 cache and the SDRAM. Figure 2
below provides an overview of the Intel Dual core Xeon and
illustrates the main connections in the processor [5].
EURASIP Journal on Embedded Systems
3
3-Load system bus
Simulator
External front-side
bus interface
Architecture
Caching front-side
bus controller
Map
Traffic
16 MB
L3 cache
Core 0
(1M L2)
Analysis
Behavior
Core 1
(1M L2)
Figure 3: Block diagram of a platform model.
Figure 2: Block diagram of the dual-core Intel Xeon.
Since the L3 cache is shared, each core is able to access
almost all of the cache and thus has access to a larger amount
of cache memory. The shared L3 cache provides a better
efficiency over a split cache since each core can now use more
than half of the total cache. It also avoids the coherency traffic
between cache in a split approach [11].
3. VisualSim Simulation Environment
At the heart of the simulation environment is the VisualSim
Architect tool. It is a graphical modeling tool that allows the
design and analysis of “digital, embedded, software, imaging,
protocols, analog, control-systems, and DSP designs”. It
has features that allow quick debugging with a GUI and
a software library that includes various tools to track the
inputs/stimuli and enable a graphical and textual view of the
results. It is based on a library of parameterized components
including processors, memory controllers, DMA, buses,
switches, and I/O’s. The blocks included in the library reduce
the time spent on designing the minute details of a system
and instead provide a user friendly interface where these
details can be altered by just changing their values and not the
connections. Using this library of building blocks, a designer
can for example, construct a specification level model of a
system containing multiple processors, memories, sensors,
and buses [12].
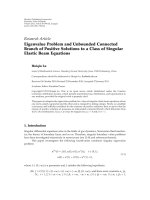
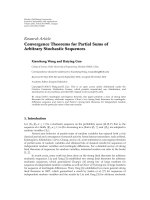
In VisualSim, a platform model consists of behavior, or
pure functionality, mapped to architectural elements of the
platform model. A block diagram of a platform model is
shown in Figure 3.
Once a model is constructed, various scenarios can be
explored using simulation. Parameters such as inputs, data
rates, memory hierarchies, and speed can be varied and
by analyzing simulation results engineers can study the
various trade-offs until they reach an optimal solution or an
optimized design.
The key advantage of the platform model is that the
behavior algorithms may be upgraded without affecting the
architecture they execute on. In addition, the architecture
could be changed to a completely different processor to see
the effect on the user’s algorithm, simply by changing the
mapping of behavior to architecture. The mapping is just a
field name (string) in a data structure transiting the model.
Models of computation in VisualSim support blockoriented design. Components called blocks execute and
communicate with other blocks in a model. Each block has
a well-defined interface. This interface abstracts the internal
state and behavior of a block and restricts how a block
interacts with its environment. Central to this block-oriented
design are the communication channels that pass data from
one port to another according to some messaging scheme.
The use of channels to mediate communication implies that
blocks interact only with the channels they are connected to
and not directly with other blocks.
In VisualSim, the simulation flow can be explained as
follows: the simulator translates the graphical depiction of
the system into a form suitable for simulation execution
and executes simulation of the system model, using user
specified model parameters for simulation iteration. During
simulation, source modules (such as traffic generators)
generate data structures. The data structures flow along to
various other processing blocks, which may alter the contents
of Data Structures and/or modify their path through the
block diagram. In VisualSim simulation continues until there
are no more data structures in the system or the simulation
clock reaches a specified stop time [7]. During a simulation
run, VisualSim collects performance data at any point in the
model using a variety of prebuilt probes to compute a variety
of statistics on performance measures.
This project uses the VisualSim (VS) Architect tool,
to carry out all the simulations and run the benchmarks
on the modeled architectures. The work presented here
utilizes the hardware architecture library of VS that includes
the processor cores, which can be configured as per our
requirements, as well as bus ports, controllers, and memory
blocks.
3.1. Models’ Construction (Systems’ Setup). The platform
models for the two processors are constructed within the VS
environment using the parameters specified in Table 1.
3.1.1. The Opteron Model. The basic architecture of the
simulated AMD dual core Opteron contains two cores with
three integer execution units, three floating point units and
4
EURASIP Journal on Embedded Systems
Table 1: Simulation models parameters.
Core Speed
Bus(Core-to-Cache) Speed
Bus(Core-to-SRQ) Speed
Crossbar Speed
FSB Speed
Bus(SRQ-to-RAM) Speed
L1 Cache Speed
L2 Cache Speed
RAM Speed
I1 Cache Size
D1 Cache Size
L2 Cache Size
AMD Opteron
2 GHz
N/A
2 GHz
2 GHz
N/A
2 GHz
(Width = 4 B)
1 GHz
1 GHz
1638.4 MHz
64 kB
64 kB
4 MB
(2 MB per core)
Intel Xeon
2 GHz
2 GHz
N/A
N/A
1066 MHz
(Width = 4 B)
N/A
1 GHz
1 GHz
1638.4 MHz
64 kB
64 kB
4 MB
(shared cache)
two loads/stores, and branch units to the data cache [2].
Moreover, the cores contain 2 cache levels with 64 kB of L1
data cache, 64 kB of L1 instruction cache, and 1 MB of L2
cache.
The constructed platform model for the AMD Opteron
is shown in Figure 4.
In the above model, the two large blocks numbered 4
and 5, respectively, are the Processor cores connected via
bus ports (blocks 6) to the System Request Queue (block
7), and then to the Crossbar switch (block 8). The Crossbar
switch connects the cores to the RAM (block 9) and is
programmed to route the incoming data structure to the
specified destination and then send the reply back to the
requesting core.
On the left block 2 components contain the input
task to the two cores. These blocks define software tasks
(benchmarks represented as a certain mix of floating point,
integer and load/store instructions) that are input to both
the processors (Opteron and Xeon) in order to test their
memory hierarchy performance. The following subsections
give a detailed description of each of the blocks, their
functionalities, and any simplifying assumptions made to
model the memory architecture.
Architecture Setup. The architecture setup block configures
the complete set of blocks linked to a single Architecture Name parameter found in most blocks. The architecture
setup block of the model (block 1) contains the details of
the connections between the fields mappings of the Data
Structure attributes as well as the routing table that contains
any of the virtual connections not wired in the model. The
architecture setup also keeps track of all the units that are a
part of the model and its name has to be entered into each
block that is a part of the model.
Core and Cache. Each core of Opteron implemented in the
project using VS is configured to a frequency of 2 GHz and
has 128 kB of L1 cache (64 kB data and 64 kB instruction
cache), 2 MB of L2 cache, and the floating point, integer, and
load/store execution units. This 2 MB of L2 cache per core is
compatible with the 4 MB of shared cache used in the Intel
Xeon memory architecture. The instruction queue length
is set to 6 and instructions are included in the instruction
set of both the cores, so as to make the memory access
comparison void of all other differences in the architectures.
These instructions are defined in the instruction block that is
further described in a later section.
Certain simplifications have been made to the core of
the Opteron in order to focus the analysis entirely on the
memory architecture of the processor. These assumptions
include the change of the variable length instructions to fixed
length micro-ops [9]. Another assumption made is that any
L1 cache miss does not result in a simultaneous request being
sent to the L2 cache and the RAM. Instead the requests are
sent sequentially, where an L1 cache miss results in an L2
cache access and finally an L2 cache miss results in a DRAM
access.
Pipeline. The pipeline of the modeled Opteron consists of
four stages, mainly the prefetch, decode, execute, and the
store. The prefetch of each instruction begins from the L1
cache and ends in a DRAM access in case of L1 and L2
cache misses. The second stage in the pipeline is the decode
stage that is implemented by introducing a delay into the
entire process. The decode stage does not actually decode
the instruction; instead the time required to decode the
instruction is added to the time comprising of the delays
from the prefetch stage to the end of the execution stage.
The third stage, the execution stage, takes place in the five
execution units that are present in the cores, and finally after
the execution, the write-back stage writes back the specified
data to the memory, mainly the L1 cache. The Pipeline Stages
(text box in Figure 5) shows the four pipeline stages that have
been defined for both cores. It also contains the configuration
of one of the cores of the Opteron along with the number of
execution units and the instruction queue length. The lower
text window depicts the details and actions of the pipeline
stages.
Crossbar Switch and the SRQ Blocks. The Crossbar switch
configured in the simulation model, is used to route the data
packets to the destination specified by the “A Destination”
field of the data structure entering the switch. The main
memory is connected to the Crossbar switch via the System
Request Queue (SRQ) block both of which are implemented
using the virtual machine scripting language available in the
VisualSim environment. The SRQ accepts only 8 requests in
the queue and does not entertain any further requests until
there is an empty space in the queue. Each core and the
SDRAM are connected to individual SRQ blocks that are in
turn connected to the crossbar switch. Figure 6 shows the
crossbar switch as the NBC Switch and the SRQ blocks as the
RIO IO Nodes which are linked to the bus ports connected
to the SDRAM and the processor cores. Figure 4 provides a
general overview of the crossbar switch and the SRQ nodes
in context of the entire model.
EURASIP Journal on Embedded Systems
5
Architectural
setup block
Instruction set block
DRAM
AMD opteron
Direct connect architecture
Dual core with SRQ and crossbar switch
U61 Plot
Digital
Plots
Parameters:
∗ Instructions: 10
∗ Idle Cycle: 1000
∗ Processor Speed: 2048.0
∗ Instruction Count: Instructions × Idle Cycle
∗ Status Messages: true
∗ Sim Time: 400s.06
1 Architecture Setup2
3
Introduction Set
Display
Generate
instructions
SoftGen
SRD to DRAM Bus
Linear Bus
Detail..
Trans Src
6
4
If Else
7
Processor1
Linear Port
8
2
9
7
SRQ Node1 Crossbar Switch
SRQ Node3
Linear Port3
DRAM
Statement
Display4
Controllers
Delay
Note:
5
The processor accesses the L 2
cache and on a cache miss accesses
the RAM
In practical:
A RAM request is sent in parallel to the
L 2 cache request and the RAM request
is cancelled on an L 2 hit
Rapid..
Out
Processor2
SRQ Node4
7
Linear Port5
Out2
Transactions source
Bus ports
Processor core
Cross bar switch
System request queue
Figure 4: Platform model for the DirectConnect Architecture.
Main Memory and the Memory Controller. In the simulation
model, the RAM has a capacity of 1 GB and has an inbuilt memory controller configured to run at a speed of
1638.4 MHz. At this speed and a block width of 4 bytes,
the transfer of data from the memory to the cache takes
place at a speed of 6.4 GB/s. This rate is commonly used in
most of the AMD Opteron processors but can be different
depending on the model of the processor. The same rate
is also used in the model of the Xeon processor. Each
instruction that the RAM executes is translated into delay
specified internally by the memory configurations. These
configurations are seen in Figure 7 in the Access Time field
as the number of clock cycles spent on the corresponding
task.
The SDRAM connects to the cores via the SRQ blocks
and the Crossbar switch which routes the SDRAM requests
from both the cores to the main memory block and then
sends a response back to the requesting core, in terms
of a text reply. This process requires a certain delay that
depends on the type of instruction sent to the SDRAM.
In case the SRQ block queue is empty, a single DRAM
response time depends on whether the instruction is a
memory read, write, read/write, or erase instruction. Each
of these instructions takes a fixed number of clock cycles to
complete and is determined in the SDRAM configuration
as determined by the Access Time field seen in Figure 7.
To separate the SDRAM access time from the cache access
time, a simplification is made such that the SDRAM
access request from the core is not sent in parallel to an
L2 cache request as in the actual Opteron; instead, the
SDRAM request is issued only after an L2 miss has been
encountered.
6
EURASIP Journal on Embedded Systems
Figure 5: Opteron processor core and pipeline configurations.
Linear Controller
Linear Port
Linear Controller
Rapid IO Node Non Block Chan SW Rapid IO Node3
Linear Port3
Display4
Linear Controller5
Rapid IO Node4
Linear Port5
Figure 6: Crossbar switch and SRQ blocks in VisualSim.
3.1.2. Xeon Model
Basic Architecture. The basic architecture of the Intel Dual
Core Xeon is illustrated in Figure 2. The corresponding
platform model is depicted in Figure 8. The two cores of
the processor are connected to the shared L2 cache and
then via the Front-Side-Bus (FSB) interface to the SDRAM.
The modeled Intel Xeon processor consists of two cores
with three integer execution units, three floating point units,
and two loads/stores and branch units to the data cache.
The same specifications used to model the Opteron cores
in VisualSim are used here as well. Besides, each core
is configured with 64 kB of L1 data cache, 64 kB of L1
instruction cache, whereas the L2 cache is a unified cache and
is 4 MB in size. The FSB interface, as seen in Figure 8, was
constructed using the Virtual Machine block in VS [7] and
EURASIP Journal on Embedded Systems
7
Figure 7: SDRAM and memory controller configurations.
Digital simulator
Plots
Parameter:
∗ Instructions: 10
∗ Idle Cycle: 1000
∗ Processor Speed: 2132.0
∗ Instruction Count: Instructions × Idle Cycle
∗ Status Messages: true
∗ Sim Time: 400s.06
Intel Xeon woodcrest architecture
Core speed: 2 GHz
Shared cache: 4 MBytes
Front-side-bus speed: 1066.0 MHz
RAM: RAMBUS 1 GBytes
U61 Plot
1 Architecture Setup
3
Detailed processor activity Introduction Set 6
Internal Bus
Trans Src
Generate
instructions
SoftGen2 2”
If Else
FrontSide Bus
4
Core1
Bus Port1
2
Statement
7
Caching bridge controller
Bus Port4
Delay
Note:
The processor accesses the L 2
cache and on a cache miss accesses
5
the RAM
In practical:
A RAM request is sent in parallel to the
L 2 cache request and the RAM request
is cancelled on an L 2 hit
Out
Core2
Linear Port5
Cache 8
9
Bus Port3 RAMBUS
Memory controller
and
RAMBUS RAM
Bus Port2
Out2
Figure 8: Shared Bus Architecture.
is connected to the internal bus which links the two cores to
the RAM via the FSB. The software generation block (block
2 on the left side of the model) contains the same tasks as the
Opteron.
Architecture Setup. The architecture setup block of the model
of the Xeon (Figure 8—block 1) is the same as the one
implemented in the Opteron and the field mappings of the
Data Structure attributes are copied from the Opteron model
to ensure that no factors other than the memory architecture
affects the results.
Core and Cache. The core implementation of the Xeon is
configured using VS to operate at a frequency of 2 GHz and
has 128 kB of L1 cache (64 kB data and 64 kB instruction
cache), 4 MB of unified and shared L2 cache [5], floating
point, integer, and load/store execution units. Here as well,
the instruction queue length is set to 6 and instructions are
8
EURASIP Journal on Embedded Systems
Figure 9: Main memory and controller configurations of the Intel Xeon.
included in the instruction set of both the cores, so as to make
the memory access comparison void of all other differences
in the architectures. These instructions are defined in the
instruction block that is described in a later section.
Certain simplifications have been made to the core of
the Xeon in order to focus the analysis entirely to the
memory architecture of the processor. The assumption made
in accessing the memory is that any L1 cache miss does not
result in a simultaneous request being sent to the L2 cache
and the RAM. Instead the requests are sent sequentially,
where an L1 cache miss results in an L2 cache access and
finally an L2 cache miss results in a RAM access.
To simplify the model and the memory access technique,
the process of snooping is not implemented in this simulation, and similar to the Opteron, no parallel requests are sent
to two memories.
Pipeline. The pipeline of the modeled Xeon consists of four
stages (similar to the Opteron model), the prefetch, decode,
execute, and the store. The prefetch of each instruction
begins from the L1 cache and ends in a RAM access in case
of L1 and L2 cache misses. The second stage in the pipeline
is the decode stage that is mainly translated into a wait stage.
The third stage, the execution stage, takes place in the five
execution units that are present in the cores, and finally after
the execution, the write-back stage writes back the specified
data to the memory, mainly the L1 cache.
Caching Bridge Controller (CBC). The CBC, block 7 of the
model is simply a bridge that connects the L2 shared cache
to the FSB [13]. This FSB then continues the link to the
RAM (block 9) from which accesses are made and the
data/instruction read is sent to the core that requested the
data. The CBC model is developed using the VisualSim
scripting language and simulates the exact functionality of
a typical controller.
Main Memory and the Memory Controller. The dual-core
Xeon contains a main memory of type RAMBUS with a
speed similar to the memory connected to the Opteron. The
size of the RAM is 1 GB and contains a built-in memory
controller. This memory controller is configured to run at
a speed of 1638.4 MHz. At this speed and a block width
of 4 bytes, the transfer of data from the memory to the
cache takes place at a speed of 6.4 GB/s. Each instruction that
the RAMBUS will carry out implies a certain delay which
has been specified internally in the memory configurations.
These configurations are seen in Figure 9 in the Access Time
field as the number of clock cycles spent executing the
corresponding task. The RAM connects to the cores via the
CBC and data or instruction requests to the RAM from either
core are sent to the main memory block via the FSB. The
RAM then sends a response back to the requesting core which
can be seen as a text reply on the displays that show the flow
of requests and replies. DRAM Access Time is the time taken
since a request is made and when the data is made available
from the DRAM. It is defined in nanoseconds by the user for
each operation like Read, Write, or a Read-Write as an access
time parameter in the Access Time field of Figure 9.
4. Results and Analysis
Following a series of experimental tests and numerical measurements using benchmarking software, published literature [14–16] discusses the performance of the AMD Opteron
when compared to the Xeon processor using physical test
beds comprised of the two processors. These three references
provide the reader with a very informative and detailed
comparison of the two processors when subjected to various
testing scenarios using representative loads.
In this work, we are trying to make the case for an
approach that calls for early performance analysis and
architectural exploration (at the system level) before committing to hardware. The memory architectures of the above
processors were used as a vehicle. We were tempted to use
EURASIP Journal on Embedded Systems
9
Table 2: Benchmark tasks [12].
Model task name
Task 0
Task 1
Task 2
Task 3
Task 4
Task 5
Task 6
Task 7
Task 8
Task 9
Task 10
Task 11
Task 12
Task 13
Task 14
Task 15
Task 16
Task 17
Task 18
Task 19
Task 20
Task 21
Task 22
Task 23
Task 24
Task 25
Task 26
Task 27
Task 28
Task 29
Task 30
Task 31
Task 32
Actual task name
DFT
DFT
DFT
CS Weighting
IR
Q Taylor Weighting
CS Weighting
IR
Q Taylor Weighting
CS Weighting
IR
Q Taylor Weighting
CS Weighting
IR
Q Taylor Weighting
CS Weighting
IR
Q Taylor Weighting
CS Weighting
IR
DFT
DFT
DFT
DFT
DFT
DFT
DFT
DFT
DFT
DFT
DFT
DFT
DFT
Task 32
Task 31
Task 30
Task 29
Task 28
Task 27
Task 26
Task 25
Task 24
Task 23
Task 22
Task 21
Task 20
Task 19
Task 18
Task 17
Task 16
Task 15
Task 14
Task 13
Task 12
Task 11
Task 10
Task 9
Task 8
Task 7
Task 6
Task 5
these architectures by the fact that there were published
results that clearly show the benefits of the Opteron memory
architecture when compared to the Xeon FSB architecture
and this would no doubt provide us with a reference against
which we can validate the simulation results obtained using
VisualSim.
Additionally, and to the best of our knowledge, we
could not identify any published work that discusses the
performance of the two memory architectures at the system
level using an approach similar to the one facilitated by
VisualSim.
Using VisualSim, a model of the system can be constructed in few days. All of the system design aspects can
be addressed using validated parametric library components.
All of the building blocks, simulation platforms, analysis, and
debugging required to construct a system are provided in a
single framework.
Task 4
Task 3
Task 2
Task 1
Task 0
0
2000
4000
6000
8000
Cycles/task (Xeon)
Cycles/task (Opteron)
Figure 10: Latency per Task (Cycles per Task).
Synopsys integrated Cossap (dynamic data flow) and SystemC (digital) into System Studio while VisualSim combines
10
EURASIP Journal on Embedded Systems
Table 3: Task latencies and Cycles/Task.
Task Name
Task
Task
Task
Task
Task
Task
Task
Task
Task
Task
Task
Task
Task
Task
Task
Task
Task
Task
Task
Task
Task
Task
Task
Task
Task
Task
Task
Task
Task
Task
Task
Task
Task
0
1
2
3
4
5
6
7
8
9
10
11
12
13
14
15
16
17
18
19
20
21
22
23
24
25
26
27
28
29
30
31
32
Latency(Opteron)
Latency(Xeon)
Cycles/Task(Opteron)
Cycles/Task(Xeon)
1.21E-7
7.713E-7
7.235E-7
6.538E-7
8.538E-7
7.358E-7
7.453E-7
8.538E-7
7.362E-7
6.783E-7
8.538E-7
6.858E-7
7.1629E-7
8.537E-7
7.298E-7
7.133E-7
8.537E-7
7.11299E-7
6.862E-7
1.5795E-6
7.4229E-7
2.6452E-6
7.4649E-7
2.6454E-6
7.4529E-7
2.6451E-6
7.523E-7
2.645E-6
7.458E-7
2.6453E-6
7.9129E-7
2.6453E-6
7.558E-7
1.27E-7
7.99E-7
7.299E-7
6.605E-7
1.027E-6
7.415E-7
7.52E-7
1.0222E-6
7.43E-7
7.051E-7
1.0241E-6
7.09E-7
7.216E-7
1.0179E-6
7.365E-7
7.196E-7
1.0251E-6
7.169E-7
6.92E-7
1.9301E-6
7.482E-7
3.3117E-6
7.769E-7
3.3002E-6
7.52E-7
3.3039E-6
7.58E-7
3.3078E-6
7.524E-7
3.3313E-6
7.976E-7
3.2723E-6
7.6189E-7
247
1579
1481
1338
1748
1506
1526
1748
1507
1389
1748
1404
1466
1748
1494
1460
1748
1456
1405
3234
1520
5417
1528
5417
1526
5417
1540
5416
1527
5417
1620
5417
1547
260
1636
1494
1352
2103
1518
1540
2093
1521
1444
2097
1452
1478
2084
1508
1473
2099
1468
1417
3952
1532
6782
1591
6758
1540
6766
1552
6774
1540
6822
1633
6701
1560
Table 4: Hit ratios.
Hit Ratios (%)
Processor 1 D 1 Hit Ratio Mean
Processor 1 I 1 Hit Ratio Mean
Processor 2 D 1 Hit Ratio Mean
Processor 2 I 1 Hit Ratio Mean
L 2 Hit Ratio Mean
Opteron
97.23
92.13
98.98
95.21
N/A
Xeon
98.37
95.11
99.92
96.14
96.36
SystemC (digital), synchronous data flow (DSP), finite state
machine (FSM), and continuous time (analog) domains.
Previous system level tools typically supported a single
modeling specific domain. Furthermore, relative to prior
generations of graphical modeling tools, VisualSim integrates as many as thirty bottom-up components functions
into a single system level, easy to use, reusable blocks, or
modules.
Finally, it is worth mentioning that results obtained using
the VisualSim environment in this work are generally in line
with results and conclusions found in the literature [14–16].
In the work reported here, Simulation runs are performed using a Dell GX260 machine with a P4 processor
running at 3.06 GHz, and a 1 Gbyte RAM.
For simulation purposes and to test the performance
of both architectures, traffic sequences are used to trigger the constructed models. These sequences are defined
data structures in VisualSim; a traffic generator emulates
application-specific traffic. The Transaction Source block in
Figures 4 and 8 is used to generate tasks that are applied to
the processors as input stimuli. These tasks are benchmarks
consisting of a varied percentage mix of integer, floatingpoint, load/store, and branch instructions. The different
percentages are inserted into the software generator’s Instruction Mix file and supplied to the processor cores. Thirty
three tasks (Table 2) were generated and used to assess
EURASIP Journal on Embedded Systems
11
Processor utilization
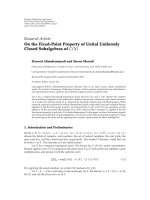
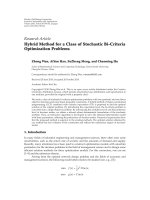
execute the same task in the Xeon were more than the
Opteron.
Figures 11 and 12 show a graph of processors’ stall
times. In both cases, 20 samples are taken during the entire
simulation period and the data collected is used in the
depicted graphs. During the execution of all the tasks, the
maximum time for which the processors stalled was different
for each kind of architecture. The maximum stall time for the
DirectConnect architecture was 2.3 microseconds whereas
for the Shared Bus architecture the maximum stall time
was 2.9 microseconds. Due to the shared bus in the Xeon’s
architecture, delays were greater than the DirectConnect
approach of the Opteron, and thus the difference in the stall
time.
As the models described earlier suggest, the Opteron
follows the split cache approach where each core in the
processor has its own L1 and L2 cache; thus no part of the
cache is shared between the two cores. On the contrary, the
Xeon processor employs the shared cached technique and
thus both the cores have access to a larger amount of cache
than the ones in the Opteron. Whenever one of the cores in
the Xeon is not accessing the shared cache, the other core has
complete access to the entire cache which results in a higher
hit ratio.
Table 4 shows the hit-ratios of both the architecture models. As the values suggest, the hit-ratios of the Xeon/Shared
cache are higher than those of the Opteron/split cache, the
reason being discussed above. It is worth mentioning that
few simplifying assumptions were made to the memory
architectures operation of both processors as discussed in
Section 3.
2.3
Core stall time mean
2.1
1.9
1.7
1.5
1.3
1.1
0.9
0.7
0.5
0.3
0.1
−0.1
0
4
8
12
16
20
24
28
32
36
Sample number
Core stall time mean
Figure 11: Processor Stall Times (Opteron).
Processor utilization
3
2.8
2.6
2.4
2.2
2
1.8
1.6
1.4
1.2
1
0.8
5. Conclusions
0.6
0.4
0
4
8
12
16
20
24
28
32
36
Sample number
Figure 12: Processor Stall Times (Xeon).
the performance of the DirectConnect and the Shared Bus
architectures.
Table 3 shows the “Task Latencies” and “Cycles/Task”
measured for both processors. Since the models were
constructed by having similar configurations in almost
every aspect except the memory architecture, the values
obtained are therefore a reflection of the performance of that
architecture. Figure 10 is a graph of the “Latency per Task”
results for each configuration. This graph is plotted using the
total number of clock cycles that were taken by each task. The
instructions contained in each of these tasks are defined in
the software generation block. At the end of the execution, a
text file is generated by VisualSim that contains the number
of cycles that were taken by each of the task, including the
stall time and the delays caused by the components linking
the RAM to the cores.
Cleary, the Xeon has exhibited a higher latency in almost
every task. These numbers show that the time taken to
In this work, we utilized a system modeling methodology
above the detailed chip implementation level that allows one
to explore different designs without having to write Verilog,
VHDL, SystemC, or simply C/C++ code. This approach
contributes to a considerable saving in time and allows for
the exploration and assessment of different designs prior to
implementation.
Since predictability of performance is critical in microprocessors design, simulation models can be used to evaluate
architectural alternatives and assist in making informed
decisions. Simulation is an acceptable performance modeling
technique that can be used to evaluate architectural alternatives and features. In this work, we used Virtual System
Prototyping and simulation to investigate the performance
of the memory subsystems of both, the Opeteron, and the
Xeon dual core processors.
Simulation results indicate that the Opteron has exhibited better latency than the Xeon for the majority of the
tasks. In all cases, it either outperformed the Xeon or at
least had similar latency. This demonstrates that using an
FSB as the only means of communication between cores and
memory has resulted in an increase in stalls and latency. On
the other hand, in the DirectConnect Architecture, the cores
being directly connected to the RAM, via the crossbar switch
and the SRQ which were running at processor speed, had
12
minimal delays. Each RAM request from either of the cores
was sent individually to the SRQ blocks and they were routed
to the RAM that had its memory controller on-chip and the
cores did not have to compete for a shared resource.
References
[1] S. Balakrishnan, R. Rajwar, M. Upton, and K. Lai, “The
impact of performance asymmetry in emerging multicore
architectures,” in Proceedings 32nd International Symposium
on Computer Architecture (ISCA ’05), pp. 506–517, Madison,
Wis, USA, June 2005.
[2] P. Conway and B. Hughes, “The AMD Opteron Northbridge
architecture,” IEEE Micro, vol. 27, no. 2, pp. 10–21, 2007.
[3] C. N. Keltcher, K. J. McGrath, A. Ahmed, and P. Conway, “The
AMD Opteron processor for multiprocessor servers,” IEEE
Micro, vol. 23, no. 2, pp. 66–76, 2003.
[4] “Dual-Core Intel Xeon Processor 5000 Series Datasheet,”
May 2006.
[5] R. Varada, M. Sriram, K. Chou, and J. Guzzo, “Design and
integration methods for a multi-threaded dual core 65nm
ˆ
XeonA processor,” in Proceedings of IEEE/ACM International
Conference on Computer-Aided Design, Digest of Technical
Papers (ICCAD ’06), pp. 607–610, San Jose, Calif, USA,
November 2006.
[6] L. Prowse-Fosler, “Virtual Systems Prototyping Ensures
Reusable Design Platforms,” />solutions-technical-papers.html.
[7] “Mirabilis Design User’s Manual,” vol. 1, />[8] “HyperTransport I/O Link Specification,” />[9] />[10] />[11] S. Rusu, S. Tam, H. Muljono, et al., “A 65-nm dual-core
multithreaded Xeon processor with 16-MB L3 cache,” IEEE
Journal of Solid-State Circuits, vol. 42, no. 1, pp. 17–24, 2007.
[12] D. Shankar, “Selecting Memory Controllers for DSP Systems,”
DSP DesignLine, May 2007.
[13] S. Tarn, S. Rusu, J. Chang, S. Vora, B. Cherkauer, and D. Ayers,
“A 65nm 95W dual-core multi-threaded Xeon processor
with L3 cache,” in Proceedings of IEEE Asian Solid-State
Circuits Conference (ASSCC ’06), pp. 15–18, Hangzhou, China,
November 2006.
[14] L. Peng, J.-K. Peir, T. K. Prakash, Y.-K. Chen, and D.
Koppelman, “Memory performance and scalability of Intel’s
and AMD’s dual-core processors: a case study,” in Proceedings
of the 27th IEEE International Performance, Computing, and
Communications Conference (IPCCC ’07), pp. 55–64, New
Orleans, La, USA, April 2007.
[15] C. S. Guiang, K. F. Milfeld, A. Purkayastha, and J. R. Boisseau,
“ Memory performance of dual-processor nodes: comparison
of Intel Xeon and AMD Opteron memory subsystem architectures,” in Proceedings for ClusterWorld Conference & Expo,
2003.
[16] “Advanced Micro Devices: AMD Opteron vs Intel Xeon Processor Performance Comparison,” />
EURASIP Journal on Embedded Systems