Advances in Optical and Photonic Devices 2011 Part 7 docx
Bạn đang xem bản rút gọn của tài liệu. Xem và tải ngay bản đầy đủ của tài liệu tại đây (1.92 MB, 25 trang )
GaAs/AlOx Nonlinear Waveguides for Infrared Tunable Generation
139
combination of high nonlinearity and long interaction length of periodically-poled LiNbO
3
has considerably increased the conversion efficiency of DFG and OPO systems based on this
crystal, making them accessible to diode laser or fiber laser pumping.
The implementation of QPM had an even stronger impact on GaAs. This semiconductor has a
χ
(2)
coefficient considerably higher than those of LiNbO
3
and of most inorganic crystals.
Nevertheless, until the last decade it was not employed for frequency conversion, since it is
neither anisotropic nor ferroelectric, and thus not readily suitable to the application of the
above phase matching schemes. In 2001, the fabrication of the first effective QPM GaAs bulk
crystals, based on lattice-matched heteroepitaxy of GaAs/Ge films on GaAs substrates (Eyres
et al., 2001), rapidly opened the way for a series of tunable infrared sources with impressive
performances. Among the results that followed from this technological innovation was the
first GaAs-based optical parametric oscillator, reported in 2004 (Vodopyanov et al., 2004). Due
to the high nonlinearity and wide transparency range of GaAs, this device was continuously
tunable between 2.2 and 9 µm (limited only by mirror reflectivity), with a maximum
conversion efficiency of 25%. Based on these recent results, GaAs appears to be mature as an
alternative to LiNbO
3
for the fabrication of infrared sources.
2.2 Integrated frequency converters for the IR generation
In terms of performances, frequency converters show substantial advantages compared to
laser diodes. They are suitable for oscillation from CW to femtosecond regimes, offer wider
tunability ranges and great flexibility, especially since the advent of periodically poled
materials. In addition, the recent demonstration of orientation-patterned GaAs promises to
extend the versatility of sources based on periodically poled LiNbO
3
to the whole mid-
infrared region. On the other hand, frequency converters are based on complex, often
cumbersome setups that considerably limit their transportability, preventing their use
outside of a laboratory setting. Despite the recent fabrication of miniaturized OPO sources,
the degree of compactness offered by room-temperature or Peltier-cooled laser diodes
remains unattainable for bulk nonlinear sources.
An intermediate solution between these two families of sources is provided by guided-wave
frequency converters, which potentially combine a compactness similar to that of
semiconductor lasers with the performances of frequency conversion. In general, nonlinear
interactions in waveguides offer several additional features, like compactness, on-chip
integration and a variety of design solutions. Moreover, the confinement of the interacting
fields on a long propagation distance results in a conversion efficiency orders of magnitude
higher compared to their bulk counterparts. On the other hand, the fabrication of
waveguides is often technologically more complex than that of bulk crystals. The key issues
are scattering losses, which can considerably limit the efficiency of nonlinear processes. In
spite of such technological drawbacks, several highly-performing integrated frequency
converters have been demonstrated to date. Similar to bulk crystals, periodically poled
LiNbO
3
has played a major role also for guided-wave generation both in the visible (through
frequency up-conversion) (Kintaka et al., 1996), and in the infrared (through down-
conversion) (Bortz et al., 1995; Hofmann et al., 1999).
With respect to LiNbO
3
and dielectric waveguides in general, GaAs integrated nonlinear
devices offer the additional potential benefit of the integration with a pumping source. A
tangible evidence of this appeal is given by the large number of integrated frequency
converters reported in the last decade. Regretfully, scattering losses have prevented GaAs
waveguides from fully developing their potential to date. This is the case of quasi phase
Advances in Optical and Photonic Devices
140
matched AlGaAs waveguides, based on the same inversion technique of bulk orientation-
patterned GaAs. The MBE growth of thin AlGaAs multilayers on GaAs/Ge templates has
recently allowed the demonstration of guided-wave quasi phase matched frequency
doubling (Yu et al., 2005). With a CW 1.55 µm pump, a normalized conversion efficiency
η
norm
= 92 % W
-1
cm
-2
was achieved, much lower than the calculated efficiency, η
norm
=500%
W
-1
cm
-2
. Such discrepancy arises from high scattering losses, due to waveguide corrugation
at the inverted domain boundaries. The resulting attenuation coefficient is of the order of 10
dB/cm, more than two orders of magnitude higher than in GaAs bulk crystals.
At present, a performing alternative to QPM in GaAs waveguides is represented by form
birefringence. This kind of integrated frequency converters, based on a strongly birefringent
guiding core, were developed in the late 90’s at the Thomson CSF (today Thales)
laboratories. By embedding in a GaAs guiding layer several low-index AlOx layers, a form-
birefringence sufficient to fulfil the phase-matching condition in the infrared was attained
(Fiore et al., 1998a). As detailed in the following, AlOx layers result from the selective
oxidation of AlAs layers embedded in the structure. Due to design versatility, this approach
has since been successfully employed to phase match either down- or up-conversion
interactions, with experimental efficiencies η
norm
up to more than 1000% W
-1
cm
-2
and
scattering losses lower than 1 cm
-1
(Moutzouris et al., 2001; Ravaro et al., 2007).
From a technological point of view, in the last decade GaAs/AlOx approach has
experienced a strong development. The very first conversion demonstrations suffered from
processing immaturity, resulting in high propagation losses. At present, the conversion
efficiency for both frequency doubling and down-conversion is comparable to that of
LiNbO
3
counterparts. Whereas a gap still remains in terms of propagation losses, last
advancements paved the way for the accomplishment of a resonant configuration.
3. GaAs/AlOx waveguides for parametric down-conversion
3.1 Form birefringence
A significant difference between TE
0
and TM
0
refractive indices n
TE0
-n
TM0
, referred to as
modal birefringence, can e.g. be achieved by fabricating waveguides with birefringent
materials, like LiNbO
3
. Nevertheless, even in the case of optically isotropic media,
waveguides are slightly birefringent, due to different boundary conditions for TE and TM
polarizations. Whereas such "form" birefringence is too weak to compensate dispersion in
frequency conversion processes, it can be greatly enhanced by designing a waveguide with
several index discontinuities.
In a periodic multilayer stack of isotropic materials, the existence of repeated discontinuities
of the refractive index along one direction breaks the original 3 axes rotation symmetry of
the constituent media and results in a macroscopic negative uniaxial crystal. With reference
to the geometry described in Figure 1, for plane waves in an infinitely extended medium,
the ordinary and extraordinary refractive indices are equal to (Born, 1980; Yeh, 1988):
n
1
Λ
h
+
n
1
Λ
h
=
n
1
n
Λ
h
+n
Λ
h
=n
2
2
2
2
1
1
2
e
2
2
2
2
1
1
2
0
(1)
GaAs/AlOx Nonlinear Waveguides for Infrared Tunable Generation
141
where n
i
and h
i
are the refractive index and the thickness of the ith (i = 1, 2) repeated layer,
and Λ the period (h
1
+ h
2
= Λ << λ, with λ the optic wavelength). The corresponding form
birefringence Δn = n
o
- n
e
depends on the duty cycle and the index contrast.
h
1
h
2
L
n
1
n
2
E
e
E
o
k
Fig. 1. Scheme of a form birefringent multilayer periodic structure.
Fig. 2. Form birefringence, in plane-wave approximation, of a multilayer periodic structure
of GaAs and a generic material of refractive index n, for three different duty cycles. The
index contrasts corresponding to GaAs/AlAs, GaAs/AlOx, and GaAs/air combinations are
pointed out.
Form-birefringent phase matching was firstly proposed in multilayer AlGaAs structures,
with a birefringence suitable to perform frequency doubling in the mid-infrared, for instance
from a CO
2
(λ = 10.6 µm) pump laser (Ziel, 1975; Ziel & Gossard, 1978). As maximum
birefringence obtained by GaAs/AlAs index contrast is not sufficient to compensate
Advances in Optical and Photonic Devices
142
dispersion near the forbidden band, near-infrared phase matching is not accessible with
these materials. The scenario changed in the early 90’s with the demonstration of selective
wet oxidation of AlAs layers embedded in GaAs (Dallesasse et al., 1990a). This process
produces polycrystalline aluminium oxide layers, with a refractive index of 1.6, whose
characteristics will be discussed more in detail in Section 4. The benefit resulting from the
obtained index contrast is illustrated in Figure 2, which shows form birefringence for a
periodic structure alternating GaAs with a lower index material.
The first achievement of form-birefringent phase matching in an AlOx-based
heterostructures was demonstrated with mid-infrared difference frequency generation from
two near-infrared guided waves (Fiore et al., 1997). Two continuous-wave pump lasers, a
Nd:YAG at 1.32 µm and a Ti:Sapphire at 1.03 µm were end-fire coupled in a GaAs/AlOx
waveguide to generate a guided mode at 4.8 µm. Afterwards, a different waveguide design
allowed the frequency doubling of a CWdye-laser in the telecom range, with a conversion
efficiency of η
norm
= 4% W
-1
cm
-2
, mainly limited by scattering losses (Fiore et al., 1998b).
After a few years of technological development, which mainly produced a significant loss
reduction, a similar device was employed to demonstrate parametric fluorescence (De Rossi
et al., 2001). In that case a CW Ti:Sapphire laser was coupled into a 3.2 mm-long waveguide
and, thanks to a peak efficiency η
norm
= 1000% W
-1
cm
-2
, a parametric fluorescence signal
around 2 µm could be detected.
3.2 Waveguide design
The main design criterion for a form-birefringent nonlinear waveguide consists in aiming at
the balance between form birefringence and overall (material+waveguide) dispersion for the
fundamental modes, at the frequencies involved. Further guidelines followed for the
multilayer waveguide design are:
- maximization of the nonlinear overlap integral: in order to improve the efficiency of a
frequency conversion process, interacting modes must have similar field distributions
with as-high-as-possible peak intensities. In addition, in AlGaAs waveguides, Al
content must be minimized, as AlGaAs χ
(2)
strongly decreases with Al content.
- minimization of propagation loss: AlOx layers are the main cause for propagation
losses in GaAs/AlOx waveguides, due to roughness at the interfaces with contiguous
crystalline layers; their number must be kept as small as possible. Scattering reduction
requires field intensity at waveguide interfaces with air be minimized as well.
It is worth noticing that the selective oxidation of an AlGaAs multilayer requires the
fulfilment of a few conditions: the thickness of layers to be oxidized must be included in a
certain range, between a few tens and a few hundreds of nanometres, for technological
reasons; in addition, as oxidation concerns not only AlAs but AlGaAs with high Al content,
all layers that are not supposed to be oxidized must have an Al content lower than a certain
minimum value (Dallesasse et al., 1990a; Dallesasse et al., 1990b)
Dispersion compensation in the near- and mid infrared requires a form birefringence of few
tenths (0.2-0.3), lower than the value calculated in plane-wave approximation for the index
contrast n
GaAs
-n
AlOx
(see Figure 2). This allows increasing the period Λ (and reducing the
number of AlOx layers) beyond the long-wavelength range (Λ << λ), in order to limit
scattering losses. Thus, the multilayer design for a given frequency conversion process is
based on the number of AlOx layers necessary to compensate dispersion for the set of
wavelengths concerned. Accordingly, the fabrication of frequency converters operating
close to GaAs forbidden band is more critical, due to large number of AlOx layers required.
GaAs/AlOx Nonlinear Waveguides for Infrared Tunable Generation
143
That is why up- and down-conversion schemes between 0.75 µm and the telecom range
have been abandoned, after the first frequency doubling report. Hereafter we refer to
GaAs/AlOx waveguides for parametric down-conversion from a 1 µm pump. Such design
has led to the most recent relevant results, and is retained as the basis for the fabrication of
an optical parametric oscillator.
According to GaAs selection rules for waveguides grown on standard (001) GaAs
substrates, second order nonlinear interactions are only possible between a combination of
two TE modes and one TM mode. As form birefringence results in a lower refractive index
for the polarization orthogonal to the layers plane, i.e. TM, the only possible phase matching
scheme in this geometry is a type I with a TM polarized pump. The phase-matching
condition for parametric generation at degeneracy reads
)mμ2(n=)mμ1(n
00
TETM
(2)
which implies that birefringence at 1 µm must compensate TE
0
overall dispersion between 1
µm and 2 µm:
Dispersion
TETE
nceBirefringe
TMTE
)mμ2(n)mμ1(n=)mμ1(n)mμ1(n
0000
(3)
For a core thickness resulting in single-mode confinement for the pump, the fulfilment of eq.
3 requires the introduction of five thin AlOx layers in the GaAs core. The thickness of the
interposed GaAs layer is then set as to precisely tune the phase-matched set of wavelengths.
The structure design for 1.064 µm pumping at degeneracy is described in Table 1. Figure 3
shows the corresponding refractive index profile, along with the resulting intensity profiles
of the interacting modes at degeneracy. Here, the form birefringence principle is pointed-
out: the TM polarization, parallel to the growth direction, is enhanced in the low index
layers, due to electric displacement vector conservation at the interfaces. On the other hand,
the TE polarization field is continuous on at the same interfaces. As a consequence, the TM
effective index is significantly reduced, while the TE one stays almost unchanged.
Lateral optical confinement is then obtained by etching 3 µm wide ridges in (110) direction.
Note that, for such width, the phase-matching condition calculated for the planar structure
is just slightly red-tuned. If needed, ridge width can be adjusted to correct a phase-matching
wavelength shift due to growth inaccuracy.
For such a device the calculated parametric gain coefficient, normalized to the root of the
power, is g/P
1/2
= 4.8 W
-1/2
cm
-1
at degeneracy. The generated signal and idler wavelengths
can then be tuned on a wide spectral region by reducing the pump wavelength with respect
Composition Thickness (nm)
GaAs Substrate
Al
0.7
Ga
0.3
As 1000
AlOx 33
GaAs 273
4×
AlOx 33
Al
0.7
Ga
0.3
As 1000
GaAs 30
Table 1. Multilayer structure for 1.064 µm pumping at degeneracy
Advances in Optical and Photonic Devices
144
Fig. 3. Vertical structure of the form birefringent parametric generator: refractive index (thin
solid line), TM
0
(thick solid line) and TE
0
(dotted line) modal profiles at λ
p
= 1.064 µm and λ
s
= λ
i
=2 λ
p
, respectively.
Fig. 4. Calculated parametric generation tuning curve.
to degeneracy (Figure 4). Compared to typical bulk nonlinear crystals, wavelength tuning in
this geometry is highly sensitive to pump wavelength. This peculiarity stems from the huge
waveguide dispersion at λ
p
, much larger than at 2 λ
p
, as clarified by the approximated
expression for the relationship between λ
p
, λ
s
, and λ
i
around degeneracy (De Rossi et al.,
2005a):
1
λ
λ
α1
λ2
λ
p
0
p
p
i,s
-±
=
(4)
where the “aperture” α of the tuning curve is given by
GaAs/AlOx Nonlinear Waveguides for Infrared Tunable Generation
145
)λ(
λ
n
)λ(
λ
n
α
0
s
TE
0
p
TM
0
0
∂
∂
∂
∂
=
(5)
In both expressions, the superscript 0 indicates values at degeneracy. Eqs. 4 and 5, which are
obtained by neglecting the second-order derivatives of the effective indices, show how a
higher (∂n
TM0
/∂λ)/(∂n
TE0
/∂λ) ratio implies a wider aperture of the tuning curve. A wide
aperture
α is strongly desirable for a tunable source, especially in the perspective of
integrating a pump laser diode, usually exhibiting limited tunability. In addition,
waveguide strong dispersion leads to somewhat reduce the down-conversion phase-
matching bandwidth, typically much wider than in type II processes, especially at
degeneracy.
4. Fabrication of GaAs/AlOx waveguides
Despite high nominal values, the efficiency of GaAs/AlOx nonlinear waveguides has been
limited so far by high propagation losses. These arise mainly from scattering at AlOx layers
interfaces. Hereafter we briefly describe the origin of this problem and the fabrication
improvements we have introduced with respect to the state of the art.
4.1 Growth and lithography
The growth of GaAs/AlAs waveguides is done by molecular beam epitaxy (MBE) for its
performances in terms of:
1.
precision on the layer thicknesses: this is crucial to achieve a given phase-matching
wavelength;
2.
abruptness of the layer interfaces: a key issue to limit scattering losses following from
oxidation of AlAs layers.
A single narrow ridge is chemically etched for lateral confinement and oxidation. Thanks to
the low superficial roughness achieved, the adoption of deeply-etched narrow structures for
lateral guidance does not imply a degradation of the waveguide transmission due to
scattering at ridge sidewalls.
Initially employed for chemical etching, H
2
SO
4
:H
2
O
2
:H
2
O solution has been successively
replaced with the more performing HBr:CH
3
COOH:K
2
Cr
2
O
7
. Besides being less selective,
the latter reduces under-etching and, above all, further improves etched surface smoothness.
A surface analysis at the atomic force microscope has revealed a roughness reduction from 3
to 2 nm rms. This amelioration represents an advantage also for the oxidation process.
Indeed, a smoother AlAs/air lateral interface is supposed to improve oxidation
kinetics, allowing a better flux of H
2
O toward the ridge core and a better release of reaction
products.
It is worth comparing the above roughness values with those recently reported for strongly
confining AlOx waveguides obtained by e-beam lithography + chlorine plasma etching
(Scaccabarozzi et al., 2006). In this case, a 6 nm rms roughness is measured on the ridge
sidewalls suggesting that, in spite of recent improvements, plasma-assisted etching does not
provide yet the same surface quality as wet etching. The latter, in spite of poor control and
reproducibility, remains a reasonable choice when low propagation losses are a priority.
Advances in Optical and Photonic Devices
146
4.2 Selective oxidation
AlAs, or more precisely, AlGaAs with high Al molar fraction gets easily oxidized if exposed
to air. (Dallesasse et al., 1990b) The resulting oxide is unstable and causes the material to
crumble. This process thus severely affects the performances of AlGaAs devices, such as
lasers and more in general waveguides, containing Al rich layers. In the early 90’s, an
attempt to accelerate this process in a wet atmosphere at high temperature, led to
demonstrate the formation of a stable native oxide (Dallesasse et al., 1990a). The so obtained
aluminum oxide, AlOx, exhibits a refractive index much lower than that of AlGaAs and it is
electrically insulating.
A buried thin AlGaAs layer can be oxidized starting from the etched sidewalls of the
waveguide. Oxidation kinetics and, structure and characteristics of the final oxide, are very
sensitive to the different parameters involved (thickness of the AlGaAs layers, Al rate,
oxidation temperature).
Optical properties of AlOx have been characterized with discrepancies in the published
results. AlOx transparency region has been unambiguously demonstrated to extend from
deep UV (about 240 nm) up to 10 μm, (Bravetti et al., 1998; Hall et al., 1999) excepted an O-H
absorption peak that we identified at 3 μm (Ravaro et al., 2008). However several different
values of the AlOx refractive index have been reported. In the NIR these are included
between 1.55 and 1.64, with a claimed dependence on the original Al composition. (Knopp
et al., 1998; Hall et al., 1999; Durand et al., 2003) This is a major issue for the design of
birefringent GaAs/AlOx nonlinear waveguides, as uncertainty on these properties affects
the phase-matching wavelength of such devices.
Selective oxidation of GaAs/AlAs waveguides is carried out in a quartz tube oven where
samples are heated at 420-430°C while the atmosphere is saturated in water vapor by a 2
l/min flux of wet N
2
. This is obtained by previously making dry N
2
pass through a water
bubbler stabilized at 70 °C.
This solution and the above novel processing technique have allowed us to further improve
the transmission characteristics of GaAs/AlOx waveguides with respect to the best results
previously reported. (De Rossi et al., 2001) This has been demonstrated by systematic losses
measurements.
4.3 Propagation loss
Compared to gradual index dielectric waveguides, high-index-contrast semiconductor
waveguides are significantly affected by scattering losses. Scattering can originate from
roughness on either the ridge sidewalls or the epitaxial layers interfaces, as well as from
bulk media inhomogeneity.
Scattered light measurements in AlOx waveguides, with a femtosecond NIR OPO, have
allowed determining the dependence of propagation losses on wavelength (Venugopal Rao
et al., 2003). In the range from 1.3 to 2.1 μm, losses were found to decrease with wavelength,
as expected for Rayleigh scattering, confirming the dominant contribution of AlOx/GaAs
interface roughness to the attenuation coefficient.
Waveguides propagation loss can be evaluated by the Fabry-Pérot technique (De Rossi et al.
2005b). This resorts to Fabry-Perot transmission fringes in the waveguide to infer the
attenuation coefficient independently on input coupling efficiency. Due to the modal
reflectivity at input and output facets, the transmission of a waveguide can be treated
analogously to that of a Fabry-Perot resonator in plane-wave approximation. In a single-mode
waveguide, for a monochromatic input, the transmission is given by the Airy function:
GaAs/AlOx Nonlinear Waveguides for Infrared Tunable Generation
147
η
)2/Φ(sin'R4)'R1(
eT
T
22
Lα2
FP
+−
=
−
(6)
where α is the modal attenuation coefficient, L the waveguide length, η the coupling
efficiency, T (R) the transmission (reflectivity) of the two facets (supposed to be equal), and
R’ = R· exp(-αL). T
FP
is a periodic function of the round-trip dephasing Φ=2k
0
N
eff
L+ Φ
0
, with
k
0
the free-space wave vector and N
eff
the effective index. By tuning the input wavelength or
the effective index (by e.g. varying the sample temperature), T
FP
oscillates between a
maximum T
max
and a minimum T
min
that depend only on R’. By measuring the contrast of
the transmission fringes:
K = (T
max
-T
min
)/ (T
max
+T
min
) (7)
R
’ is given by the relation
K
K11
'R
2
−−
= (8)
If the facet modal reflectivity R is known, the attenuation coefficient can finally be calculated as
α = ln(R/R’)/L (9)
In form birefringent GaAs/AlOx waveguides, current typical lowest propagation loss is in
the order of 0.4-0.6 cm
-1
after oxidation as compared to ≈ 0.1 cm
-1
before oxidation.
Understanding the origin of such losses is thus essential for its reduction. Taking into
account the small thickness of the AlOx layers, Transmission Electron Microscopy (TEM) is
the best suited instrument to quantify the GaAs/AlOx interfaces roughness.
4.4 Interface roughness characterization by transmission electron microscopy
The fabrication of cross-section specimens for transmission electron microscopy (TEM) is
performed with a JEOL Ion Slicer allowing the thinning of one waveguide by sample thanks
to 8 keV Ar
+
ion beam with an incident angle of 1.3°. A 2 keV Ar
+
beam at 1.0° final polish
ensures minimization of surface amorphous material. The obtained foils are analysed in a
JEM 2100F TEM field emission gun TEM operating at 200 kV. Thickness mapping is done for
each thin foil, using a Gatan Imaging Filter with 3mm aperture and the two window-based
jump ratio imaging technique (Hofer et al., 1995). Exposure time is 1 s for slit widths of 10
eV, with a beam collection angle of 11.0 mrad defined by the objective aperture. For the
interfaces characterization we use the high angle annular dark field (HAADF) STEM
imaging where the incoherently scattered electrons collected to produce an image are
sensitive to variation of the atomic number of atoms in the sample. An example of such
image is showed on figure 5.
To accurately measure the amplitude of the roughness, the following procedure is done: (I)
binary contrast enhancement of the HAADF image; (II) boundary tracing; (III) line matrix
averaging; (IV) gradient removal; and (V) autocorrelation analysis.
Binary contrast enhancement (I) relates to the unique identification of the delineated
boundary on either side of which occurs a brightness change for the adjoining of GaAs and
AlOx. A median brightness level is identified such that image pixels brighter (higher stored
values) than the median will be denoted as 1, and darker image pixels (lower stored values)
Advances in Optical and Photonic Devices
148
are denoted as 0, thereby giving a binary image. The median can be deduced in one of two
ways; by performing a trace across the image, perpendicular to the GaAs/AlOx interface, to
determine the different brightness levels on either side of the boundary, or by determining
the median in an image brightness intensity spectrum.
Boundary tracing (II) is next employed to digitally extract the coordinates of the interface
through an algorithm that first determines a point at the interface and then follows the
boundary, now defined by 0 and 1, in a systematic manner across the image from left to
right. The interface coordinates are stored in a separate array.
Such vertical line matrix averaging (III) has been performed with the data being further
subject to a linear least squares fit to remove any gradient (IV) displayed. Finally (V), it is
possible to calculate the autocorrelation function R(u) of the interface profile defined by the
function f(z): R(u)=<f(z)f(z+u)>. A gaussian fit of the autocorrelation function leads to the
mean square perturbation, σ
2
=R(0), of the boundary and its correlation length L
c
. In the
present case, values of σ
2
= 0.16 nm
2
and L
c
=44 nm were determined. The non-vanishing
thickness of the TEM samples results in a fictitious smoothing of f(z) responsible of a
diminution of those parameters evaluated at 39±18% and 20±20% for σ
2
and L
c
respectively
(Goodnick et al., 1985).
Fig. 5. HAADF image of an AlOx layer (in black) embedded in GaAs (top) and Al
0.7
Ga
0.3
As
(bottom). Rough interfaces are clearly visible with an enhanced effect at the bottom
interface.
GaAs/AlOx Nonlinear Waveguides for Infrared Tunable Generation
149
To infer Rayleigh scattering loss coefficient from these values, we adapted Lacey and
Payne’s simple model (Lacey & Payne, 1990) to our multilayer waveguide where the
attenuation coefficient is linked to
R
~
, the Fourier transform of the autocorrelation function
R(u), through the expression:
∫
−−=
π
0
02
1
3
0
22
1
2
2
2
r
θd)θcosknβ(R
~
nπ4
k
)nn)(d(Φα (10)
where n
1
and n
2
are the refractive indices of AlOx and GaAs respectively, k
0
is the wave
vector in vacuum, β is the propagation vector, θ is the photon scattering angle as regards as
the interface and φ(d) is the energy distribution of the propagating mode evaluated at the
position of the different interfaces and normalized as follow:
∫
+∞
∞−
= 1dy)y(Φ
2
(11)
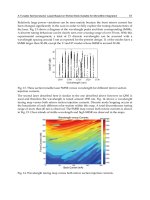
Figure 6 illustrates the variation of the loss coefficient with the value of σ
2
and L
c
in the case
of our GaAs/AlOx waveguides. The star marks the value of the loss coefficient deducted
from our TEM observations and the rectangle symbolizes the value of the loss coefficient,
taking into account the effect of smoothing occurring through the pass of electrons in the
thin foil. Our model gives a value for the propagation loss α=0.28±0.12cm
-1
. This value is in
fair agreement with experimental data suggesting that Rayleigh scattering could be the main
source of propagation losses.
Fig. 6. Variation of the loss coefficient with the mean square value of roughness and the
coherent length.
Advances in Optical and Photonic Devices
150
5. Experimental performances
In the first reports of form-birefringent frequency conversion, scattering losses did not allow
the full exploitation of the huge normalized conversion efficiency. After the last
technological advancements described above, this is now possible in mm long devices, with
overall conversion efficiencies comparable to that of LiNbO
3
waveguides. Current loss level
still prevents the use of cm long devices, which would result in even higher single-pass
efficiency and make parametric oscillation more easily accessible.
In the following we present the last advancements of parametric down-conversion in mm
long GaAs/AlOx waveguides. In section 5.1 we describe parametric fluorescence results,
with a tuning range in excess of 1 µm. In section 5.2 we detail the first parametric
amplification demonstration, which, in passing, has led to a precise determination of the
parametric gain coefficient.
5.1 Parametric fluorecence
The experiment we report here was performed with a tunable Ti:Sapphire CW pump laser
with 40 Ghz linewidth. The beam was TM polarized and coupled with a 60× microscope
objective in a GaAs/AlOx waveguide designed for phase-matching at 1.064 µm. Waveguide
length was L = 3 mm. Its output was collimated with an identical objective and passed
through an high-pass interferential filter before being injected into a spectrometer equipped
with an strained InGaAs photo-diode, whose cutoff limited the wavelength detection range
at 2400 nm.
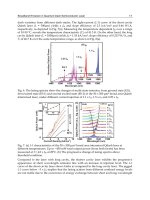
Two parametric fluorescence spectra, at degeneracy and 0.2 nm off degeneracy, are reported
in Figure 7. Besides the good signal-to-noise ratio, their sinc
2
shape demonstrates the high
uniformity of the waveguide over a few millimeter length. By acquiring parametric
fluorescence spectra for different values of λ
p
the tuning curve shown in Figure 8 (crosses)
was reconstructed. Idler wavelengths longer than 2400 nm were inferred from measured
signal and pump wavelengths, through frequency conservation. A tuning range between
1.69 µm and 2.75 µm has been obtained, limited by loss experienced by the idler mode
beyond 2.75 µm. In this spectral region AlOx exhibit an absorption band which is ascribed to
an Al hydroxide produced during wet oxidation (Ravaro et al., 2008). However, AlOx layers
are expected to be dehydroxylated through a proper thermal annealing, thus giving access
to a broader tuning range.
The experimental tuning interval above has been covered by varying λ
p
over a 12 nm
interval, with degeneracy at λ
p
= 1060.5 nm, slightly shorter than the nominal value (λ
p
=
1064 nm). These data can be reasonably fitted by a curve (solid line) obtained from effective-
index calculations for the planar structure, with the thickness t of GaAs layers as fit
parameter (t
fit
= 271 nm, instead of nominal t = 273 nm). This calculated tuning curve differs
from its experimental counterpart for a slightly lower tuning aperture, as determined with
Eq. 4: α = 2.14 for the experimental points, versus α = 1.92 for the fitting curve. We ascribe
such difference to the narrow lateral confinement of the ridge, which increases the
dispersion of the waveguide and thus the aperture of the tuning curve, with respect to the
results of 1D modeling.
Parametric tuning can also be obtained by changing the sample temperature, as shown in
Figure 9. Here experimental data are compared with a simulated curve based on AlGaAs
thermorefractive coefficients (Gehrsitz et al., 2000).
GaAs/AlOx Nonlinear Waveguides for Infrared Tunable Generation
151
Fig. 7. Parametric fluorescence experimental spectra: at degeneracy (solid line) and 0.2 nm
off degeneracy (dashed line).
Fig. 8. Parametric fluorescence tuning curve: experimental data (+) and fitting curve for a
GaAs thickness t = 271 nm (solid line).
Advances in Optical and Photonic Devices
152
Fig. 9. Temperature tuning for λ
P
= 1062 nm: experimental data (crosses) and calculated
curve (solid line).
Fig. 10. Generated signal versus pump power: the nonlinear trend of experimental data
(squares) is pointed out by the linear fit of the low power points (solid line).
Figure 10 shows the generated signal as a function of the TM coupled pump power P
p
at
degeneracy, where both vacuum fluctuations effective input and parametric gain coefficient
are maximum. The latter can be written as
(
)
cελλnnn/PΓπ8g
0sisipp
2
2
= (12)
GaAs/AlOx Nonlinear Waveguides for Infrared Tunable Generation
153
with
ρd)ρ(Φ)ρ(Φ)ρ(Φ)ρ(dΓ
isp14
∫
= (13)
the nonlinear overlap integral of the interacting mode profiles Φ
p,s,i
, ρ a vector in the
transverse plane, ε
0
the vacuum permittivity, c the velocity of light, n
p,s,i
the effective indices,
λ
p,s
the wavelengths, and subscripts p, s, i indicating pump, signal and idler, respectively.
Generated signal is expected to grow as the parametric gain at phase-matching G =
sinh
2
(gL), thus staying approximately linear in the low gain regime (gL<1), when G ≈ (gL)
2
(Boyd, 2008). Thanks to the high quality of the sample, maximum coupled pump, which is
limited by input facet optical damage, reached in this case 60 mW. Accordingly, signal
power went beyond such low-gain regime, showing the onset of a nonlinear dependence on
P
p
and reaching a maximum of 100 nW, with an internal conversion efficiency P
s
/P
p
=
(1.5±0.2)10
-6
.
5.2 Parametric amplification
Parametric amplification was demonstrated on a similar sample, with phase-matching at
degeneracy shifted at 1030 nm by using slightly thinner GaAs layers in the core (255 nm). As
for parametric fluorescence, experiments were performed at degeneracy, where parametric
gain and phase-matching bandwidth are maximum. The pump beam was provided by an
Yb:YAG mono-mode CW laser slightly tunable around 1.03 µm. The signal was obtained by
mixing in a PPLN crystal a part of the same Yb:YAG beam with a narrow-line (1.5 GHz),
CW Ti:Sapphire laser around 0.7 µm. At the PPLN output, the so obtained beam at the
difference frequency, i.e. at λ
s
≈ 2 µm, is singled-out by means of a Ge filter.
Fig. 11. Waveguide output spectra: amplified signal and idler (solid line) resulting from
pump and signal simultaneous coupling, and parametric fluorescence obtained with the
only input pump (dashed line).
Advances in Optical and Photonic Devices
154
At first, only the 100 mW (external power) TM polarized pump beam at λ
p
= 1036 nm was
injected in the waveguide. The resulting parametric fluorescence spectrum was acquired
while the sample temperature was finely tuned to exactly set parametric gain at degeneracy,
as shown in Figure 11 (dotted line). Then, the Ti:Sapphire wavelength and the PPLN
temperature were set in order to produce a signal beam at λ
s
= 2046 nm, i.e. well inside the
gain band and slightly off its center, so as to spectrally resolve signal and idler outputs. The
500 µW TE signal beam was coupled into the waveguide along with the pump, obtaining the
output spectrum reported in the same figure at a different scale (solid line). This shows the
amplified signal and a clear idler peak at difference frequency λ
i
= 2099 nm. The linewidth
of the two peaks is determined by the finite resolution of the spectrometer.
Near degeneracy, where λ
s
≈ λ
i
and G ≈ P
i
(L)/P
s
(L) in the low-gain regime, g and G can be
directly evaluated by measuring the idler to signal output ratio. In this case, in addition,
P
i
(L) and P
s
(L) can be measured with the same detector, so that their ratio is not affected by
calibration uncertainties.
Figure 12 shows the idler-to-signal ratio vs. TM coupled pump power P
p
, which is well
fitted by a straight line as expected for low-gain. The maximum parametric amplification,
obtained for P
p
≈ 30 mW, is G = 4.5 %. The slope scaled to the waveguide length L gives the
normalized parametric gain coefficient g/P
1/2
= 4.1±0.1 cm
-1
W
-1/2
.
Fig. 12 Output idler-to-signal percentage, i.e. parametric amplification, vs. coupled pump
power.
6. Toward an integrated optical parametric oscillator
6.1 Cavity configuration and oscillation threshold
The realization of the first GaAs-based waveguided OPO now faces the difficulties of
fabricating a sufficiently resonant cavity. The first choice to deal with is the design of the
GaAs/AlOx Nonlinear Waveguides for Infrared Tunable Generation
155
OPO cavity. Two common schemes are the singly-resonant OPO (SROPO) and the doubly-
resonant OPO (DROPO). In the SROPO the cavity is resonant only at signal (idler)
wavelength, i.e. R
p
≈0, R
s
≈1, R
i
≈0 (R
p
≈0, R
s
≈0, R
i
≈1), while in the DROPO both the generated
wavelengths are resonating, i.e. R
p
≈0, R
s
≈1, R
i
≈1. As the gain in the active medium is
unidirectional, the PM condition is fulfilled only when the three waves are copropagating,
signal and idler are amplified in the nonlinear crystal only in one propagation direction.
By equating cavity losses in a round trip and single-pass parametric amplification, the gain
threshold for a SROPO results (Sutherland, 1996)
[
]
)Lαexp(R12)Lg(
ss
2
th
−−≈ (14)
In a DROPO, the threshold is significantly lower:
[
]
[
]
)Lαexp(R1)Lαexp(R1)Lg(
iiss
2
th
−−−−≈ (15)
Since OPOs do not depend on a resonance of the active medium but only on frequency
conservation and on the PM condition along the cavity axis, a wide spectral range is
attainable, typically limited by the high-reflectivity band of the cavity mirrors.
According to the previous equations, and the typical parametric gain coefficient and
propagation losses of our waveguides, the steady-state pump threshold of a SROPO is
P
p
(th)
=250 mW, for a waveguide length L=3 mm and a facet reflectivity R = 95%. For a
DROPO in the same conditions, the pump threshold is one order of magnitude lower:
P
p
(th)
=23 mW. The maximum power we can couple in our waveguide, at present limited to
about 70 mW, prevents the adoption of the former configuration. However, as we already
mentioned, the standard loss coefficient of our nonlinear waveguides is 0.4-0.7 cm
-1
which
causes the minimum facet reflectivity required to vary. For a symmetric integrated
resonator, with equal signal and idler losses, the pump power threshold in a DROPO is:
2
2
p
p
norm
)th(
p
)1QQln
)2/Lαexp(1
2/α
η
1
P
⎥
⎥
⎦
⎤
⎢
⎢
⎣
⎡
⎟
⎠
⎞
⎜
⎝
⎛
−+
−−
=
(16)
where η
norm
is the waveguide normalized conversion efficiency and
)Lαexp()RR(
)Lα2exp(RR1
Q
is
is
−+
−+
=
(17)
with R
s,i
the facet reflectivity at the signal and idler wavelength, and α the signal and idler
losses. Figure 13 shows the variation of P
p
(th)
with the facet reflectivity for a typical 3 mm-
long waveguide. For the typical values of the propagation losses, the minimum reflectivity
required ranges between 84 and 95%.
6.2 Design and fabrication of the integrated mirrors
The solution we have adopted to place our nonlinear waveguide in a DROPO resonator is
the deposit of multilayer dielectric mirrors on the facets. However, such deposit on
GaAs/AlOx waveguides is made difficult by a 12% contraction of AlAs layers during
oxidation. This contraction causes an irregular surface of the waveguide facets (Durand et
Advances in Optical and Photonic Devices
156
Fig. 13. Calculated pump threshold vs. facet reflectivity, where P
p
=70mW corresponds to the
waveguides damage threshold.
al., 2003). Moreover, such shrinkage results in a mechanical stress for the whole waveguide
structure, making the adhesion of coating more critical.
Accordingly, the choice of the materials to deposit has mainly been dictated by the
reduction of the total coating thickness. We have tested two material combinations: Si and
low-index Al
2
O
3
on the one side and YF
3
and ZnS on the other side.
Three criteria were taken into account for the design of the mirrors. First, we set the signal
and idler reflectivity as high as possible. Second, we set the pump reflectivity as low as
possible in order to be able to increase the coupled pump power and to prevent a resonant
behaviour at λ
p
which could affect the OPO stability. Finally the total thickness of the
coating must be kept below 3 µm.
The mirrors have been designed with the 1D transfer matrix method (Yeh, 1988). We have
optimized the thickness of individual layers with an algorithm for the minimization of a
merit function taking into account the three criteria listed previously.
Figure 14 shows the simulated and experimental reflectivity spectrum for both solutions.
Experimental spectra, obtained for deposits on substrates, are in good agreement with the
calculated ones. R
s,i
is higher than 95% all over an interval of at least 400 nm around
λ=2.0µm and R
p
is lower than 15%.
The same types of multilayers have been deposited on the facets of waveguides. For each
deposit we noted technologic issues. The Si/Al
2
O
3
coating was detached, supposedly
because of elements specific to our waveguides and experimental conditions, namely
absorption in Si layers or poor adhesion of the coating to the facet. In the case of YF
3
/ZnS,
the adhesion on the waveguides facets was correct but we noticed the deposition of ZnS all
over the samples, tending to form small clusters on the waveguides. Those clusters were
responsible of additional Rayleigh scattering from the sides of the waveguides. This
problem is mainly due to the evaporation of ZnS that tends to diffuse easily everywhere.
Current research is done on the deposition of other couples of materials. We also investigate
the protection of the waveguides during the mirrors deposition and an effort is made on the
design of a waveguide with a different geometry to isolate the propagating modes from
additional scattering from edges.
GaAs/AlOx Nonlinear Waveguides for Infrared Tunable Generation
157
Fig. 14. Calculated and experimental reflectivity spectra for Si/Al
2
O
3
(a) and YF
3
/ZnS (b)
coatings.
7. References
Arie, A.; Fradkin-Kashi, K. & Shreberk, Y. (2002). Frequency conversion in novel materials
and its application to high resolution gas sensing.
Optics and Lasers in Engineering,
37, 2, (February 2002) 159-170, ISSN: 0143-8166
Born, M. & Wolf, E. (1980).
Principles of optics, Pergamon Press, ISBN: 978-0080264813,
Oxford
Bortz, M. L.; Arbore, M. A. & Fejer, M. M. (1995). Quasi-phase-matched optical parametric
amplification and oscillation in periodically poled LiNbO
3
waveguides. Optics
Letters, 20, 1, (January 1995) 49-51, ISSN: 0146-9592
Boyd, R. W. (2008).
Nonlinear Optics, Academic Press, ISBN: 978-0123694706, Boston
Bravetti, P.; Fiore, A.; Berger, V.; Rosencher, E.; Nagle, J. & Gauthier-Lafaye, O. (1998). 5.2–
5.6 μm source tunable by frequency conversion in a GaAs-based waveguide,
Optics
Letters
, 23, 5, (March 1998) 331-333, ISSN: 0146-9592
Chen, W. D.; Burie, J. & Boucher, D. (1999). Mid-infrared generation by optical frequency
conversion and applications to spectroscopy and air monitoring.
Spectrochimica Acta
A, 55, 10, (September 1999) 2057-2075, ISSN: 1386-1425
Dallesasse, J. M.; Holonyak, N.; Sugg, A. R.; Richard, T. A. & El-Zein, N. (1990a).
Hydrolyzation oxidation of Al
x
Ga
1−x
As-AlAs-GaAs quantum-well heterostructures
and superlattices.
Applied Physics Letters, 57, 26, (December 1990) 2844-2446, ISSN:
0003-6951
Dallesasse, J. M.; Gavrilovic, P.; Holoniak Jr., N.; Kaliski, R. W.; Nam, D. W.; Vesely, E. J. &
Burnham, R. D. (1990b). Stability of AlAs in Al
x
Ga
1-x
As-AlAs-GaAs quantum-well
heterostructures.
Applied Physics Letters, 56, 24, (June 1990) 2436-2438, ISSN: 0003-
6951
De Rossi, A.; Berger, V.; Calligaro, M.; Leo, G.; Ortiz, V. & Marcadet, X. (2001). Parametric
fluorescence in oxidized aluminium gallium arsenide waveguides.
Applied Physics
Letters
, 79, 23, (December 2001) 3758-3760, ISSN: 0003-6951
Advances in Optical and Photonic Devices
158
De Rossi, A.; Berger, V.; Leo, G. & Assanto, G. (2005a). Form birefringence phase matching
in multilayer semiconductor waveguides: tuning and tolerances.
IEEE Journal of
Quantum Electronics
, 41, 10, (October 2005) 1293-1302, ISSN: 0018-9197
De Rossi, A.; Ortiz, V.; Calligaro, M.; Lanco, L.; Ducci, S.; Berger, V. & Sagnes, I. (2005b).
Measuring propagation loss in a multimode semiconductor waveguide. Journal of
Applied Physics, 97, 7, (March 2005) 073105-1-073105-7, ISSN: 0021-8979
Durand, O.; Wyckzisk, F.; Olivier, J.; Magis, M.; Galtier, P.; De Rossi, A.; Calligaro, M.; Ortiz,
V.; Leo, G. & Assanto, G. (2003). Contraction of aluminum oxide thin layers in
optical heterostructures.
Applied Physics Letters, 83, 13, (September 2003) 2554-2556,
ISSN: 0003-6951
Eyres, L. A.; Tourreau, P. J. ; Pinguet, T. J.; Ebert, C. B.; Harris, J. S.; Fejer, M. M. ; Becouarn,
L.; Gerard, B. & Lallier, E. (2001). All-epitaxial fabrication of thick, orientation
patterned GaAs films for nonlinear optical frequency conversion.
Applied Physics
Letters
, 79, 7, (August 2001) 904-906, ISSN: 0003-6951
Fiore, A.; Berger, V.; Rosencher, E.; Bravetti, P.; Laurent, N. & Nagle, J. (1997). Phasematched
mid-infrared difference frequency generation in GaAs-based waveguides.
Applied
Physics Letters, 71, 25, (December 1997) 3622-3624, ISSN: 0003-6951
Fiore, A.; Berger, V.; Rosencher, E.; Bravetti, P. & Nagle, J. (1998a). Phase-matching using an
isotropic nonlinear material.
Nature 391, 6691, (January 1998) 463-466, ISSN: 0028-
0836
Fiore, A.; Sanz, J.; Delobel, L.; van der Meer, P.; Bravetti, P.; Berger, V.; Rosencher, E. &
Nagle, J. (1998b). Second-harmonic generation at λ= 1.6
µm in AlGaAs/Al
2
O
3
waveguides using birefringence phase matching.
Applied Physics Letters, 72, 23,
(June 1998) 2942-2944, ISSN: 0003-6951
Gehrsitz, S.; Reinhart, F. K.; Gourgon, C.; Herres, N.; Vonlanthen, A. & Sigg, H. (2000). The
refractive index of Al
x
Ga
1–x
As below the band gap: Accurate determination and
empirical modelling.
Journal of Applied Physics, 87, 11, (June 2000) 7825-7837, ISSN:
0021-8979
Gisin, N.; Ribordy, G.; Tittel, T. & Zbinden, H. (2002). Quantum Criptography.
Review of
Modern Physics, 74, 1, (January 2002) 145-195, ISSN: 0034-6861
Goodnick, S. M.; Ferry, D. K.; Wilmsen, C. W.; Liliental, Z.; Fathy, D. & Krivanek, O. L.
(1985). Surface roughness at the Si(100)-SiO
2
interface, Physical Review B, 32, 12,
(December 1985) 8171-8186, ISSN: 1098-0121
Hall, D. C.; Wu, H.; Kou, L.; Luo, Y.; Epstein, R. J.; Blum, O. & Hou, H. (1999). Refractive
index and hygroscopic stability of Al
x
Ga
1–x
As native oxides. Applied Physics Letters,
75, 8, (August 1999) 1110-1112, ISSN: 0003-6951
Hofer, F.; Warbichler, P. & Grogger, W. (1995). Imaging of nanometer-sized precipitates in
solids by electron spectroscopic imaging.
Ultramicroscopy, 59, 1-4, (July 1995) 15-31,
ISSN: 0304-3991
Hofmann, D.; Schreiber, G.; Grundkötter, W.; Ricken, R. & Sohler, W. (2000) Mid-infrared
continuous-wave singly resonant optical parametric oscillator with periodically
poled Ti:LiNbO
3
waveguide, Conference on Lasers and Electro-Optics Europe, paper
CDM4, ISBN: 0-7803-6319-1, Nice, September 2000, IEEE
Kintaka, K.; Fujimura, M.; Suhara, T. & Nishihara, H. (1996). High-efficiency LiNbO
3
waveguide second-harmonic generation devices with ferroelectric-domain-inverted
GaAs/AlOx Nonlinear Waveguides for Infrared Tunable Generation
159
gratings fabricated by applying voltage. Journal of Ligthwave Technology, 14, 3
(March 1996), 462-469, ISSN: 0733-8724
Knopp, K. J.; Mirin, R. P.; Christensen, D. H.; Bertness, K. A.; Roshko, A. & Synowicki, R. A.
(1998). Optical constants of (Al
0.98
Ga
0.02
)
x
O
y
native oxides. Applied Physics Letters, 73,
24 (December 1998) 3512-3514, ISSN: 0003-6951
Lancaster, D. G.; Richter, D. & Tittel, F. K. (1999). Portable fiber-coupled diode-laser-based
sensor for multiple trace gas detection.
Applied Physics B, 69, 5-6, (December 1999)
459-465, ISSN: 1432-0649
Lacey, J. P. R. & Payne, F. P. (1990). Radiation loss from planar waveguides with random
wall imperfections.
IEE Proceedings, 137, 4, (August 1990) 282-288, ISSN: 1350-2433
Moutzouris, K.; Rao, S. V.; Ebrahimzadeh, M.; De Rossi, A.; Berger, V.; Calligaro, M. & Ortiz,
V. (2001). Efficient second-harmonic generation in birefringently phase-matched
GaAs/Al
2
O
3
waveguides. Optics Letters, 26, 22, (November 2001) 1785-1787, ISSN:
0146-9592
Ravaro, M.; Le Dû, M.; Likforman, J P.; Ducci, S.; Berger, V. & Leo, G. (2007). Estimation of
parametric gain in GaAs/AlOx waveguides by fluorescence and second harmonic
generation measurements,
Applied Physics Letters, 91, 19, (November 2007) 191110-1-
191110-3, ISSN: 0003-6951
Ravaro, M.; Guillotel, E.; Le Dû, M.; Manquest, C.; Marcadet, X.; Ducci, S.; Berger, V. & Leo,
G. (2008). Nonlinear measurement of mid-IR absorption in AlOx waveguides.
Applied Physics Letters, 92, 15,( April 2008) 151111-1-151111-3, ISSN: 0003-6951
Scaccabarozzi, L.; Fejer, M. M.; Huo, Y.; Fan, S.; Yu, X. & Harris, J. S. (2006). Enhanced
second-harmonic generation in AlGaAs/Al
x
O
y
tightly confining waveguides and
resonant cavities.
Optics Letters, 31, 24, (December 2006) 3626-3628, ISSN: 0146-9592
Sergienko, A. & Jaeger, G. S. (2003). Quantum information processing and precise optical
measurement with entangled-photon pairs,
Contemponary Physics, 44, 4, (July 2003)
341-356, ISSN: 1366-5812
Sorokina, I. T. & Vodopyanov, K. L. (2003).
Solid-State Mid-Infrared Laser Sources, Springer,
ISBN: 978-3540006213, New-York
Sutherland, R. L. (2003).
Handbook of Nonlinear Optics, Marcel Dekker, ISBN: 978-0824742435,
New York
Venugopal Rao, S.; Moutzouris, K.; Ebrahimzadeh, M.; De Rossi, A. ; Gintz, G.; Calligaro,
M.; Ortiz, V. & Berger, V. (2003). Influence of scattering and two-photon absorption
on the optical loss in GaAs/Al
2
O
3
nonlinear waveguides measured using
femtosecond pulses.
IEEE Journal of Quantum Electronics, 39, 3, (March 2003) 478-
486, ISSN: 0018-9197
Vodopyanov, K. L.; Levi, O.; Kuo, P. S.; Pinguet, T. J.; Harris, J. S.; Fejer, M. M.; Gerard, B.;
Becouarn, L. & Lallier, E. (2004). Optical parametric oscillation in quasi-phase-
matched GaAs,
Optics Letters, 29, 16, (August 2004) 1912-1914, ISSN: 0146-9592
Yeh, P. (1988).
Optical waves in layered media. Wiley, ISBN: 978-0471828662, New York
Yoo, S. J. B. (1996). Wavelength conversion technologies for WDM network applications.
Journal of Ligthwave and Technology, 14, 6, (June 1996) 955-966, ISSN: 0733-8724
Yu, X.; Scaccabarozzi, L.; Harris Jr., J. S.; Kuo, P. S. & Fejer, M. M. (2005) Efficient continuous
wave second harmonic generation pumped at 1.55 μm in quasi-phase-matched
AlGaAs waveguides,
Opt. Express 13, 26, (December 2005) 10742-10748, ISSN: 1094-
4087
Advances in Optical and Photonic Devices
160
van der Ziel, J. P. (1975). Phase-matched Harmonic Generation in a Laminar Structure with
Wave Propagation in the plane of the Layers,
Applied Physics Letters, 26, 2, (January
1975) 60-61, ISSN: 0003-6951
van der Ziel, J. P. & Gossard, A. C. (1978). Optical birefringence of ultrathin AlGaAs-GaAs
Multilayer Heterostructures.
Journal of Applied Physics, 49, 5, (May 1978) 2919-2921,
ISSN: 0021-8979
9
Waveguide Photodiode (WGPD)
with a Thin Absorption Layer
Jeong-Woo Park
Electronics and Telecommunications Research Institute
Republic of Korea
1. Introduction
Surface illumination photodiode (PD) shows the tradeoff between quantum efficiency and
transit time. This is because a thin absorber region is required for a short carrier transit time
whereas a thick absorber region is required for high quantum efficiency. In order to achieve
good quantum efficiency the absorption region should be ~2μm, which results in a transit
time bandwidth of <12GHz. Waveguide photodiodes can overcome this limitation because
the thickness of the absorbing region has little effect on the internal quantum efficiency if the
absorber region is long enough. WGPDs, in which the quantum efficiency and transit time
are decoupled, can overcome this restriction. In this type of devices, the external quantum
efficiency is determined principally by the input coupling efficiency because the internal
quantum efficiency can close to 100%.
Coupling into WGPDs can be broadly categorized as side-illumination and evanescent
coupling. In Figure 1, three types of coupling scheme for WGPDs are shown. Those include
a) side illumination type, b) evanescent coupling type, and c) side illumination with a thin
absorption/core region. For side illumination, light is focused directly onto the edge of the
absorbing layer. With this approach, a responsivity of 0.85A/W and 50-GHz bandwidth has
been reported (K. Kato et al, 1992). In the report, he used a multimode waveguide in a
transverse direction to acquire a higher coupling efficiency than in a typical p-i-n structure.
A primary disadvantage of this type of device is poor optical power capability compared to
evanescent coupling approach. Evanescently-coupled photodiodes have demonstrated
responsivity up to 0.75A/W with a bandwidth of 42GHz (F. Xia et al, 2001). As another
evanescently-coupled photodiode, an etched short multimode graded index waveguide
approach has shown a responsivity of 0.96A/W and 40GHz bandwidth (T. Takeuchi et al,
2001). A similar approach that integrates a short planar diluted waveguide with an etched
input facet has shown 0.73A/W responsivity and 47GHz bandwidth (M. Achouche et al,
2003). The responsivity of 1.02A/W and 48GHz bandwidth has been achieved with a short
multimode input waveguide that consists of a diluted waveguide and two optical matching
layers (S. Demiguel et al, 2003).
In this chapter, a new WGPD with a thin absorption layer will be introduced. Also, methods
of design and optimizations for this new type of WGPD are described. A responsivity of
1.08A/W was achieved at 1550nm wavelength, which corresponds to an external quantum
efficiency of 86.4% with TE/TM polarization dependence less than 0.25dB. For the same
device, the bandwidth was ~40GHz. Also, nonlinearity of the device was characterized.
Advances in Optical and Photonic Devices
162
Fig. 1. three types of coupling scheme for WGPDs. a) side illumination, b) evanescent
coupling, and c) side illumination with a thin absorption/core region.
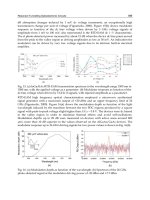
2. High responsivity
The guided mode of a waveguide with thin core layer has a larger beam size than that with
thick core layer as indicated in Figure 2. This property can be profitably applicable to InP
based high responsivity WGPD. Figure 2 shows simulated beam size of guided mode for
waveguide structure with InGaAs core/InGaAsP(λg=1.4μm) clad and InGaAs core/InP
clad. Beam size is defined at the point, at which field amplitude is reduced down to 1/e of its
maximum amplitude. As shown in Figure 2, for core thickness of less than 0.2μm, guided
beam size is enlarged.
The enlarged beam size is well matched with other large sized waveguide, such as optical
fiber, silica planar waveguide, or polymer planar waveguide. This property can be applied
to overcoming the beam size mismatch between InP based semiconductor waveguides and
other waveguides such as optical fiber, silica planar waveguide, or polymer planar
waveguide. Using a thin core layer, optical coupling between WGPDs and external
waveguides can also enhance a external quantum efficiency, or responsivity.
Waveguide Photodiode (WGPD) with a Thin Absorption Layer
163
0.0 0.2 0.4 0.6 0.8 1.0
0
1
2
3
4
5
InGaAs core, InP clad
InGaAs core, InGaAsP(
λ
g
=1.4μm) clad
1/e beam width [μm]
Core layer thickness [μm]
Fig. 2. Two dimensional simulated beam sizes (field amplitude is down to 1/e of maximum
amplitude) for InGaAs core, InGaAsP(λ
g
=1.4μm) core and InP clad.
For conform of high coupling efficiency between optical fiber and WGPDs with a thin core
layer, four types of WGPDs were fabricated and responsivity for each devices were
measured. Figure 3 shows waveguide structures of four different types of WGPDs. Total
undoped layer surrounding InGaAs absorption layer was 0.6μm thick for each type of
WGPDs. Mesa etching was done past to absorption layer to define deep ridge waveguide.
After polyimide passivation and contact opening, Ti/Pt/Au p-electrode was evaporated
and rapid-annealed. After Ti/Pt/Au n-electrode evaporation, rapid-annealing were
performed. After cleavage, each WGPDs are anti-reflection-coated. Widths of input facet
waveguides were 20μm.
Table (I) shows measured responsivity with coupling of lensed fiber and flat-ended fiber.
First, responsivity measured at the wavelength of 1550nm, was 0.815A/W for Type (II),
which was 300μm long. The calculated vertical mode coupling efficiency, η
v
was 65% for
Type (II). Horizontal mode coupling efficiency, η
h
, is 100% because width of WGPD is wider
than that of flat-ended fiber. Thus, total coupling efficiency, η
=
η
h
η
v
, is 65%. The coupling
efficiency of 65% is corresponding to responsivity of 0.81A/W, which well agrees with
measured responsivity of 0.815A/W. For Type (II), polarization dependency was less than
0.25dB. This value of less than 0.25dB is originated from different coupling efficiency
between TE and TM mode input. Another WGPD with absorption layer thickness of 0.2μm
shows similar polarization dependency of 0.25dB. This indicates that 300Å thick absorption
layer have a bulk absorption behavior rather than quantum well absorption behavior.
However, Type (I), which has 100Å thick absorption layer thickness, shows quantum well
absorption behavior. Figure 4 shows the polarization dependent responsivity curve. For
comparison, polarization dependency of Type (II) is drawn together. In Figure 4, x-axis is ε,
the parameter on Poincarè sphere, which represents the linear polarization state of input
light and y-axis is normalized responsivity with respect to maximum responsivity, in dB
unit. The calculated TE/TM difference of coupling efficiency for Type (I) is 0.202dB. Thus,
polarization dependency of Type (I), shown in Figure 4, is originated from absorption
coefficient difference between TE and TM mode. The comparison of polarization
dependence for Type (I) and Type (II) indicates that WGPD with thin absorption layer
should have more than 100Å thick absorption layer for polarization independent operation.