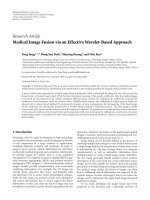
báo cáo hóa học:" Research Article Medical Image Fusion via an Effective Wavelet-Based Approach" pptx
Bạn đang xem bản rút gọn của tài liệu. Xem và tải ngay bản đầy đủ của tài liệu tại đây (5 MB, 13 trang )
Hindawi Publishing Corporation
EURASIP Journal on Advances in Signal Processing
Volume 2010, Article ID 579341, 13 pages
doi:10.1155/2010/579341
Research Article
Medical Image Fusion via an Effective Wavelet-Based Approach
Yong Yang,
1, 2, 3
Dong Sun Park,
2
Shuying Huang,
4
and Nini Rao
3
1
School of Information Technology, Jiangxi University of Finance and Economics, Nanchang, Jiangxi 330013, China
2
Department of Electronics and Information Engineering, Chonbuk National University, Jeonju, Jeonbuk 561-756, Republic of Korea
3
School of Life Science and Technology, University of Electronic Science and Technology of China, Chengdu 610054, China
4
School of Software and Communications Engineering, Jiangxi University of Finance and Economics, Nanchang, Jiangxi 330013, China
Correspondence should be addressed to Yong Yang,
Received 30 July 2009; Revised 27 October 2009; Accepted 10 March 2010
Academic Editor: A. Enis Cetin
Copyright © 2010 Yong Yang et al. This is an open access article distributed under the Creative Commons Attribution License,
which permits unrestricted use, distribution, and reproduction in any medium, provided the original work is properly cited.
A novel wavelet-based approach for medical image fusion is presented, which is developed by taking into not only account the
characteristics of human visual system (HVS) but also the physical meaning of the wavelet coefficients. After the medical images
to be fused are decomposed by the wavelet transform, different-fusion schemes for combining the coefficients are proposed:
coefficients in low-frequency band are selected with a visibility-based scheme, and coefficients in high-frequency bands are
selected with a variance based method. To overcome the presence of noise and guarantee the homogeneity of the fused image,
all the coefficients are subsequently performed by a window-based consistency verification process. The fused image is finally
constructed by the inverse wavelet transform with all composite coefficients. To quantitatively evaluate and prove the performance
of the proposed method, series of experiments and comparisons with some existing fusion methods are carried out in the paper.
Experimental results on simulated and real medical images indicate that the proposed method is effective and can get satisfactory
fusion results.
1. Introduction
Nowadays, with the rapid development in high-technology
and modern instrumentations, medical imaging has become
a vital component of a large number of applications,
including diagnosis, research, and treatment. In order to
support more accurate clinical information for physicians
to deal with medical diagnosis and evaluation, multimodal-
ity medical images are needed, such as X-ray, computed
tomography (CT), magnetic resonance imaging (MRI), mag-
netic resonance angiography (MRA), and positron emission
tomography (PET) images [1]. These multimodality medical
images usually provide complementary and occasionally
conflicting information. For example, the CT image can
provide dense structures like bones and implants with
less distortion, but it cannot detect physiological changes,
while the MR image can provide normal and pathological
soft tissues information, but it cannot support the bones
information. In this case, only one kind of image may not
be sufficient to provide accurate clinical requirements for the
physicians. Therefore, the fusion of the multimodal medical
images is necessary and it has become a promising and very
challenging research area in recent years [2, 3].
Imagefusioncanbebroadlydefinedastheprocessof
combing multiple input images or some of their features into
a single image without the introduction of distortion or loss
of information [4]. The aim of image fusion is to integrate
complementary as well as redundant information from
multiple images to create a fused image output. Therefore,
the new image generated should contain a more accurate
description of the scene than any of the individual source
images and is more suitable for human visual and machine
perception or further image processing and analysis tasks [5].
For medical image fusion, the fusion of images can often
lead to additional clinical information not apparent in the
separate images. Another advantage is that it can reduce the
storage cost by storing just the single fused image instead of
multisource images.
So far, many techniques for image fusion have been
proposed in the literature and a thorough overview of
2 EURASIP Journal on Advances in Signal Processing
these methods can be viewed in [6]. According to the
stage at which the combination mechanism takes place,
the image fusion methods can be generally grouped into
three categories, namely, pixel level or sensor level, feature
level, and decision level [7]. Since the pixel level fusion
has the advantage that the images used contain the original
measured quantities, and the algorithms are computationally
efficient and easy to implement, the most image fusion appli-
cations employ pixel level-based methods [8]. Therefore, in
this paper, we are still concerned about pixel level fusion, and
when the terms “image fusion” or “fusion” are used, pixel-
level fusion is intended.
The simplest way of image fusion is to take the average of
the two images pixel by pixel. However, this method usually
leads to undesirable side effectsuchasreducedcontrast
[9]. More robust algorithm for pixel level fusion is the
weighted average approach. In this method, the fused pixel is
estimated as the weighted average of the corresponding input
pixels. However, the weight estimation usually requires a
user-specific threshold. Other methods have been developed,
such as intensity-hue-saturation (IHS), principal component
analysis (PCA), and the Brovey transform [10]. These
techniques are easy to understand and implement. However,
although the fused images obtained by these methods
have high spatial quality, they usually suffer from spectral
degradation; that is, they can yield high spatial resolution-
fused image, but they overlook the high quality of spectral
information which is especially crucial for remote sensing
image fusion [10]. Artificial neural network (ANN) has
also been introduced to make image fusion, as seen in
[11]. However, the performance of ANN depends on the
sample images and this is not an appealing characteristic.
Yang et al. used a statistical approach to fuse the images
[12]; however, in his method the distortion is modeled as
a mixture of Gaussian probability density functions (pdfs)
which is a limiting assumption. Because the real-world
objects usually contain structures at many different scales or
resolutions and mutilresolution or multiscale approaches can
provide a means to exploit this fact, the multiresolution tech-
niques have then attracted more and more interest in image
fusion.
The multiresolution techniques involve two kinds, one
is pyramid transform; another is wavelet transform. In the
pyramid fusion, the input images are first transformed into
their multiresolution pyramid representations. The fusion
process then creates a new fused pyramid from the input
image pyramids in a certain fusion rule. The fused image
is finally reconstructed by performing an inverse multires-
olution transform. Examples of this approach include the
Laplacian pyramid [13], the gradient pyramid [14], the
contrast pyramid [15], the ratio-of-low-pass pyramid [16],
and the morphological pyramid [17]. However, for the
reason of the pyramid method fails to introduce any spatial
orientation selectivity in the decomposition process, the
above mentioned methods often cause blocking effects in
the fusion results [18]. Matsopoulos et al. earlier applied
the morphological pyramid method to fuse the MR and
CT images [19], but this method can occasionally create
many undesired edges. Another family of the multiresolution
fusion techniques is the wavelet-based method, which usu-
ally used the discrete wavelet transform (DWT) in the fusion.
Since the DWT of image signals produces a nonredundant
image representation, it can provide better spatial and
spectral localization of image information as compared to
other multiresolution representations. The research results
reveal that DWT schemes have some advantages over pyra-
mid schemes such as increased directional information, no
blocking artifacts that often occur in pyramid fused images;
better signal-to-noise ratios [11]. Therefore, the wavelet-
based method has been popular widely used for image
fusion [5, 18, 20–23], and two detailed surveys can be seen
in [24, 25]. Although there are considerable wavelet-based
fusion works today, most of them concerned on remote
images, multifocus images, and infrared images, while less
work has been done for medical images. Yu et al. fused
the medical images by the wavelet-based method with a
maximum-selection fusion rule [26], which is similar to
Burt’s method [14]. However, this method suffers from the
noise and artifacts as they tend to have higher contrast.
Qu et al. used the modulus maxima selection criteria for
the wavelet transform coefficients in the medical image
fusion [27
]. The disadvantage of this method is that they
consider only wavelet coefficients (pixel) values while making
decisions about constructing the fused image [28]. More
recently, Cheng et al. proposed a weighted wavelet-based
method for fusion of PET and CT images [29]. However,
their method confronted with the problem of selecting the
parameters of weight; that is to say their method depended
on the weights given by the user. Therefore, different weights
will lead to different fused results.
In this paper, a novel and fully automated wavelet-based
method for medical image fusion is proposed. The main
contribution of this work is that after the source images
are decomposed by the wavelet transform, the coefficients
of the low-frequency portion and high-frequency portions
are performed with different fusion schemes. This new
technique is developed by not only taking into account
the characteristics of the human visual system (HVS) for
the wavelet coefficients but also considering the physical
meaning of the coefficients. Therefore, the coefficients of
the low-frequency and high-frequency bands are treated
with different ways: the former is selected with a visibility
based scheme, and the latter is selected by a maximum local
variance scheme. Besides, in order to avoid the presence of
noise and guarantee the homogeneity of the fused image,
all the coefficients are finally performed with a consistency
verification. The fused image can then be achieved by an
inverse wavelet transform with the coefficients obtained
from all frequency bands. Both qualitative and quantitative
performance evaluations are made and verified in the
paper.
The remainder of the paper is organized as fol-
lows. The related wavelet-based image fusion technique is
reviewed and given in Section 2. The proposed method
for fusing multimodal medical images is described in
Section 3. Experimental results and analysis are pre-
sented in Section 4 and the conclusions are given in
Section 5.
EURASIP Journal on Advances in Signal Processing 3
2. Image Fusion Based on Wavelet Transform
The original concept and theory of wavelet-based multireso-
lution analysis came from Mallat [30]. The wavelet transform
is a mathematical tool that can detect local features in
a signal process. It also can be used to decompose two-
dimensional (2D) signals such as 2D gray-scale image signals
into different resolution levels for multiresolution analysis.
Wavelet transform has been greatly used in many areas, such
as texture analysis, data compression, feature detection, and
image fusion. In this section, we briefly review and analyze
the wavelet-based image fusion technique.
2.1. Wavelet Transform. Wavelet transforms provide a frame-
work in which a signal is decomposed, with each level
corresponding to a coarser resolution or lower-frequency
band and higher-frequency bands. There are two main
groups of transforms, continuous and discrete. Of particular
interest is the DWT, which applies a two-channel filter
bank (with downsampling) iteratively to the lowpass band
(initially the original signal). The wavelet representation then
consists of the low-pass band at the lowest resolution and
the highpass bands obtained at each step. This transform is
invertible and nonredundant.
The DWT is a spatial-frequency decomposition that
provides a flexible multiresolution analysis of an image [31].
In one dimension (1D) the basic idea of the DWT is to
represent the signal as a superposition of wavelets. Suppose
that a discrete signal is represented by f (t); the wavelet
decomposition is then defined as
f
(
t
)
=
m,n
c
m,n
ψ
m,n
(
t
)
,(1)
where ψ
m,n
(t) = 2
−m/2
ψ[2
−m
t − n]andm and n are integers.
There exist very special choices of ψ such that ψ
m,n
(t)con-
stitutes an orthonormal basis, so that the wavelet transform
coefficients can be obtained by an inner calculation:
c
m,n
=
f , ψ
m,n
=
ψ
m,n
(
t
)
f
(
t
)
dt. (2)
In order to develop a multiresolution analysis, a scaling
function φ is needed, together with the dilated and translated
version of it, φ
m,n
(t) = 2
−m/2
φ[2
−m
t − n]. According to the
characteristics of the scale spaces spanned by φ and ψ, the
signal f (t) can be decomposed in its coarse part and details
of various sizes by projecting it onto the corresponding
spaces.
Therefore, to find such decomposition explicitly, addi-
tional coefficients a
m,n
arerequiredateachscale.Ateach
scale a
m,n
and a
m−1,n
describe the approximations of the
function f at resolution 2
m
and at the coarser resolution
2
m−1
, respectively, while the coefficients c
m,n
describe the
information loss when going from one approximation to
another. In order to obtain the coefficients c
m,n
and a
m,n
at
each scale and position, a scaling function is needed that is
similarly defined to (2). The approximation coefficients and
wavelet coefficients can be obtained:
a
m,n
=
k
h
2n−k
a
m−1,k
,(3)
c
m,n
=
k
g
2n−k
a
m−1,k
,(4)
where h
n
is a lowpass FIR filter and g
n
is related highpass FIR
filter. To reconstruct the original signal the analysis filters can
be selected from a biorthogonal set which have a related set
of synthesis filters. These synthesis filters
h and g can be used
to perfectly reconstruct the signal using the reconstruction
formula:
a
m−1,l
f
=
n
h
2n−l
a
m,n
f
+ g
2n−l
c
m,n
f
. (5)
Equations (3)and(4) are implemented by filtering and
downsampling. Conversely (5) is implemented by an initial
upsampling and a subsequent filtering.
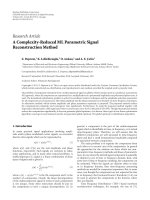
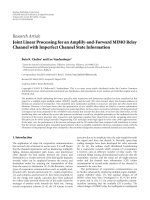
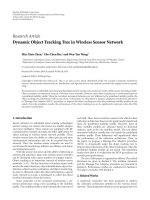
In a 2-D DWT, a 1-D DWT is first performed on the
rows and then columns of the data by separately filtering
and downsampling. This results in one set of approxima-
tion coefficients I
a
and three sets of detail coefficients, as
shown in Figure 1(a),whereI
b
, I
c
, and I
d
represent the
horizontal, vertical and dialog directions of the image I,
respectively. In the language of filter theory, these four
subimages correspond to the outputs of low-low (LL), low-
high (LH), high-low (HL), and high–high (HH) bands. By
recursively applying the same scheme to the LL subband a
multiresolution decomposition with a desires level can then
be achieved. Therefore, a DWT with K decomposition levels
will have M
= 3 ∗ K + 1 such frequency bands. Figure 1(b)
shows the 2-D structures of the wavelet transform with two
decomposition levels. It should be noted that for a transform
with K levels of decomposition, there is always only one low-
frequency band ( LL
K
in Figure 1(b)); the rest of bands are
high-frequency bands in a given decomposition level.
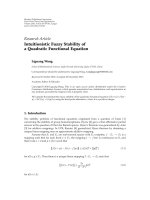
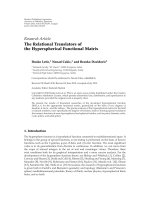
2.2. Fusion with Wavelet Transform. In this subsection, to
better understand the concept and procedure of the wavelet-
based fusion technique, a schematic diagram is first given
in Figure 2. In general, the basic idea of image fusion
based on wavelet transform is to perform a multiresolution
decomposition on each source image; the coefficients of both
the low-frequency band and high-frequency bands are then
performed with a certain fusion rule as displayed in the
middle block of Figure 2 The widely used fusion rule is
maximum selection scheme. This simple scheme just selects
the largest absolute wavelet coefficientateachlocationfrom
the input images as the coefficient at the location in the fused
image. After that, the fused image is obtained by performing
the inverse DWT (IDWT) for the corresponding combined
wavelet coefficients. Therefore, as shown in Figure 2, the
detailed fusion steps based on wavelet transform can be
summarized below.
Step 1. Theimagestobefusedmustberegisteredtoassure
that the corresponding pixels are aligned.
Step 2. These images are decomposed into wavelet trans-
formed images, respectively, based on wavelet transforma-
tion. The transformed images with K-level decomposition
will include one low-frequency portion (low-low band)
4 EURASIP Journal on Advances in Signal Processing
h
g
21
21
h
g
h
g
12
12
12
12
I
a
I
b
I
c
I
d
Columns
Rows
Image I
(a)
LL
2
LH
2
HL
2
HH
2
HL
1
HH
1
LH
1
(b)
Figure 1: Structures of 2-D DWT. (a) One stage of 2-D DWT multiresolution image decomposition; (b) 2-D DWT structure with labeled
subbands in two-level decomposition.
and 3K high-frequency portions (low-high bands, high-low
bands, and high-high bands).
Step 3. The transform coefficients of different portions or
bands are performed with a certain fusion rule.
Step 4 . The fused image is constructed by performing an
inverse wavelet transform based on the combined transform
coefficients from Step 3.
3. The Proposed Fusion Method
As shown in the fusion block, Figure 2, it is easy to find that
the core step in image fusion based on wavelet is that of
coefficient combination, namely, the fusion rule because it
will decide how to merge the coefficients in an appropriate
way so that a high-quality fused image can be obtained.
Therefore, for this kind of image fusion method the key
issue is its fusion rule design, and it should be paid more
attention. Over the past years, various fusion rules have been
proposed, which can be divided into pixel-based method
and window-based method. The popular widely used pixel-
based fusion rule is the aforementioned maximum selection
scheme [20]. This method can select the salient features
from the source images; however, it is sensitive to noise
and artifacts as they intend to have higher contrast. As
a result, with this method some noise and artifacts are
easily introduced into the fused image, which will reduce
the resultant image quality consequently. Averaging fusion
rule is another pixel-based method and it can lead to a
stabilization of the fusion result. However, this scheme tends
to blur images and reduce the contrast of features appearing
in only one image. More complex fusion rules such as
window-based or region-based are also proposed because
these types of schemes are more robust than the pixel-
based scheme against the image misregistration. Burt and
Kolczynshi [14] proposed a window-based weighted average
fusion rule. However, the weights in this scheme rely on
a user predefined threshold. Li et al. [18]usedanarea-
based maximum selection rule to determine which of the
input is likely to contain the most useful information by
considering the maximum absolute variance value of the
central coefficients within a window. Although this method
has been proved better than the pyramid-based method,
the disadvantage of this method is that it treats the wavelet
coefficients of both low-frequency band and high-frequency
bands in the same way. However, as we know in many
applications, the ultimate user or interpreter of the fused
image is a human. So the human perception should be
considered in the image fusion. According to the theoretical
models of the HVS, it is easy to know that the human eyes
have different sensitiveness to the wavelet coefficients of low
resolution band and high resolution bands [32, 33]. Hence,
the above fusion rules that treat all the coefficients in same
way will have some disadvantages.
On the other hand, since the main objective of this paper
is to fuse the multimodal medical images, the characteristics
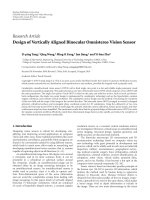
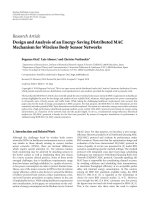
of the images should also be considered. Figure 3 illustrates
an example of the original CT and MR images. From
Figure 3 it is easy to see that the CT image provides clear
bones information but no soft tissues information, while
contrast to CT image the MR image provides clear soft
tissues information but no bones information. That is to
say, the same object in the two medical images appears very
distinctly. Hence, when the two images are decomposed by
wavelet transform, the approximation image (low-frequency
band) and the detail image (high-frequency bands) may
have very different physical meaning. Based on this and
the above analysis, this paper presents a new fusion rule
to perform the wavelet coefficients which treats the low-
frequency band and high-frequency bands with different
fusion schemes separately. The coefficients of low-frequency
band are selected by a visibility based selection scheme, while
the coefficients of the high-frequency bands are performed
with a maximum window-based variance selection scheme.
Then in order to overcome the influence of the noise and
guarantee the homogeneity of the fused image a window-
based consistency verification is employed to all the coef-
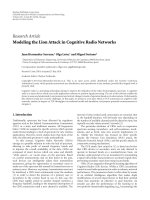
ficients selected from all the frequency bands. The overall
flowchart of our proposed fusion rule can be depicted as in
Figure 4.
3.1. Low-Frequency Band Fusion. In this paper, to simplify
the description of the different alternatives available in
forming a fusion rule, as in [5, 24] we also consider only
two source images, X and Y, and the fused image Z.
EURASIP Journal on Advances in Signal Processing 5
DWT
DWT
Image A
Image B Decomposed coefficients
Fusion rule
Fused coefficients
IDWT
Fused image
Figure 2: The image fusion scheme using the wavelet transform.
(a) (b)
Figure 3: Original medical images to be fused. (a) Original CT image. (b) Original MR image.
The method can of course be easily extended to more
than two images. Generally, an image I has its multiscale
decomposition (MSD) representation denoted D
I
.Hencewe
will encounter D
X
, D
Y
,andD
Z
.Letp = (m, n, k, l) indicate
the index corresponding to a particular MSD coefficient,
where m and n indicate the spatial position in a given
frequency band, k is the decomposition level, and l is the
frequency band of the MSD representation. Therefore, D
I
(p)
denote the MSD value of the corresponding coefficient at
the position (m, n) with decomposition level k and frequency
band l.
Since the low-frequency band is the original image at
coarser resolution level, it can be considered as a smoothed
and subsampled version of the original image. Therefore,
most information of their source images is kept in the
low-frequency band. Based on the pervious analysis, here
for the low-frequency band, a fusion scheme which selects
the highest local visibility is proposed. This approach is
derived from [34] and is motivated by the fact that the
HVS is sensitive to the contrast. Hence, this method can
be likely to provide better details to the human observer.
The fusion rule first calculates the window-based visibility
of all coefficients in the low-frequency band. The visibility of
wavelet coefficients is defined as
VI
p
=
1
w
2
(i,j)∈B
w
Λ
D
p
·
D
m + i, n + j, k, l
−
D
p
D
p
,
D
p
=
1
w
2
(i,j)∈B
w
D
m + i, n + j, k, l
,
Λ
D
p
=
1
D
p
α
,
(6)
where B
w
is a w × w block, Λ(D(p)) is the weighting factor,
VI(p) denote the visibility in the block, α is a visual constant
obtained by perceptual experiment, and its range is from
0.6 to 0.7 [35]. After calculating the visibility of all the
coefficients in the low-frequency band, the corresponding
coefficients with higher magnitude of visibility are then
chosen into the fused image as follows:
D
Z
p
=
D
X
p
,VI
X
p
≥
VI
Y
p
,
D
Y
p
,VI
X
p
< VI
Y
p
.
(7)
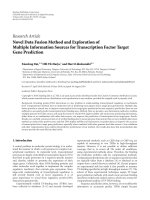
6 EURASIP Journal on Advances in Signal Processing
LL
p
LH
p
HL
p
HH
p
LL
p
LH
p
HL
p
HH
p
LL
p
LH
p
HL
p
HH
p
Coefficients of image A
Coefficients of image B
Visibility
based scheme
Va ria nce
based scheme
Consistency
verification
Combined coefficients
Figure 4: Schematic diagram of the proposed fusion rule.
3.2. High Frequency Bands Fusion. For the high-frequency
bands, since the purpose of image fusion requires that
the fused image must not discard any useful information
contained in the source images and effectively preserve the
details of input images such as edges, lines, and region
boundaries, it is generally believed that the details of an
image are mainly included in the high-frequency of the
image. Therefore, it is important to find appropriate meth-
ods to merge the details of input images. The conventional
selection of high-frequency coefficients only depend on
their absolute value without taking any consideration of
the neighboring coefficients. However, as we know a pixel
in a image must have some relations with its neighboring
pixels, which means that a MSD coefficient will also have
relations with its neighboring MSD coefficients. In addition,
according to characteristic of HVS [33] it is easy to find that
for the high resolution region the human visual interest is
concentrated on the detection of changes in contrast between
regions on the edges separate these regions. Therefore, a
good method for the high-frequency bands should produce
large coefficients on those edges. Based on the above analysis,
we propose a scheme by computing the variance in a
neighborhood to select the high-frequency coefficients. The
procedure can be formulated as follows:
σ
I
p
=
1
S × T
S/2
s=−S/2
T/2
t=−T/2
(
D
I
(
m + s, n + t, k, l
)
−mean
I
p
2
,
mean
I
p
=
1
S × T
S/2
s=−S/2
T/2
t=−T/2
D
I
(
m + s, n + t, k, l
)
,
(8)
where S
× T is the neighboring size, and mean
I
(p), σ
I
(p)
denote the mean value and variance value of the coefficients
centered at (m, n) in the window of S
× T,respectively.Then,
the fusion scheme used for the high-frequency bands can be
illustrated as follows:
D
Z
p
=
D
X
p
, σ
X
p
≥ σ
Y
p
,
D
Y
p
, σ
X
p
<σ
Y
p
.
(9)
It is worthy to note again that the high-frequency
bands referred here include the vertical, horizontal, and
diagonal high-frequencies of the image, respectively. There-
fore, the fusion process should be performed in all these
domains.
3.3. Consistency Verification. As can be seen from above
subsections all the coefficients of both low-frequency and
high-frequency bands are selected by the maximum selec-
tion schemes, but as we know the maximum selection
technique will be influent in case of noise. Furthermore,
sincewecopewiththecoefficients separately, this method
cannot guarantee the homogeneity in the resultant fused
image. Therefore, a consistency verification scheme is then
performed, which can also ensure that the dominant fea-
tures are incorporated as completely as possible into the
fused image. The idea of this attempt is likely to be a
majority filter. In this paper, we apply a window-based
verification (WBV) to the coefficients in the composite MSD
[18]. The WBV employs a small window centered at the
current coefficient position. The WBV rule is that if the
center composite MSD coefficient comes from image X,
but the majority of the surrounding coefficients in the
window come from image Y, then the center sample
is changed to come from Y. In the implementation,
this rule is applied to a binary decision map, and then
it is followed by the application of a majority filter.
The fused coefficients are finally obtained by the new
EURASIP Journal on Advances in Signal Processing 7
binary decision map. This process can be formulated as
follows:
D
X
p
=
max
w∈W
D
X
p, w
,
D
Y
p
=
max
w∈W
D
Y
p, w
,
q
X
p
=
1, D
X
p
>D
Y
p
,
0, otherwise,
q
Y
p
=
1, D
Y
p
≥
D
X
p
,
0, otherwise,
q
∗
X
p
=
⎧
⎨
⎩
1,
q
X
p
≥ 5,
0, otherwise,
q
∗
Y
p
=
1 − q
∗
X
p
,
D
Z
p
=
q
∗
X
p
D
X
p
+ q
∗
Y
p
D
Y
p
,
(10)
where W is a 3
× 3 window, and the value for the majority
filter is set to 5.
Through the above three procedures, the combined coef-
ficients are then performed by an inverse wavelet transform,
and the fused image can achieved consequently. Thus, the
steps of our fusion approach in this paper can be briefly
summarized as follows.
Step 1. Register the multimodal medical images.
Step 2. Decompose the images to 3-4 wavelet planes (resolu-
tion levels).
Step 3. The wavelet coefficients of the low-frequency are
selected by (6)and(7), and the wavelet coefficients of the
high-frequency are selected by (8).
Step 4. The coefficients of both the low-frequency and high-
frequency are performed by the consistency verification of
(10) and (18).
Step 5. Perform the inverse wavelet transform with the
combined coefficients obtained from Step 4.
4. Experimental Results and Analysis
In this section, the application results of the proposed
wavelet-based method for medical image fusion are pre-
sented. The performance of the proposed method is com-
pared with those of pixel averaging method [36], the gradient
pyramid method [14], and the conventional DWT method
with maximum selection rule [20]. Since image registration
is out of scope of this paper, like most of the literatures
[5, 36], in all test cases we assume the source medical images
to be in perfect registration. A thorough survey of image
registration techniques can be referred to [37]. We use the
Daubechies’ db8, also with a decomposition level of 3, as the
wavelet-basis for DWT and the proposed method. A 3
× 3
window size for calculating the variance is considered in this
paper, which has been proved to be more effective by many
researchers [38, 39]. We have carried out some comparisons
on different values of the visual constant and found that the
fusion result is insensitive to this parameter. Therefore, the
parameter α is chosen to be 0.7 in this paper. Furthermore,
we invited a radiologist (Associate Professor Xianjun Zeng,
Department of the Medical Imaging, the First Affiliation
Hospital of Nanchang University) to do subjective evaluation
(visual assessment) of all the experiments.
To evaluate the performance of the proposed approach,
tests were first realized on two simulated medical images as
shown in Figure 5. An original T2-weighted MR image is
shown in Figure 5(a), which served as the reference image
here. Then two other images are generated by filtering
the reference image with a Gaussian blurring process as
[5, 11]. Figure 5(b) is the image blurred on the top, while
Figure 5(c) is the image blurred on the bottom. Figures 5(d)–
5(g) are the fused results obtained by fusing Figure 5(b) and
Figure 5(c) with the pixel averaging method, the gradient
pyramid method, the DWT method, and the proposed
method, respectively. The visual inspection of the fused
image Figures 5(d)–5(g) was then carried out by the expert.
However, results of his subjective evaluation reveal that
through visual inspection it is difficult to find the difference
of the four methods except that Figure 5(d) has a lower
contrast. Therefore, a mutual information (MI) metric is
employed here to objectively evaluate the performance of
the four methods. This metric can indicate how much
information the fused image conveys about the reference
image [40]. Thus, the higher the MI, the better the result.
TheMIisdefinedas
MI
(
x
R
; x
F
)
=
L
u=1
L
v=1
h
R,F
(
u, v
)
log
2
h
R,F
(
u, v
)
h
R
(
u
)
h
F
(
v
)
, (11)
where x
R
and x
F
denote the reference image and fused image,
respectively, h
R,F
is the joint gray level histogram of x
R
and
x
F
, h
R
and h
F
are the normalized gray level histograms of
x
R
and x
F
,andL is the number of bins. The MI values
of the four different methods are calculated and shown in
Figure 6.ItcanbeseenfromFigure 6 that the MI value of the
proposed method is the largest in the four methods, and the
MI value of the pixel averaging method is the smallest. The
results presented in this example can demonstrate that our
approach can fuse the medical image while retaining much
more information than that of the other three methods.
The second example is the frequently used normal CT
andMRimagesasshowninFigure 3.Theexperimental
results of the above four method are displayed in Figures
7(a)–7(d), respectively. Compared with the original CT and
MR images in Figure 3,itiseasytofindthatwithallthe
methods the fused image now contains both the bones
information and tissues information, which cannot be seen
in the separate CT or MR image. However, after careful
manual inspection of Figures 7(a)–7(d) by our expert, he
indicated that the fused result of the proposed method is
the best in the four methods because the information of
bones and tissues is clearer than other three methods, while
8 EURASIP Journal on Advances in Signal Processing
(a) (b) (c)
(d) (e)
(f) (g)
Figure 5: Medical image fusion with the simulated pair from a T2-weighted MR image. (a) The original medical image (reference image
or ground truth); (b) image blurred on the top; (c) image blurred on the bottom; (d) fused image by pixel averaging; (e) fused image by
gradient pyramid; (f) fused image by DWT; (g) fused image by the proposed method.
Table 1: Quantitative evaluation results of the four different fusion methods in Figure 7.
Fusion methods Standard deviation Average gradient Information entropy Cross entropy
Pixel averaging 34.8582 3.8985 5.7602 2.0768
Gradient pyramid 38.7825 5.2708 6.1359 1.7799
DWT 41.1598 6.7343 6.1781 1.9428
Proposed method 57.9787 7.5005 6.7295 0.9626
Table 2: Quantitative evaluation results of the four different fusion methods in Figure 8.
Fusion methods Standard deviation Average gradient Information entropy Cross entropy
Pixel averaging 45.5339 6.4783 5.9594 2.8611
Gradient pyramid 46.2360 8.6048 6.5275 2.9881
DWT 50.8397 10.1953 6.0989 2.7748
Proposed method 68.8098 10.4994 6.5681 1.8884
EURASIP Journal on Advances in Signal Processing 9
2.2214
2.2452
2.5267
2.7148
0
0.5
1
1.5
2
2.5
3
MI
Fusion methods
Pixel averaging
Gradient pyramid
DWT
Proposed method
Figure 6: MI values of the four different methods.
the result of the pixel averaging is the worst because the
information of bones and tissues is very blurry or fuzzy, and
the result of gradient pyramid is almost identical to that
of DWT method. However, just as in [41] the subjective
evaluation depends on the expert’s experience and some
uncertainty is involved because this measure has no rigorous
mathematical models and is mainly visual. Considering
the drawbacks of the subjective quality evaluation method,
quantitative evaluation of the quality of the fused images is
thus needed, which will be more objective than the visual
inspection. In addition, based on the requirements of fusion
algorithm [42], when we evaluate the performance of the
fusion technique, we must pay attention to that (1) it should
preserve all relevant information of the input images in the
fused image (pattern conservation); (2) it should minimise
any artifacts or inconsistence in the fused image. Only in this
case, we can accurately and comprehensively explain which
fusion method is more effective.
Therefore, in order to better evaluate the above fusion
methods, quantitative assessment of the performance of the
four methods is then carried out. However, as we know
actually for image fusion it is often hard to get the ideal or
reference composite image; so the above MI metric cannot
be used here. Consequently, four other evaluation criteria are
then introduced and employed in this paper [41, 43].
(i) Standard Deviation. The standard deviation of an image
with size of M
× N is defined as
σ =
⎛
⎝
1
M × N
M
m=1
N
n=1
f (m, n) − μ
2
⎞
⎠
1/2
, (12)
where f (m, n) is the pixel value of the fused image at the
position (m,n),
μ is the mean value of the image. The
standard deviation is the most common measure of statistical
dispersion, which can be used to evaluate how widely spread
the gray values in an image. So, the larger the standard
deviation, the better the result.
(ii) Average Gradient. The average gradient of an image with
size of M
× N is defined as:
Avg
=
1
(
M
− 1
)
×
(
N
− 1
)
×
M−1
m=1
N
−1
n=1
⎡
⎣
∂f
(
m, n
)
∂m
2
+
∂f
(
m, n
)
∂n
2
⎤
⎦
2
,
(13)
where f (m, n) is the same meaning as in the standard
deviation. The average gradient reflects the clarity of the
fused image. It is used to measure the spatial resolution of the
fused image; that is, larger average gradient means a higher
resolution.
(iii) Information Entropy. The formulation of the classical
information entropy of an image is defined as
H
=−
L−1
l=0
P
l
log
2
P
l
, (14)
where L is the number of gray level, and P
l
equals the ratio
between the number of pixels whose gray value is l (0
≤ l ≤
L− 1) and the total pixel number contained in the image. The
information entropy measures the richness of information
in an image. Thus, the higher the entropy, the better the
performance.
(iv) Cross Entropy (CE). The cross entropy is used to
measure the difference between the source images and the
fused image. Small value corresponds to good fusion result
obtained:
CE
=
L−1
l=0
P
l
log
2
P
l
Q
l
, (15)
where P
l
and Q
l
denote the gray level histogram of the source
image and fused image, respectively.
The above four evaluation criteria are then applied to
evaluate the four fusion methods in Figure 7, and the detailed
quantitative results are given in Tab l e 1.FromTab le 1,we
can observe that the values of several quality indices such
as the standard deviation, average gradient, and information
entropy of the proposed method are larger than those
of pixel averaging, gradient pyramid, and DWT methods.
For instance, the average gradient of the proposed method
is 7.5005, while the corresponding values of other three
methods are 3.8985, 5.2708, and 6.7343, respectively. These
three largest values presented here can indicate that with
the proposed method the fused image can get higher spatial
resolution and retain much more image information. The
last column of Tabl e 1 shows the values of the cross entropy
of the four methods. By comparison, it can be seen that the
cross entropy value of the proposed method is the smallest
in the four methods. This means that with the proposed
method the fused images have less difference to the source
10 EURASIP Journal on Advances in Signal Processing
(a) (b)
(c) (d)
Figure 7: Fusion results of the CT and MR images with different methods. (a) Fused image by pixel averaging; (b) fused image by gradient
pyramid; (c) fused image by DWT; (d) fused image by the proposed method.
images than those of other three methods. From Ta bl e 1 ,we
can also find that the performance of the pixel averaging is
the worst in the four methods; the performance of the DWT
method is somewhat superior to that of gradient pyramid
method.
The last examples are two medical images, one is a T1-
weighted MR image, and another is an MRA image with
some illness as shown in Figures 8(a) and 8(b),respectively.
From these two images, it can be seen that in the T1-weighted
MR image, the soft tissue is clear and easy to recognize,
but the illness medical information as shown in the marked
ellipse area of Figure 8(b) has been lost. On the contrary,
although the MRA image contains the illness information,
the soft tissues in it are very difficult to distinguish due to
its lower spatial resolution. Therefore, in order to support
entire and accurate medical information for doctor’s analysis
and diagnosis, the fusion of the two images is required. The
four methods mentioned above are then used to fuse those
two images, and their corresponding results are displayed
in Figures 8(c)–8(f), respectively. As can be seen, with
all the methods the fused images now appear to preserve
the overall regions of interest (ROI) presented in the two
images. However, by our expert subjectively observing, he
claimed that the fused result of the proposed method is
more clearly and has a higher contrast than that of the
other three methods, but it is hard to discriminate the three
fused images of the pixel averaging, the gradient pyramid,
and the DWT methods in this visual case. Hence, in order
to better evaluate the performance of the four methods,
quantitative assessments are also carried out with the above
evaluation criteria, and their corresponding results are listed
in Ta ble 2 .FromTab le 2,itiseasytosee,justasTa bl e 1, that
the performance of the proposed method is the best in the
four methods because it not only has the highest values of
the standard deviation, average gradient, and information
entropy, respectively, but also has the lowest value of the cross
entropy. Therefore, based on these two experimental results
on the real medical images presented here and according to
the requirements of fusion method mentioned above, we can
conclude that all the quantitative evaluations are basically
corresponding to the doctor’s visual effects, and the proposed
wavelet-based fusion method performs better than the other
three existing fusion methods.
5. Conclusions
The fusion of multimodal medical images plays an important
role in many clinical applications for they can support more
accurate information than any individual source image. This
paper presents a novel wavelet-based approach for medical
image fusion, which consists of three steps. In the first
EURASIP Journal on Advances in Signal Processing 11
(a) (b)
(c) (d)
(e) (f)
Figure 8: Fusion results of the T1-weighted MR and MRA images with different methods. (a) Original T1-weighted MR image; (b) original
MRA image; (c) fused image by pixel averaging; (d) fused image by gradient pyramid; (e) fused image by DWT; (f) fused image by the
proposed method.
step, the medical images to be fused are decomposed into
subimages by wavelet transform. In the second step, after
considering the characteristics of HVS and the physical
meaning of the wavelet coefficients, the coefficients of the
low-frequency band and high-frequency bands are per-
formed with different fusion strategies: the former is selected
using a maximum visibility scheme, and the latter is selected
by a maximum local variance rule. In order to improve the
quality of the resultant image, all the combined coefficients
are then performed by a window based consistency verifica-
tion. In the last step, the fused image is constructed by the
inverse wavelet transform with the composite coefficients.
The performance of the proposed method is qualitatively
and quantitatively compared with some existing fusion
approaches. Experimental results show that the proposed
method can preserve more useful information in the fused
image with higher spatial resolution and less difference to the
source images.
Acknowledgments
This work was supported by the National Natural Science
Foundation of China under the grant no. 60963012, by
the Ministry of Education, Science Technology (MEST) and
Korea Industrial Technology Foundation (KOTEF) though
the Humana Resource Training Project for Regional Inno-
vation, by the second stage of Brain Korea 21, by the China
Postdoctoral Special Science Foundation funded project
under the grant no. 200902614, and by the Science and
12 EURASIP Journal on Advances in Signal Processing
Technology Research Project of the Education Department
of Jiangxi Province under the grants no. GJJ10125 and no.
GJJ09287. The authors also thank the anonymous referees for
their valuable suggestions.
References
[1] F. Maes, D. Vandermeulen, and P. Suetens, “Medical image
registration using mutual information,” Proceedings of the
IEEE, vol. 91, no. 10, pp. 1699–1721, 2003.
[2] V. Barra and J Y. Boire, “A general framework for the fusion of
anatomical and functional medical images,” NeuroImage, vol.
13, no. 3, pp. 410–424, 2001.
[3] Y M. Zhu and S. M. Cochoff,“Anobject-orientedframework
for medical image registration, fusion, and visualization,”
Computer Methods and Programs in Biomedicine, vol. 82, no.
3, pp. 258–267, 2006.
[4] V. S. Petrovic and C. S. Xydeas, “Gradient-based multiresolu-
tion image fusion,” IEEE Transactions on Image Processing, vol.
13, no. 2, pp. 228–237, 2004.
[5] Z. Zhang and R. S. Blum, “A categorization of multiscale-
decomposition-based image fusion schemes with a perfor-
mance study for a digital camera application,” Proceedings of
the IEEE, vol. 87, no. 8, pp. 1315–1326, 1999.
[6] Y. Wang and B. Lohmann, “Multisensor image fusion: concept,
method and applications,” Tech. Rep., Institute of Automatic
Technology, University of Bremen, Bremen, Germany, 2000.
[7] S. T. Shivappa, B. D. Rao, and M. M. Trivedi, “An iterative
decoding algorithm for fusion of multimodal information,”
EURASIP Journal on Advances in Signal Processing, vol. 2008,
Article ID 478396, 10 pages, 2008.
[8] R. Redondo, F. Sroubek, S. Fischer, and G. Cristobal, “Mul-
tifocus image fusion using the log-Gabor transform and a
Multisize Windows technique,” Information Fusion, vol. 10, no.
2, pp. 163–171, 2009.
[9] S. Li and B. Yang, “Multifocus image fusion using region
segmentation and spatial frequency,” Image and Vision Com-
puting, vol. 26, no. 7, pp. 971–979, 2008.
[10] P. S. Pradhan, R. L. King, N. H. Younan, and D. W. Holcomb,
“Estimation of the number of decomposition levels for
a wavelet-based multiresolution multisensor image fusion,”
IEEE Transactions on Geoscience and Remote Sensing, vol. 44,
no. 12, pp. 3674–3686, 2006.
[11] S. Li, J. T. Kwok, and Y. Wang, “Multifocus image fusion using
artificial neural networks,” Pattern Recognition Letters, vol. 23,
no. 8, pp. 985–997, 2002.
[12] J. Yang and R. S. Blum, “A statistical signal processing
approach to image fusion for conceled weapon detection,”
in Proceedings of the IEEE International Conference on Image
Processing, vol. 1, pp. 513–516, 2002.
[13]P.J.BurtandE.H.Adelson,“TheLaplacianpyramidasa
compact image code,” IEEE Transactions on Communications,
vol. 31, no. 4, pp. 532–540, 1983.
[14] P. J. Burt and R. J. Kolczynski, “Enhanced image capture
through fusion,” in Proceedings of the 4th IEEE International
Conference on Computer Vision (ICCV ’93), pp. 173–182, 1993.
[15] A. Toet, J. J. van Ruyven, and J. M. Valeton, “Merging thermal
and visual images by a contrast pyramid,” Optical Engineering,
vol. 28, no. 7, pp. 789–792, 1989.
[16] A. Toet, “Image fusion by a ration of low-pass pyramid,”
Pattern Recognition Letters, vol. 9, no. 4, pp. 245–253, 1989.
[17] A. Toet, “A morphological pyramidal image decomposition,”
Pattern Recognition Letters, vol. 9, no. 4, pp. 255–261, 1989.
[18] H. Li, B. S. Manjunath, and S. K. Mitra, “Multisensor image
fusion using the wavelet transform,” Graphical Models and
Image Processing, vol. 57, no. 3, pp. 235–245, 1995.
[19] G. K. Matsopoulos and S. Marshall, “Application of morpho-
logical pyramids: fusion of MR and CT phantoms,” Journal of
Visual Communication and Image Representation, vol. 6, no. 2,
pp. 196–207, 1995.
[20] L. J. Chipman, T. M. Orr, and L. N. Graham, “Wavelets
and image fusion,” in Proceedings of the IEEE International
Conference on Image Processing
, vol. 3, pp. 248–251, 1995.
[21] T. Pu and G. Ni, “Contrast-based image fusion using the
discrete wavelet transform,” Optical Engineering, vol. 39, no.
8, pp. 2075–2082, 2000.
[22] H. Ma, C. Y. Jia, and S. Liu, “Multisource image fusion based
on wavelet transform,” International Journal of Information
Technology, vol. 11, no. 7, pp. 81–91, 2005.
[23] F. W. Acerbi-Junior, J. G. P. W. Clevers, and M. E. Schaepman,
“The assessment of multi-sensor image fusion using wavelet
transforms for mapping the Brazilian Savanna,” International
Journal of Applied Earth Observation and Geoinformation, vol.
8, no. 4, pp. 278–288, 2006.
[24] G. Pajares and J. M. D. L. Cruz, “A wavelet-based image fusion
tutorial,” Pattern Recognition, vol. 37, no. 9, pp. 1855–1872,
2004.
[25] K. Amolins, Y. Zhang, and P. Dare, “Wavelet based image
fusion techniques—an introduction, review and comparison,”
ISPRS Journal of Photogrammetry & Remote Sensing, vol. 62,
no. 4, pp. 249–263, 2007.
[26] L. F. Yu, D. L. Zu, W. D. Wang, and S. L. Bao, “Multi-modality
medical image fusion based on wavelet analysis and quality
evaluation,” Journal of Systems Engineering and Electronics, vol.
12, no. 1, pp. 42–48, 2001.
[27] G. H. Qu, D. L. Zhang, and P. F. Yan, “Medical image fusion
by wavelet transform modulus maxima,” Optics Express, vol.
9, no. 4, pp. 184–190, 2001.
[28] S. Garg, K. U. Kiran, R. Mohan, and U. S. Tiwary, “Multilevel
medical image fusion using segmented image by level set
evolution with region competition,” in Proceedings of the 27th
Annual International Conference of the IEEE Engineering in
Medicine and Biology (EMBS ’06), pp. 7680–7683, 2006.
[29] S. L. Cheng, J. M. He, and Z. W. Lv, “Medical image of PET/CT
weighted fusion based on wavelet transform,” in Proceedings
of the 2nd International Conference on Bioinformatics and
Biomedical Engineering (iCBBE ’08), pp. 2523–2525, 2008.
[30] S. G. Mallat, “A theory for multiresolution signal decomposi-
tion: the wavelet representation,” IEEE Transactions on Pattern
Analysis and Machine Intelligence, vol. 11, no. 7, pp. 674–693,
1989.
[31] S. G. Nikolov, P. Hill, D. R. Bull, and C. N. Canagarajah,
“Wavelets for image fusion,” in Wavelets in Signal and
Image A nalysis, Computational Imaging and Vision Series,
pp. 213–244, Kluwer Academic Publishers, Dodrecht, The
Netherlands, 2001.
[32] A. S. Lewis and G. Knowles, “Image compression using the 2-
Dwavelettransform,”IEEE Transactions on Image Processing,
vol. 1, no. 2, pp. 244–250, 1992.
[33] M. Barni, F. Bartolini, and A. Piva, “Improved wavelet-based
watermarking through pixel-wise masking,” IEEE Transactions
on Image Processing, vol. 10, no. 5, pp. 783–791, 2001.
[34] J. W. Huang, Q. S. Yun, and X. H. Dai, “A segmentation-based
image coding algorithm using the features of human vision
system,” Journal of Image and Graphics, vol. 4, no. 5, pp. 400–
404, 1999.
EURASIP Journal on Advances in Signal Processing 13
[35] A. B. Watson, “Efficiency of a model human image code,”
Journal of the Optical Society of America. A, vol. 4, no. 12, pp.
2401–2417, 1987.
[36] N. Mitianoudis and T. Stathaki, “Pixel-based and region-based
image fusion schemes using ICA bases,” Information Fusion,
vol. 8, no. 2, pp. 131–142, 2007.
[37] B. Zitova and J. Flusser, “Image registration methods: a
survey,” Image and Vision Computing, vol. 21, no. 11, pp. 977–
1000, 2003.
[38] G X. Liu and W H. Yang, “A wavelet-decomposition-based
image fusion scheme and its performance evaluation,” Acta
Automatica Sinica, vol. 28, no. 6, pp. 927–934, 2002.
[39] M. Li, X. Y. Zhang, and J. Mao, “Neighboring region variance
weighted mean image fusion based on wavelet transform,”
Foreign Electronic Measurement Technology,vol.27,no.1,pp.
5–6, 2008.
[40] G. Piella, “A general framework for multiresolution image
fusion: from pixels to regions,” Information Fusion, vol. 4, no.
4, pp. 259–280, 2003.
[41] W. Z. Shi, C. Q. Zhu, Y. Tian, and J. Nichol, “Wavelet-based
image fusion and quality assessment,” International Journal of
Applied Earth Observation and Geoinformation, vol. 6, no. 3-4,
pp. 241–251, 2005.
[42]Y.F.Zheng,E.A.Essock,B.C.Hansen,andA.M.Haun,
“A new metric based on extended spatial frequency and its
application to DWT based fusion algorithms,” Information
Fusion, vol. 8, no. 2, pp. 177–192, 2007.
[43] M. Li, W. Cai, and Z. Tan, “A region-based multi-sensor image
fusion scheme using pulse-coupled neural network,” Pattern
Recognition Letters, vol. 27, no. 16, pp. 1948–1956, 2006.