Advances in Optical and Photonic Devices 2011 Part 8 pptx
Bạn đang xem bản rút gọn của tài liệu. Xem và tải ngay bản đầy đủ của tài liệu tại đây (1.93 MB, 25 trang )
Advances in Optical and Photonic Devices
164
100Å thick InGaAs
p
+
- InGaAs contact layer
4μmInP
3μmInP
n
+
InP substrate
300Å thick InGaAs
p
+
- InGaAs contact layer
4μmInP
3μmInP
n
+
InP substrate
Type (I)
Type (II)
Type (III)
Type (IV)
3μm InGaAsP(λ
g
=1.4μm)
1000Å thick InGaAs
p
+
- InGaAs contact layer
n
+
InP substrate
3μm InGaAsP(λ
g
=1.4μm)
500Å thick InGaAs
p
+
- InGaAs contact layer
n
+
InP substrate
4μm InGaAsP(λ
g
=1.4μm)
3μm InGaAsP(λ
g
=1.4μm)
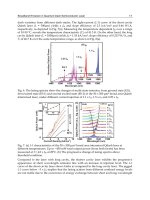
Fig. 3. Tested WGPD structures for high responsivity operation.
PD type Responsivity ( flat-ended fiber ) Responsivity ( lensed fiber )
(I) Polarization dependent Polarization dependent -
(II) 0.815A/W 1.09A/W
(III) 0.93A/W 1.09A/W
(IV) 0.76A/W 1.08A/W
Table (I) Responsivities for four types of WGPDs
-300 -200 -100 0 100 200 300
-4
-2
0
Type (II)
Type (I)
R/R
max
[dB]
ε on Poincare sphere [degree]
Fig. 4. Polarization dependencies of Type (I) and Type(II).
Another drawback of WGPD with 100Å thick absorption layer is low coupling efficiency,
which is contradictory to the simulated value. For type (I), the calculated coupling
Waveguide Photodiode (WGPD) with a Thin Absorption Layer
165
efficiency, coupled with flat-ended fiber, is 82.6%, which corresponds to responsivity of
0.99A/W for the wavelength of 1490nm. Measured responsivity, however, implies that
coupling efficiency of Type (I), when coupled with flat-ended fiber, is 30.6% and maximum
responsivity is 0.368A/W for the input wavelength of 1490nm.
To measure the coupling efficiency of Type (I), responsivities of PDs with different lengths
were measured for TE input light. Figure 5 shows responsivity values versus PD length.
This data was fitted with Equation (1).
(1 )
1.24
L
C
Re
α
λ
−
⋅Γ⋅
⋅
=⋅−
(1)
In Equation (1), R, C, λ, α, Γ, and L are responsivity, coupling efficiency, input wavelength,
absorption coefficient of absorption layer, confinement factor of guided beam within a
absorber, and PD length, respectively.
Fitting results indicate that coupling efficiency is 30.6% and αΓ is 0.00511μm
-1
. Low
responsivity for Type (I) was conformed by measuring five PDs. Five PDs show almost
same responsivity. Discrepancy between simulated value and measured one can be
explained by weakly guiding structure of Type (I). It is estimated that 100Å thick core layer
is too thin to support the propagation of light through total waveguide. Even a small
perturbation of waveguide structure such as side wall roughness may induce waveguide to
be leaky for 100Å thick core layer.
Type (III) shows responsivity of 0.93A/W, when coupled with non-lensed flat fiber. Type
(III) has low index difference between clad and core. Thus, guided mode is more spread
than the case of high core/clad index difference like Type (II). Calculated beam size of Type
(III) is 3.83μm. Compared to the calculated beam size of 2.81μm for Type (II), more enlarged
beam size of Type (III) is more similar to mode size of flat fiber, which gives higher
responsivity. Polarization dependency of Type (III) is also smaller than 0.25dB, showing
bulk absorption property. Comparison of Type (II) and Type (III) shows that small index
difference between core and clad is more advantageous, for high responsivity.
300 400 500
0.0
0.1
0.2
0.3
0.4
0.5
Responsivity [A/W]
Length of Type (I) WGPD [μm]
Fig. 5. Responsivity versus PD length of Type (I). Fitting was done by Eq. (1)
Type (IV) with 1000Å absorption layer thickness and 70μm length shows responsivity of
0.76A/W coupled with flat fiber and 1.08A/W coupled with lensed fiber at a wavelength of
Advances in Optical and Photonic Devices
166
1550nm. Calculated guiding mode size of Type (IV) is 2.36μm, which is small compared to
3.83μm of Type (III). Smaller guided mode size of Type (IV), originated from thicker core
layer than Type (III), gives more mode-mismatch and smaller responsivity than Type (III).
2. Bandwidth property
To find out time dependent current of photodiode, displacement current should be
considered. Including displacement current and photo-generated current, time dependent
current of photodiode is given by Equation (2), according to (G. Lucovsky et al, 1964).
,,
0
1
[(,) (,)]
()
1
L
drift e drift h
photodiode
IxtIxtdx
L
It
jRC
ω
+
=
+⋅ ⋅ ⋅
∫
(2)
In Equation (2), I
drift,e
(x,t), I
drift,h
(x,t), R and C are photo-generated electron and hole drift
current at (x,t), (series resistance of PD+load resistance) and (photodiode capacitance + stray
capacitance), respectively. Transit-time limited response is extracted by developing
numerator of Equation (2). To calculate transit-time limited frequency response of WGPDs
with thin absorption layer, I
drift,e
(x,t) shown in Figure 6 should be known first.
Assuming input light can be expressed as
exp( )
om
Pjt
ω
⋅
⋅⋅, where
o
P , ω
m
are amplitude of
input beam and modulation frequency, respectively, electron current at x is given by
Equation (3).
,
(,) exp[ ( )]
drift e o m
e
x
ixtRP jω t
v
=⋅⋅ ⋅ ⋅− (3)
x
=0
x
=
L
n
x
=-
L
p
Absorption layer
L
n-side intrinsic cladp-side intrinsic clad
p-doped layer
n-doped layer
),(
,
txI
edrift
x
=0
x
=
L
n
x
=-
L
p
Absorption layer
L
n-side intrinsic cladp-side intrinsic clad
p-doped layer
n-doped layer
),(
,
txI
edrift
Fig. 6. Configuration for derivation of transit-time limited frequency response of WGPD
having thin absorption layer.
In derivation of Equation (3), it is assumed that photocurrent is generated only at x=0. The
generated electrons at x=0 drift forward to n-doped region and drift current at x is delayed
waveform with respective to current at x=0, with time delay of x/v
e
. In Eq.(3), and
e
Rv are
responsivity, electron drift velocity in n-side clad layer, respectively.
Waveguide Photodiode (WGPD) with a Thin Absorption Layer
167
Including hole current contribution, the transit-time limited time-dependent photodiode
current is given by Equation (4).
1exp( ) 1exp( )
() exp( )[ ]
p
n
mm
eh
photodiode o m
mm
eh
L
L
jj
vv
itRPjω t
LL
jj
vv
ωω
ωω
−−⋅⋅ −−⋅⋅
=⋅⋅ ⋅ ⋅⋅ +
⋅⋅ ⋅⋅
(4)
In Equation (4),
h
v
is hole drift velocity in p-side clad layer. At optimized condition,
electron transit time and hole transit time are equal. This condition can be expressed by
//
ne ph
LvLv
τ
==. At optimized condition, right most term in Equation (4) can be re-
written by Equation (5).
1 exp( ) 1 exp( )
[]]
1exp( )
mm
np np
mm
eh
m
m
jj
LL LL
jj
vv
j
j
ω
τωτ
ωω
ωτ
ωτ
−
−⋅ ⋅ − −⋅ ⋅
+
++
⋅⋅ ⋅⋅
−−⋅⋅
=
⋅⋅
(5)
Transit time limited bandwidth, f
t
, is defined as the frequency at which absolute value of
Equation (5) is equal to
12, and can be calculated as
2.8
2
t
f
π
τ
≅
(6)
Including transit time limitation and RC effect, bandwidth of photodiode,
f
3dB
, is given by
Equation (7) with an error of less than 5%( K. Kato
et al, 1993).
222
3
111
dB t RC
f
ff
=+
(7)
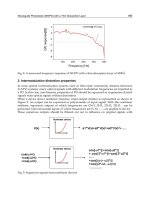
Figure 7 shows the expected 3dB bandwidth with intrinsic layer thickness variation.
Considered structures is Type (IV) of which absorption layer thickness is 1000Å. In
calculations, The relative dielectric constant and electron drift velocity of InGaAsP
(
λ
g
=1.4μm) was assumed as 11.16 (S. Adachi, 1982) and 1.5X10
6
cm/sec (A. Galvanauskas et
al, 1988). Hole velocity was assumed as the half of the electron velocity. In the calculations,
PD length was 70
μm and PD width was tapered from 5μm to 1μm. A 70μm length is
sufficient for responsivity of more than 1.0A/W for a 3
μm mode size fiber. Also, series
resistance, Rs and load resistance were assumed as 5
Ω and 50Ω.
As can be seen Figure 7 (a), optimized point for maximum bandwidth with pad capacitance
of zero, is the point at which RC limited bandwidth and carrier transit-time limited
bandwidth are same. At this optimized point, bandwidth can be a 120GHz even though thin
absorption layer needs long absorption length of 70
μm which is two or three times long
compared to typical high-speed WGPDs. When pad capacitance of 10fF is included,
however, bandwidth is reduced and optimum point is shfited as can be seen in Figure 7(b).
Based on simulated results of Figure 7 (a), (b), WGPD with a 1000Å thick absorber was
fabricated. The thickness of intrinsic layer on n-electrode side and p-electrode side were
Advances in Optical and Photonic Devices
168
0.6μm and 0.3μm, respectively. Width of WGPD was tapered from 5μm to 1μm and length
was 70
μm. The frequency response of a device was measured using an impulse response.
The optical impulse from femto-second laser was applied to WGPD. The impulse response
was converted to bandwidth curve using fourier transform. Figure 8 shows the bandwidth
response at -3V bias, after the de-embedding the RF loss of the measurement system. The RF
losses of measurement system include those of probe, bias tee, cable, and DC block. As can
be seen from the Figure 8, bandwidth of ~42GHz was obtained. Hole-trapping at the hetero-
interface of i-InGaAsP(
λ
g
=1.4μm)/i-InGaAs can be a bandwidth limiting factor. However,
the bandgap discontinuity at i-InGaAsP(
λ
g
=1.4μm)/i-InGaAs does not degrade the
bandwidth significantly.
0.5 1.0 1.5 2.0
0.0
20.0G
40.0G
60.0G
80.0G
100.0G
120.0G
C
pad
=0 fF
R
s
=5Ω
Bandwidth [Hz]
Thickness of Intrinsic layer on n-electrode side [μm]
RC
transit
total
(a)
0.5 1.0 1.5 2.0
0.0
20.0G
40.0G
60.0G
80.0G
100.0G
C
pad
=10fF
R
s
=5Ω
Bandwidth [Hz]
Thickness of Intrinsic layer on n-electrode side [μm]
RC
transit
total
(b)
Fig. 7. RC limited, transi-time limited and total bandwidth traces with variations of
thickness of n-side intrinsic layer (a) without consideration of pad capacitance (b) with the
pad capacitance of 10fF.
Waveguide Photodiode (WGPD) with a Thin Absorption Layer
169
10G 20G 30G 40G 50G
-8
-6
-4
-2
0
2
~42GHz@-3V bias
O/E response[dB]
Frequency [Hz]
Fig. 8. A measured frequency response of WGPD with a thin absorption layer of 1000Å.
3. Intermodulation distortion properties
In some optical communication systems such as fiber-optic community antanna television
(CATV) systems, many optical signals with different modulation frequencies are inputted to
a PD. In this case, non-linearity properties of PD should be supressed to re-generate elctrical
signals from optical signals without distortions.
When a device shows nonlinear response, input-output relation is represented as shown in
Figure 9. An output can be expressed as polymomials of input signal. With this nonlinear
relations, supurious outputs of which frequencies are f2+f1, f2-f1, 2f1-f2, 2f2-f1 can be
generated when sinusoidal inputs of which frequencies are f1, f2, , are applied to device.
These supurious outputs should be filtered out not to influence on original signals with
V(x) a1*V(x)+a2*V(x)
2
+a3*V(x)
3
+…
cos(ω1∗t)
+cos(ω2∗t)
+cos(ω3∗t)
cos[ ω1*t] +cos[ ω2*t]
+ cos[ 2*ω1* t] +cos[ 2* ω2*t]
…
+cos[ (ω1+ ω2)*t]
+cos[ (2*ω2− ω1)∗t)
…………
Nonlinear device
Nonlinear device
V(x) a1*V(x)+a2*V(x)
2
+a3*V(x)
3
+…
cos(ω1∗t)
+cos(ω2∗t)
+cos(ω3∗t)
cos[ ω1*t] +cos[ ω2*t]
+ cos[ 2*ω1* t] +cos[ 2* ω2*t]
…
+cos[ (ω1+ ω2)*t]
+cos[ (2*ω2− ω1)∗t)
…………
Nonlinear device
Nonlinear device
Fig. 9. Supurious signals from nonlinear devices
Advances in Optical and Photonic Devices
170
frequencies of f1, f2, As can be seen in Figure 10, however, frequencies of some supurious
outputs are close to frequencies of original signal. These supurious signals cannot be filtered
out and quality of converted signals from optical to electrical is degraded. The degree of
degradations is determined by linearity of PD. The second order intermodulation products
of two signals at f1 and f2 occur at f1+f2, f2-f1, 2·f1 and 2·f2. The third order intermodulation
products of two signals at f1 and f2 would be at 2·f1+f2, 2·f1-f2, f1+2·f2, and 2·f2-·f1. Among
these products, signals at f1+f2, 2·f1-f2 and 2·f2-·f1 are not filtered out. Therefore, to obtain
high purity signal among many signals, signals at f1+f2, 2·f1-f2 and 2·f2-·f1 should be
supressed when optical-to-electrical conversion occurs at PD. Signals at f2+f1 and f2-f1 are
the 2nd order intermodulation distortion (IMD2). Signals at 2·f1-f2 and 2·f2-·f1 are the 3rd
order intermodulation distortion (IMD3). The ratio of each intermoulation signal to original
signal should be as small as possible and the ratio is expressed with unit of dBc.
The main source of nonlinearity of PD is a space charge induced nonlinearity (K. J. Williams
et al, 1996), (Y. Kuhara et al, 1997). The photo-generated carriers induce space charges in a
intrinsic layer of PD. Carrier-dependent carrier velocities associated with a perturbed
electric filed due to space-charge and loading effect are main source of photodetector
nonlinear behavior. The amount of space-charge generated from photocurrents depends on
the power density of incident optical signal. The smaller a density of photo-currents are, the
smaller nonlinarity of PD are. To reduce a IMD2 and IMD3, a density of photo-generated
carriers should be reduced. WGPDs with thin absorption layer can have a suppressed
nonlinearity because thin absorption layer with a long absorption length produce a reduced
density of photo-carriers.
frequency
f1 f2
CH
1
signal
CH
2
2•f2- f1
2•f2- f1
Filter
curve
IMD3 : too close to be filtered
f
N
CH
N
f2+f1
f2+f1
Filter
curve
IMD2 : too close to be filtered
dBc
frequency
f1 f2
CH
1
signal
CH
2
2•f2- f1
2•f2- f1
Filter
curve
IMD3 : too close to be filtered
f
N
CH
N
f2+f1
f2+f1
Filter
curve
IMD2 : too close to be filtered
dBc
Fig. 10. Intermodulation signals close to original signals. IMD2 and IMD3 signals are too
close to original signal to be filtered out
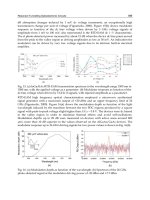
In Figure 11, IMD2 and IMD3 characteristics are presented for a Type (IV) WGPD with
width of 10
μm and length of 70μm. Its -3dB bandwidth was ~20GHz. The device shows
IMD2 of less than -70dBc for a DC photocurrent of 1mA, optical modulation index(OMI) of
0.7 and 50
Ω load. Also, IMD3 was less than -90dBc for the same conditions. IMD3 for a
voltage range of -6~-8V cannot be measured because IMD3 at that range is too small to be
detected within the limit of spectrum analyzer sensitivity.
Waveguide Photodiode (WGPD) with a Thin Absorption Layer
171
024681012
-100
-90
-80
-70
-60
-50
I
DC
=1mA, OMI=0.7
detector limit
f1=400MHz, f2=450.25MHz, R
load
=50Ω
2f1-f2
IMD3 [dBc]
Reverse voltage [V]
(a)IMD2 (b)IMD3
Fig. 11. IMD2 and IMD3 characteristics of a Type (IV) WGPD
4. Conclusion
A new WGPD with a thin absorption layer was introduced. Methods of design and
optimizations for this new type of WGPD were described. Absorber should be thicker than
100Å to obtain a high responsivity and low polarization dependency. A responsivity of
1.08A/W was achieved at 1550nm wavelength, which corresponds to an external quantum
efficiency of 86.4% with TE/TM polarization dependence less than 0.25dB. For the same
device, the bandwidth of ~40GHz was obtained. The formula for the transit-time limited
frequency response of this kind of devices was obtained. With this formula, optimization of
frequency response is possible. Also, this kind of devices can show a suppressed
nonlinearity.
5. References
K. Kato, S. Hata, K. Kawano, J. Yoshida, and A. Kozen, (1992), IEEE J. of Quantum Elect. Vol.
28, No. 12, pp. 2728-2735.
F. Xia, J. K. Thomson, M. R. Gokhale, P. V. Studenkov, J. Wei, W. Lin, and S. R. Forrest,
(2001),
IEEE Photon. Tech. Lett. Vol. 13, No. 8, pp. 845-847
T. Takeuchi, T. Nakata, K. Makita, and T. Torikai,
Proceedings of OFC 2001, Vol.3, Paper
WQ2-1.
M. Achouche, S. Demiguel, E. Derouin, D. Carpentier, F. Barthe, F. Blache, V. Magnin, J.
Harari, and D. Decoster,
Proceedings of OFC 2003, Paper WF5.
S. Demiguel, N. Li, X. Li, X. Zheng, J. Kim, J. C. Campbell, H. Lu, and K. A. Anselm, (2003),
IEEE Photon. Tech. Lett. Vol. 15, No.12, pp. 1761-1763.
G. Lucovsky, R. F. Schwarz, and R. B. Emmons, (1964)
J. of Applied Phys., Vol.35, No.3, pp.
622-628.
K. Kato, S. Hata, K. Kawano, and A. Kozen, (1993),
IEICE. Trans. Electron., Vol. E76-C, No. 2,
pp. 214-221.
S. Adachi, (1982),
J. of Applied Phys., vol.53 , pp. 8775-8792.
A. Galvanauskas, A. Gorelenok, Z. Dobrovol’skis, S. Kershulis, Yu. Pozhela, A. Reklaitis, N.
Shmidt, (1988),
Sov. Phys. Semicond., Vol.22, pp.1055-1058.
024681012
-80
-70
-60
-50
-40
-30
f1=400MHz, f2=450.25MHz, R
load
=50Ω
f1+f2
I
DC
=1.0mA, OMI=0.7
IMD2 [dBc]
Reverse Bias[V]
Advances in Optical and Photonic Devices
172
K. J. Williams, R. D. Esman, and M. Dagenais, (1996), .J. of Lightwave Tech.,Vol. 14, No. 1,
pp.84~96.
Y. Kuhara, Y. Fujimura, N. Nishiyama, Y. Michituji, H. Terauchi, and N. Yamabayashi,
(1997),
.J. of Lightwave Tech.,Vol. 15 No. 4, pp.636~641
10
Resonant Tunnelling Optoelectronic Circuits
José Figueiredo
1
, Bruno Romeira
1
, Thomas Slight
2
and Charles Ironside
2
1
Centro de Electrónica, Optoelectrónica e Telecomunicacões, Universidade do Algarve
2
Department of Electronics and Electrical Engineering, University of Glasgow
1
Portugal
2
United Kingdom
1. Introduction
Nowadays, most communication networks such as local area networks (LANs),
metropolitan area networks (MANs), and wide area networks (WANs) have replaced or are
about to replace coaxial cable or twisted copper wire with fiber optical cables. Light-wave
communication systems comprise a transmitter based on a visible or near-infrared light
source, whose carrier is modulated by the information signal to be transmitted, a
transmission media such as an optical fiber, eventually utilizing in-line optical amplification,
and a receiver based on a photo-detector that recovers the information signal (Liu,
1996)(Einarsson, 1996). The transmitter consists of a driver circuit along a semiconductor
laser or a light emitting diode (LED). The receiver is a signal processing circuit coupled to a
photo-detector such as a photodiode, an avalanche photodiode (APD), a phototransistor or a
high speed photoconductor that processes the photo-detected signal and recovers the
primitive information signal.
Transmitters and receivers are classical examples of optoelectronic integrated circuits
(OEICs) (Wada, 1994). OEIC technologies aim to emulate CMOS microelectronics by (i)
integrating optoelectronic devices and electronic circuitry on the same package or substrate
(hybrid integration), (ii) monolithically integrate III-V optoelectronic devices on silicon
(difficulty since silicon is not useful for many optoelectronic functions) or (iii) monolithically
integrate III-V electronics with optoelectronic devices. The simply way to do hybrid
integration is combining packaged devices on a ceramic substrate. More advanced
techniques include flip-chip/solder-ball or -bump integration of discrete optoelectronic
devices on multi-chip modules or directly on silicon integrated circuit (IC) chips, and flip-
bonding on IC chips. Although, hybrid integration offers immediate solutions when many
different kinds of devices need to be combined it produces OEICs with very low device
density. Moreover, in certain cases the advantages of using optical devices is greatly
reduced. On the contrary, monolithic integration leads to superior speed, component
density, reliability, complexity, and manufacturability (Katz, 1992).
There was been substantial efforts towards monolithical integration of III-V electronics with
optoelectronic devices to improve the performance of transmitters and receivers.
Approaches to light modulation, light detection and light generation at microwave and
millimetre-wave frequencies have been investigated by combining double barrier quantum
well (DBQW) resonant tunnelling diodes (RTDs) with optical components such as
Advances in Optical and Photonic Devices
174
waveguides (Figueiredo, 2000) and semiconductor lasers (Slight, 2006). These RTD based
OEICs can operate as novel optoelectronic voltage controlled oscillators (OVCOs), with
potential to simplify clock recovery circuits, improve control of microwave oscillators
functionalities, to generate electrical and optical aperiodic waveforms, and as microwave-to-
optical subcarrier and optical subcarrier-to-microwave converters for radio-over-fiber
systems, where the integration of electrical and optical components in a single chip is a
major challenge in order to obtain high reliability, small size and low cost (Sauer et al.,
2007).
This chapter reports investigation on resonant tunnelling (RT) based OEICs that
demonstrate new functionalities for optical modulators and sources for application in
telecommunication systems and signal processing circuits. Section 2 starts with a brief
description of DBQW-RTD’s operating principle, followed by the presentation of a physics
based model of its current-voltage (I –V) characteristic, continues with a small-signal
equivalent circuit analysis, and ends with an overview of more relevant optoelectronic
devices incorporating RT structures. Section 3 describes the integration of DBQW-RTDs
within an optical waveguide (OW) towards the implementation of very low driving voltage
electro-absorption modulators (EAMs) and optical detectors (OD), with built-in amplifiers,
for operation at optical wavelengths around 900 nm and 1550 nm. Section 4 discusses
monolithic and hybrid integration of a DBQW-RTD with a laser diode (LD), its operation
principle and optoelectronics circuit model used to analyse its modes of operation including
optoelectronic voltage controlled oscillator (OVCO), frequency division and multiplication,
phase-locking, and the generation of aperiodic, even chaotic, waveforms. The chapter ends
with conclusion and acknowledgement sections.
2. Resonant tunnelling diode
Resonant tunnelling diodes (RTDs) are nanoelectronic structures that can be easily
integrated with conventional electronic and photonic devices (Davies, 1998)(Mizuta &
Tanoue, 1995)(Sun et al., 1998), such as transistors (Mazumder et al., 1998), optical
waveguides (McMeekin et al., 1994)(Figueiredo, 2000) and laser diodes (Slight, 2006) with
potential to not only reduce power consumption and cost but also increase functionality,
speed and circuit reliability, without losing any advantage of using optical devices. They
have two distinct features when compared with other semiconductor devices (Mazumder et
al., 1998): their potential for extremely high frequency operation up to terahertz and their
negative differential conductance (NDC). The former arises from the very small size of the
resonant tunnelling structure along the direction of carriers transport. The second
corresponds to electric gain which makes possible to operate RTDs as amplifiers and
oscillators, significantly reducing the number of elements required for a given function
(Mazumder et al., 1998). Functional RTD based devices and circuits span from signal
generators, detectors and mixers, multi-valued logic switches, low-power amplifiers, local
oscillators, frequency locking circuits, and also as generators of multiple high frequency
harmonics (Mizuta & Tanoue, 1995). In this section, the physics of double barrier quantum
well resonant tunnelling diodes (DBQW-RTDs) is discussed and analyzed, aiming at its
application in high speed optoelectronic converters (rf-optical and optical-rf), such as light
emitters, light modulators and light detectors.
Resonant Tunnelling Optoelectronic Circuits
175
2.1 Double barrier quantum well RTD
Resonant tunnelling through double potential barriers was predicted by (Bohm, 1951).
Latter, (Iogansen, 1964) discussed the possibility of resonant transmission of an electron
through double barriers formed in semiconductor crystals. They concluded that structures
with identical barriers show tunnelling transmission coefficients of 1 when the particles
incident energy equals the structure resonant energies, however small the transmission
through the individual barriers may be (Mizuta & Tanoue, 1995). Figure 1 compares
schematically the transmission coefficient T(E) for single and symmetrical double barrier
structures. The transmission coefficient lobs broadens with increasing energy because the
barriers become more transparent (Davies, 1998).
E
c
E
E
c
E
U
0
0
0.5
1.0
E
E
E
transmission coefficient
z
0
U
1
2
3
10
10
-8
10
-4
0
z
E (a. u)
Fig. 1. Single and DBQW transmission coefficients as function of incident carrier energy.
A semiconductor double barrier quantum well resonant tunnelling diode (DBQW-RTD)
consists of a low band-gap semiconductor layer (the quantum well, typical 5 nm to 10 nm
wide) surrounded by two thinner layers of higher band-gap material (barriers, typical 1.5
nm to 5 nm), both sandwiched between low band-gap n-type material layers, typical the
well material, as schematically shown in Fig. 2(a) (Mizuta & Tanoue, 1995). The material
forming the barriers must have a positive conduction-band offset with respect to the smaller
bandgap materials (Weisbuch & Vinter, 1991). When both sides are terminated by highly
doped semiconductor layer (the emitter and the collector contacts) for electrical connection
the structure is called resonant tunnelling diode (RTD). Figure 2(b) shows a schematic of a n-
type Al-GaAs/GaAs DBQW-RTD, together with the Γ-conduction band profiles at around
zero volts and at the peak voltage. Because finite height of the energy barriers the allowed
energy states in the well region become quasi-bound or resonant states, Fig. 2(a), rather than
true bound states as it happens with thicker barrier quantum wells (Davies, 1998). In
consequence, tunneling of charge carriers through the barriers is strongly enhanced when
their energy equals to one of well energy levels, reaching much higher values than the
product of the two individual barrier transmission coefficients at the energy values of the
system resonant levels, see Fig. 1.
Fig. 2. (a) DBQW semiconductor structure. (b) AlGaAs DBQW structure (left); Γ-conduction
band profiles at zero and at the first resonance voltage (right).
Advances in Optical and Photonic Devices
176
Under applied bias, the overall carrier flow through a DBQW-RTD is qualitatively different
from that of a single barrier diode since the double barrier structure acts as a band filter to
charge carrier energy distribution (Mizuta & Tanoue, 1995)(Sun et al., 1998). This filter action is
exploited applying a voltage across the DBQW structure to control the number of carriers that
can take part in the conduction through resonant levels. The carrier transmission coefficient
maxima shown in Fig. 1 give rise to current-voltage characteristics with regions of strong
NDC. The resonant tunnelling phenomenon in AlGaAs DBQW structures was first predicted
in 1973 (Tsu & Esaki, 1973), and demonstrated experimentally in 1974 (Chang et al., 1974). In
1983, Sollner et al. demonstrated resonant tunnelling through quantum wells at frequencies up
to 2.5 THz (Sollner et al., 1983). Figure 3(a) shows a typical InGaAs/AlAs RTD I –V
characteristic. The main carrier flow processes in a DBQW-RTD polarized at the peak voltage
(the current first maxima) is schematically represented in Fig. 3(b).
Fig. 3. (a) Typical InGaAlAs RTD I-V characteristic. (b) Current transport mechanisms in
DBQW-RTDs at the peak voltage (Sun et al., 1998).
The RTD current-voltage characteristic of Fig. 3(a) can be understood with the help of the Γ-
conduction band profile shown in Figs. 2(b) and 3(b) (Davies, 1998). When the applied bias
is small, i.e., V << V
p
(peak voltage, also referred as resonance voltage), the Γ-conduction
band profile is not much affected, remaining almost flat, see Fig. 2(b). The first resonant
level is well above the emitter Fermi level, and little current flows. As voltage is increased,
the energy of the first resonant level is moved downwards to the emitter Fermi level,
leading to an almost linearly current increase with the voltage, the first positive differential
conductance (PDC) region, till reaching a local maximum I
p
, ideally, at V 2E
n=1
/e, when
the overlap between the emitter electron Fermi sea energy spectrum and the transmission
coefficient around the first resonant level reaches a local maximum, as shown in the right
side of Fig. 2(b) and Fig. 3(b). A further increase in the applied voltage pulls the first
resonant level towards the bottom of the Γ-valley and into the forbidden gap, where there
are no longer carriers available to efficiently cross the DBQW. This leads to a sharp current
decrease, giving rise to the first negative differential conductance (NDC) portion of the
device current-voltage characteristic. At a given voltage, known as the valley voltage V
v
,
with V
v
> V
p
, the current reaches a local minimum I
v
. An additional increase on the bias
voltage will further lift up the emitter Fermi level and tunnelling through higher resonant
levels or through the top regions of the barriers will lead to new current rise, similar to the
classical diode I – V characteristic (Davies, 1998). The resonant tunnelling component
dominates at low voltages and the classical diode component takes over at higher voltages.
For more details see (Davies, 1998)(Sun et al., 1998). In a circuit, the NDC provides the gain
necessary to sustain oscillations (Mizuta & Tanoue, 1995) (Brown & Parker 1996). The
Resonant Tunnelling Optoelectronic Circuits
177
presence of a small inductance in circuit containing an RTD, together with RTD intrinsic
capacitance make possible the oscillations at very high frequencies, experimental
demonstrated up to 831 GHz (Suzuki et al., 2009). Frequencies never reached by other
semiconductor devices: the RTD is currently the fastest purely electronic device.
The most common material systems used to implement RTD devices are III-V compounds
such as AlGaAs and InP-based materials Si/SiGe RTDs based on Si/SiGe heterojunctions
have been demonstrated but the performance is not comparable to III-V RTDs because of the
limited band edge discontinuity in both valence and conduction bands. Organic RTDs are
currently being investigated (Park et al., 2006)(Ryu et al., 2007)(Zheng et al., 2009).
2.2 RTD based generalized Liénard oscillator
The RTDs inherent high speed operation, up to terahertz frequency, the pronounced
nonlinear current-voltage characteristic, wide-bandwidth NDC, structural simplicity,
flexible design, relative ease of fabrication, and versatile circuit functionality, make them
excellent candidates for nanoelectronic circuit applications. In order to take advantage of the
full potential of RTD based devices several attempts have been made to incorporate the full
RTD characteristics into circuit simulation packages such as SPICE-like CAD tools (Mizuta
& Tanoue, 1995)(Brown et al., 1996)(Sun et al., 1998).
Since a quantum mechanics based model that includes all RTD features is not yet available,
a number of empirical models have been advanced (Sun et al., 1998). Most models describe
the RTD by small-signal equivalent circuits consisting of a capacitance C, resulting from
charging and discharging of electrons of DBQW and depletion regions, in parallel with a
voltage depend current source I = F(V), a series resistance R arising mainly from the ohmic
contacts and an inductance L due to bond wire connections, Fig. 4. The current source F(V)
is usually implemented as polynomial or piecewise functions (Brown et al., 1997)(Sun et al.,
1998), which is not satisfactory if a detailed circuit description is needed. More useful RTD
non-linear characteristic representations have to consider a wide variety of device structures
and the materials available, i.e., the modelled I –V characteristic has to be based as much as
possible on the RTD physical parameters such as material properties, layer dimensions,
energy levels, dopant concentrations, and the device geometry.
Fig. 4. Electrical equivalent circuit of an RTD represented by a capacitance in parallel with a
voltage dependent current source F(V) . The inductance L and the resistor R are due to
bonding wires and contacts.
The physics based model proposed by Schulman et al. consists of a mathematical function
which provides a satisfactory I –V shape characteristic for InGaAs and GaAs RTD based
Advances in Optical and Photonic Devices
178
devices (Schulman et al., 1996). The expression obtained contains physical quantities which
can also be treated as empirical parameters for fitting purposes. In their analysis the
resonant tunnelling current density is expressed within the effective mass approximation
(Davies, 1998), which includes nonzero temperature, Fermi-Dirac statistics and the
transmission coefficient T(E,V):
(/2)/
*
1
(/2)/
23
1/2
=ln
tan
42/2
1
EEqV kT
Fr B
Br r
RT
EEqV kT
Fr B
r
qm k T E e E qV
J
E
e
π
π
−+
−
−−
⎡⎤
⎡
⎤
⎛⎞
⋅Δ + −
⋅+
⎢⎥
⎢
⎥
⎜⎟
Δ
+
⎢
⎥
⎢⎥
⎝⎠
⎣
⎦
⎣⎦
=
(1)
where E = E
r
–qV/2 is the energy measured up from the emitter conduction band edge, E
r
is
the energy of the resonant level relative to the bottom of the well at its centre, and ΔE
r
is the
resonance width. The parameters q and k
B
are unit electric charge and Boltzmann constants,
respectively. Equation 1 can be rewritten as:
()/
1
1
1
()/
1
1
()= ln
tan
2
1
qB C nV k T
B
RT
qB C nV k T
B
eCnV
JV A
D
e
π
−+
−
−−
⎡⎤
⎡
⎤+−
⎛⎞
⋅⋅+
⎢⎥
⎜⎟
⎢
⎥
+
⎝⎠
⎣
⎦
⎢⎥
⎣⎦
(2)
where the parameters A, B, C, D, and n
1
can be used to shape the curve to match the first
PDC region of the measured I –V characteristic, having at the same time a well-defined
physical interpretation: A and B are related, among other factors, with resonance width and
Fermi level energies, and allow adjustment of the RTD peak current; C and n
1
determine
essentially the RTD peak voltage, correlated with the energy of the resonant level relative to
the bottom of the well and with the transmission coefficient; finally, D is related to the
resonance width ΔE
r
.
In order to represent the increasing valley current due to tunnelling through higher
resonances or thermal excitation over the barriers, an additional current density component,
identical to the classical diode current, the non-resonant term J
NR
, have to be included:
(
)
/
2
()= 1
nqVk T
B
NR
JV He
−
(3)
Parameters D and H adjustment of adjust the peak to valley current ratio (PVCR) and the
peak to valley voltage ratio (PVVR).
Equations 2 and 3 give good estimations of the peak current and the NDC region of current-
voltage characteristic. The final form of the RTD current-voltage curve is then given by:
()= () ()= [ () ()]
RT NR RT NR
IV I V I V M J V J V
+
+ (4)
where the multiplying factor M is used to scale equation 4, in order to take into account the
devices area. Figure 5 shows experimental I – V curves of AlGaAs (a), and InGaAlAs (b),
RTDs, with the corresponding fit given by equation 4. The fits assumed operation at
temperature T =300 K and a multiplying factor M=2×10
-6
cm
2
, with the following
parameters: A=1950 A/cm
2
, B=0.05 V, C=0.0874 V, D=0.0073 V, n
1
=0.0352, H=18343 A/cm
2
,
and n
2
=0.0031 for AlGaAs; A=3800 A/cm
2
, B=0.068 V, C=0.1035 V, D=0.0088 V, n
1
=0.0862,
H=4515 A/cm
2
, and n
2
=0.0127 for InGaAlAs. Higher values of A and B are used in the
InGaAlAs fitting due to RTD higher peak current; parameter D was also slightly larger for
the InGaAlAs due to superior PVCR and PVVR. The parameter H was around four times
larger in the AlGaAs due mainly to their higher peak voltages.
Resonant Tunnelling Optoelectronic Circuits
179
Fig. 5. GaAs/AlAs (a) and InGaAs/AlAs (b) RTD experimental I –Vs and fittings.
Since the RTD is a voltage-dependent current source device, when incorporated in a
resonant circuit and biased in the NDC portion of its I –V characteristic produces oscillations
at circuit characteristic frequency (Brown & Parker, 1996). In order to understand the origin
of the circuit self-oscillations induced by the RTD we consider the small-signal equivalent
circuit of Fig. 4. Typical RTD switching times are in general dominated by the effects of
current densities and capacitances, i.e., by the circuit RC time constant (Brown et al., 1997)
(Brown & Parker, 1996).
A general analysis of a circuit containing an RTD considers the small signal equivalent
circuit of Fig. 4, where the RTD non-linear I –V characteristic is represented by a voltage
dependent current source F(V), given by equation 4, in parallel with RTD intrinsic
capacitance C. Resistor R and inductor L encompasses for the device series resistance and
connections inductance, respectively. By applying Kirchoff’s laws (using Faraday’s law) to
the circuit of Fig. 4, the voltage V across the capacitance C and the current I through the
inductor L are given by the following set of two first-order non-autonomous differential
equations (Slight et al., 2008):
[]
1
()=−
VIFV
C
(5)
()
1
=
dc
IVRIV
L
−−
(6)
After some algebra, we find that the system of Eqs. 5-6 is equivalent to the following second-
order differential equation, referred as one of the generalized nonlinear Liénard systems
(Slight et al., 2008)(Figueiredo, 1970):
[]
1() 1
() 0
⎡⎤
+
++−+=
⎢⎥
⎣⎦
dc
RdFV
VVVVRFV
LCdV LC
(7)
() ()=0VHVVGV++
(8)
“where
1()
()=+
R
dF V
HV
LCdV
and
[]
1
() ()=−+
dc
GV V V RFV
LC
. G(V) is a nonlinear force and
()
HVVis a damping factor.
Advances in Optical and Photonic Devices
180
The circuit of Fig. 4 dc biased in the NDC acts as a relaxation oscillator producing
oscillations at a frequency around
(
)
1
0
() 2 ()
π
−
≈⋅fV LCV , the circuit characteristic
frequency, whenever the series R is smaller than the RTD operating point negative
differential resistance (Brown & Parker, 1996). From the application point of view the
wideband NDC of RTD leads to low frequency oscillations instabilities that are detrimental.
A most common source of instability arises from the dc source circuitry by introducing in
the circuit an equivalent inductance, which together with RTD capacitance leads to
oscillations at around few megahertz (Figueiredo, 2000)(Slight, 2006). A method to eliminate
these low frequency oscillations and allowing circuit operation at much higher frequency is
to place a shunt capacitor across the terminals of the device (Kidner et al., 1990)(Huang et
al., 1997). The inductance is now only due to the connection from the shunt capacitor to the
RTD.
2.3 Optoelectronic applications of RT structures
Several optoelectronic devices and circuits whose functions depend on embedded resonant
tunnelling structures have been proposed and demonstrated, including resonant tunneling
light emitting diodes (RT-LEDs) (Van Hoof et al., 1992), vertically integrated semiconductor
lasers with RTDs (Grave et al., 1991), resonant tunnelling effect quantum-well lasers
(Kawamura et al., 1994), resonant tunnelling injection laser (Capasso et al., 1986), multi-
quantum well (MQW) lasers (Kawamura et al., 1987) and photo-detecting (PD) structures
(Chen et al., 1991). The nature and the energies involved in the carrier transition induced by
the light interaction with the tunnelling layers determine the operation in the optical or in
the infrared part of the electromagnetic spectrum. Optical applications such as photo-
detection, light emission, optical switching, utilize inter-band transitions (band-gap
transitions), whereas infrared applications include intra-band and inter-sub-band photo-
detection, and infrared emission. Below is presented a brief summary of the main progress
on optical and optoelectronic devices whose functionalities depend of embedded RT
structures.
Bistability in the light output of bipolar RT-LEDs has been reported, showing that these
devices are capable of ultrafast optical switching and high frequency optical oscillation (Van
Hoof et al., 1993). Laser transistors incorporating a resonant tunnelling structure have been
reported, with carrier injection or extraction controlled via resonant tunnelling structure,
with light output controlled by the collector voltage and achieving higher speed than with
conventional semiconductor lasers (Kawamura et al., 1992). Embedding RTs into multi-
quantum well (MQW) devices introduces negative differential conductance over wide
valley region, which is very effective for getting large voltage switching and high on/off
ratio current switching (Kawamura et al., 1988) leading to electro-optic bistability (Chen et
al., 1991). Optical bistability in QW lasers integrated with DBQW-RTDs, and a RTD with a
MQW modulator/detector based on the p – i(MQW)–n configuration, operating at room
temperature, were reported (Kawamura et al., 1994). Clear negative differential conductance
and bistability, with high contrast and high sensitivity in resonant tunnelling triangular
barrier optoelectronic switch (R-TOPS), which consists of a double barrier resonant
tunnelling diode and a triangular barrier phototransistor has been demonstrated (Sakata et
al., 1995).
A light pulse incident upon a resonant tunnelling diode produces photo-charges that reduce
the series resistance, leading to a shift of the peak and valley voltages which can induce RTD
Resonant Tunnelling Optoelectronic Circuits
181
switching and give rise to changes in the current flow (Moise et al., 1995). Optically
switched resonant tunnelling diode (ORTD) photo-detectors have been demonstrated
(Moise et al., 1997). Phase locking of an oscillating GaAs/AlGaAs RTD to a train of light
pulses achieved by direct illumination was reported (Lann et al., 1993), as well as optical
switching in resonant tunnelling diode (England et al., 1991) and optical injection locking of
the resonant tunnelling oscillator (Kan et al., 2001). The RT structures can be used to
implement light-by-light switching (England et al., 1991). Ultra-fast optoelectronic circuits
using RTDs and uni-travelling-carrier photodiodes (UTC-PDs) to de-multiplex ultra-fast
optical data signals into electrical data signals with lower bit rate and low power
consumption has been demonstrated (Sano et al., 1998).
Our work on optoelectronic devices based on the integration of a RTD within an optical
waveguide, and on hybrid and monolithic integrations of RTDs with laser diodes is
discussed in the remaining sections of this chapter.
3. RTD optical waveguide modulator-photodetector
Novel information and communication technologies relying on microwave/millimetre-
wavelightwave interactions are fundamental to the development of applications such as
low-cost fibre-optic communication networks, cable television signal distribution, mobile
communications, and radio local area networks (Sauer et al., 2007). In this section, electrical
active, high speed, highly efficient and low-cost electro-absorption modulators and photo-
detectors based on the integration of a RT structure within a semiconductor optical
waveguide are described.
3.1 RTD optical waveguide integration
As discussed previously, when the RTD is biased in the valley region most of the applied
voltage is dropped across the depletion region formed between the second barrier and the
collector contact, Fig. 6(a), where a strong electric field builds-in. Inter-band electro-
absorption of light with photon energies close to but smaller than the collector band-gap
energy is achieved through the Franz-Keldysh effect (Chuang, 1995). According to the
Franz-Keldysh effect the semiconductor material optical absorption band-edge is broadened
by the presence of an electric field, resulting in an increase of absorption of light with
photon energies smaller but close to the material band-gap (Keldysh, 1958). This effect is
used to implement either electro-absorption (EAM) (intensity) modulators (Wakita et al.,
1998) or waveguide photo-detectors (Chuang, 1995). However, in typical RTD structures the
light is injected perpendicularly to the tunnelling plane, which gives a light interaction
(absorption) length well below 100 nm, and thus very small light absorption. This limitation
can be easily overcome embedding the RTD into the core of a unipolar semiconductor
optical waveguide (McMeekin et al., 1994). A typical waveguide structure is represented
schematically in Fig. 6(a), showing also wafer
Γ-conduction band-edge and refractive index
profiles. This optoelectronic device is called resonant tunnelling diode optical waveguide
(RTD-OW). The waveguide refractive index distribution confines light end-fire coupled
along the tunnelling layers and the collector depleted region, therefore increasing
substantially the light interaction volume along the waveguide length as indicated in Fig. 6(b).
The RTD-OW, apart from the light confining layers (the lower refractive index regions –
upper and lower cladding layers), corresponds to a DBQW-RTD with thick low doped
Advances in Optical and Photonic Devices
182
500
m
500
m
Light
E
c
substrate
lower cladding / lower contact layer
depleted spacer layer
undepleted spacer layer
cladding
upper
upper
core
core
lower
DBQW-RTD
W
undepleted spacer layer
top contact
}
z
z
n
(a)
(b)
top cladding layer
µ
µ
Fig. 6. (a) Diagram of a unipolar resonant tunnelling diode optical waveguide (RTD-OW)
wafer structure, and the corresponding
Γ-conduction band-edge and refractive index
profiles. (b) Ridged waveguide channel configuration.
emitter and collector spacer layers. The presence of the DBQW within the waveguide core
modifies the unipolar waveguide linear current-voltage characteristic towards the DBQW-
RTD strong nonlinear I –V curve (McMeekin et al., 1994)(Figueiredo, 2000). Moreover, it
leads to a non-linear electric field distribution across the collector side waveguide core that
is strongly dependent on the bias voltage, due to the electron accumulation close to the
emitter barrier and the creation of a depletion region on the collector spacer layer. Since a
small voltage can be used to make a RTD operating point to switch between peak and valley
regions, the RTD-OW can be employed to implement electro-absorption modulators
(McMeekin et al., 1994)(Figueiredo, 2000). A small voltage change results in large
modulation of the electric field across the device collector depletion region, resulting,
though the Franz-Keldysh effect, in waveguide propagation losses and electro-absorption
for photon energies close to but smaller than the waveguide core band-gap energy
(Figueiredo, 2000)(Figueiredo et al., 2001).
The RTD-OW electric field distribution dependence on the bias voltage can be understood
by considering the
Γ-conduction band profile of the collector spacer layer, Fig. 7. Below
resonance (first PDC region), the applied voltage is dropped mainly across the DBQW, and
the electric field in the collector core is rather small, Fig. 7(a). Any optical loss increase with
the applied voltage is mainly due to the thermal effects induced by the current flow, which
rise linearly with the current. Above resonance (in the NDC and on the second PDC region),
the additional applied bias voltage is dropped mainly across the depleted part of the
collector spacer layer, Fig. 7(b), and the electric field magnitude is now much stronger than
on the first PDC region, inducing large light absorption. The thermal optical absorption is
now much less important because the current flowing through the devices biased on the
valley region is significantly lower.
Fig. 7. Effect of applied biased on RTD-OW
Γ-band: (a) before the peak and (b) on the valley.
Resonant Tunnelling Optoelectronic Circuits
183
The electric field enhancement
ΔE
VP
induced by the peak to valley switching can be
estimated as (Figueiredo, 2000)(Figueiredo et al., 2001):
/(/2)
VP VP dep dep sat PV
EVWW J
ε
υ
Δ
Δ+ Δ (9)
where
ΔV
VP
is the voltage dropped across the depletion region, ΔJ
PV
is the corresponding
current density change,
υ
sat
is the carrier saturation velocity and W
dep
is the depletion
thickness. At a given photon energy the absorption change induced by the electric field
enhancement due to the peak to valley switching is given by (Figueiredo, 2000):
(, )=(,) (,) (, )
VP V P VP
E
EE E
αω αω αω αω
ΔΔ − ≈Δ==== (10)
where
α
(=
ω
,E) is given, in the weak field approximation, by the Franz-Keldysh effect
electroabsorption coefficient (Chuang, 1995)(Keldysh, 1958). The light modulation depth
due to the peak to valley switching can be calculated using (Chuang, 1995):
(dB) 4.343 ( , )
VP f VP
RE
γ
αω
≈
ΔΔ=A (11)
where
γ
f
is the optical filling factor which corresponds to the fraction of the optical power
guided in the depleted region of the waveguide, and A is the RTD-OW electrically active
length, defined by the RTD metal contacts length [see Fig. 6(b)]. The measured Franz-
Keldysh effect effective band-edge shift to longer wavelengths can be compared with the
value given by theory (Chuang, 1995)(Keldysh, 1958):
22221/32/3
(/)( /8 )
g
grVP
hc e h m E
λλ π
ΔΔ (12)
The measured
Δ
λ
g
gives an independent way to determine the electric field change ΔE
VP
induced by the peak to valley switching.
As mentioned, RTD-OWs designed to show considerable NDC with a significant portion of
the waveguide core being depleted at bias voltages higher than the peak voltage can have
their operation point switched between the two I –V PDC regions by small high frequency
ac signals (< 1 V). This leads to high speed electric field switching, resulting in high
frequency modulation of the waveguide optical transmission loss. In this mode of operation
the RTD-OW is called a resonant tunnelling diode electro-absorption modulator (RTD-
EAM). In the RTD-EAM the modulation depth depends essentially on the overlap between
the electric field in the collector depleted volume and the optical mode. The peak to valley
electric field magnitude boost is determined mainly by the NDC region characteristics,
ΔV
and
ΔJ. Figure 8 represents schematically the light absorption on the collector depleted
region induced by the Franz-Keldysh effect when the RTD-OW is biased on the valley
region, Fig. 8(a), and the change in the absorption coefficient associated with the bistable
switching of the device plotted against wavelength, Fig. 8(b).
The device concept was implemented using AlGaAs ternary material system for operation
on 900 nm optical window, and InGaAlAs quaternary compound to work on 1300 nm and
1550 nm optical windows, where the optical fibre present zero dispersion and have the
lowest losses, respectively. For operation in the 900 nm spectral region, GaAs was used to
form the waveguide core and the quantum well; AlAs and AlGaAs were employed to form
the barriers and waveguide cladding layers, respectively. For operation at around 1550 nm,
Advances in Optical and Photonic Devices
184
Fig. 8. (a) Schematic diagram of light absorption induced by Franz-Keldysh effect in a RTD-
OW biased around the valley point. (b) Change in absorption produced by the change in the
voltage characteristic of the NDC pulse plotted with the absorption in dB/cm of bulk GaAs
against wavelength (McMeekin et al., 1994).
the InGaAlAs quaternary material system was used to implement the waveguide core and
the quantum well, with AlAs and In
0.48
Al
0.52
As/InP being employed for the barriers and the
waveguide cladding layers, respectively. The InGaAsP quaternary compound also allows
operation on 1300 nm and 1550 nm optical windows but was not used. A detailed
description of the RTD-OW structures implemented can be found in (Figueiredo, 2000).
Next we describe the experimental operation of RTD-OW electro-absorption modulators on
the optical communication windows around 900 nm and 1550 nm.
3.2 RTD-OW operation as EAM at 900 nm
The RTD-OW operation as an electro-absorption modulator at around 900 nm was achieved
by growing the waveguide and DBQW layers using the AlGaAs/GaAs material system on
semi-insulating GaAs. The GaAs waveguide core was made 1
μ
m thick to allow easy end-fire
light coupling, with n-type Si doping concentration of 2 ×10
16
cm
–3
; the cladding layers were
made of Al
0.33
Ga
0.67
As, a direct band-gap compound alloy, with Si doping concentration
around 2 × 10
18
cm
–
3
. The refractive index difference between the core and cladding layers
around 0.224 at 900 nm is sufficiently to obtain efficient light confinement with relatively
thin cladding layers. The upper cladding layer thickness was made 300 nm thick, twice the
reciprocal of the optical waveguide first mode exponential decaying factor, to keep the
device series resistance low. Because the waveguide core and the substrate have similar real
refractive indices, the lower cladding layer was made 600 nm thick with Si doping
concentration of 2×10
18
cm
–3
, to act as an isolation layer separating the core from the
substrate, in order to significantly reduce radiation leakage into the GaAs substrate. The
DBQW consisted of a 7 nm GaAs quantum well sandwiched between 1.4 nm AlAs barriers.
The detailed description and fabrication of AlGaAs/GaAs structures can be found in
(Figueiredo, 2000). Figure 9 shows the top view of a RTD-OW die and a packaged device.
When dc biased in the NDC region, all tested devices showed instabilities at around few
MHz. These where removed connecting devices to the dc power supply via a wide
bandwidth bias-T. In certain cases, a high frequency energy-storage element, such as a coax
transmission line, was inserted between the RTD and the bias-T, resulting in a RTD-EAM
transmission line relaxation oscillator whenever the cavity characteristic frequency was
within the NDC bandwidth (Figueiredo et al., 1999). Typical electrical relaxation oscillations
due to a 15 cm long coaxial transmission line are shown in Fig. 10(a). The relaxation
oscillations RF spectra show harmonic components up to 15 GHz (Figueiredo, 2000). The
free-running oscillation frequency was changeable by varying the optical power coupled
Resonant Tunnelling Optoelectronic Circuits
185
Fig. 9. RTD-OW die top view and a packaged device. The parameter
A here represents
devices electrical active length, which with the waveguide width defines devices active area.
into the RTD-EAM, as shown in Fig. 10(b); in the cases observed the free-running frequency
decreased when the coupled optical power was increased. In a circuit with a free-running
oscillation frequency around 470 MHz, a tuning range of 10 MHz was observed. The
frequency tuning effect is mainly due to the creation of charge carriers in the depletion
region that reduces the device series resistance and moves the operating point through the
NDC region, which change the device impedance [mainly the capacitance and the negative
differential resistance (NDR)]. In the experiment light from a tunable Ti:sapphire laser
emitting at around 900 nm was used; the optical power was kept to few mW in order to
avoid damaging waveguide input facet.
coaxial cable 15 cm long
(a)
(b)
Fig. 10. (a) Self-sustained oscillations in a RTD-EAM connected via a 15 cm long coaxial line.
(b) Self-oscillations frequency tuning induced by incident light.
The free-running relaxation oscillation frequency is also affected by the dc bias voltage
because of the device intrinsic impedance dependence on the voltage. These behaviours can
be used to implement both optical controlled oscillators (OCOs) and voltage controlled
oscillators (VCOs). The OCO can be used to optically control microwave oscillators, and will
be briefly analyzed when discussing the RTD-OW operation as photo-detector. The VCO
behaviour makes possible operating the RTD-EAM as an optoelectronic voltage controlled
oscillator (OVCO) since the electric field across the depleted collector region also self-
oscillates at the free-running frequency, self-modulating the transmission properties of the
waveguide. Before discussing OVCO operation we present electro-absorption response of
the RTD-EAM. The RTD-EAM waveguide transmission spectra at zero bias, at slightly
below the peak, and just above the valley points, are shown in Fig. 11(a) for devices with
active areas around 800
μ
m
2
. (The devices were not dc biased in the NDC region in order to
avoid self-oscillation.) As the applied voltage increases from the peak to the valley point,
Advances in Optical and Photonic Devices
186
there is a sharp drop in the waveguide transmission at wavelengths in the range 890 nm to
910 nm. The observed Franz-Keldysh absorption band-edge shift was around 12 nm which
compares to 9 nm estimated using equation 12, taking in consideration the approximations
made (Figueiredo, 2000). Figure 11(b) presents the optical modulation depth as a function of
the operating wavelength due to the transition between the two positive PDC regions
induced by a square signal with peak-to-peak voltage slight higher than
ΔV
VP
= V
V
–V
P
.
Modulation depth up to 13 dB around 908 nm was achieved. Modulation depths up to 18 dB
were observed in waveguides with 400
μ
m active length and 4
μ
m wide ridges.
Q
1
Q
Q
2
3
2
V
V
3
V
I
s
1
s
s
V
s
2
800 m active area
s
V
R
RTD
875 885 895 905 915 925
750
500
250
0
Wavelength (nm)
Transmission (a.u.)
V =0
V <V
p
V >V
v
s
s
s
875 885 895 905 915 925
time
V
I
800 m active area
2
Modulation depth (dB)
0
8
12
4
16
Wavelength (nm)
(a)
(b)
µµ
Fig. 11. (a) AlGaAs RTD-EAM optical transmission spectrum at zero volts, around the peak
and at the valley region. (b) Modulation depth as function of the operating wavelength due
to peak-to-valley switching induced by a square voltage waveform.
Direct modulation was obtained dc biasing the RTD-EAM slightly above the valley point
and injecting through a wide band bias-T the rf modulating signals. Figure 12 shows
examples of modulation due to 950 MHz and 16 GHz rf signal voltages. In both cases the
driving signals amplitude was kept slightly larger than
ΔV
VP
~ 0.4 V. Optical modulation
depths as high as 11 dB were achieved (Figueiredo et al., 1999)(Figueiredo, 2000). The 16
GHz response shown in Fig. 12(b) gives a good estimation of the bandwidth and
modulation depth potential of the devices. The modulation efficiency characterized by the
bandwidth-to-drive-voltage ratio, defined as the ratio of the operation bandwidth to the
operating voltage for at least 10 dB modulation depth, was 40 GHz/V (Figueiredo et al.,
1999)(Figueiredo, 2000).
(a) (b)
-120
-115
-110
-105
-100
-95
-90
-85
-80
RF power (dB)
Frequency
16 GHz
0
40
80
120
6.0
Time (ns)
0
3.0
1.0
5.0
2.0 4.0
Light transmission (a.u.)
Fig. 12. (a) Direct modulation at around 950 MHz, with modulation depth up to 11 dB
(
λ
=908 nm). (b) Modulator response to a 16 GHz rf signal.
Resonant Tunnelling Optoelectronic Circuits
187
As discussed previously, when dc biased in the NDC region and connected to a bias-T
through a coaxial line the RTD-EAM can operate in the self-oscillation mode, producing an
optical output modulated by the NDC induced relaxation oscillations, at frequencies
determined by the electrical length of the transmission line, as shown in Fig. 13.
Time (ps)
Light transmission (a.u.)
0
50
100
150
0 3750 7500 11250
Time (ps)
Light transmission (a.u.)
0
50
100
150
0 3750 7500 11250
200
(a)
(b)
Fig. 13. Optical responses measured with Streak Camera of RTD-EAM transmission line
relaxation oscillators with lines 15 cm (a) and 10 cm (b) long.
The AlGaAs RTD-EAM operation modes discussed above can be employed in LANs
systems primarily as devices for electrically controlling guided-wave optical signals in the
880 nm to 1100 nm wavelength range such as waveguide intensity modulators, directional
couplers and optical switches. The capability to operate in relaxation oscillation mode can be
applied in clock extraction circuits, for optical pulse generation and de-multiplexing in
optical time division multiplexed systems.
3.3 RTD-OW operation as EAM at 1550 nm
The AlGaAs/GaAs RTD-EAM achieved performances led the work to the demonstration of
device concept operation at 1550 nm, where standard single-mode optical fibres have lowest
losses (Liu, 1996). For band gap energies between 0.75 eV and 1.439 eV, quaternary alloys
lattice matched to InP, which combine In, Ga, Al, and As (In
1–x–y
Ga
x
Al
y
As) or In, Ga, As, and
P (In
1–x–y
Ga
x
As
1–y
P
y
), can be used (Chuang, 1995)(Figueiredo, 2000). The RTD-OW concept
operating at 1550 nm was demonstrated using InGaAlAs lattice matched to InP because
phosphorus based heterostructures have lower conduction band discontinuity, which
prevents strong localization of electrons in the lower band gap material. Moreover, they are
difficult to grow with conventional MBE systems due to the need to handle solid
phosphorus and high concentration of phosphorus at its vapour pressure, and also due to
the difficulty to control As/P ratio.
1
The InGaAlAs material system shows more favorable
material properties such as higher electron mobility, lower effective mass and superior
conduction bandedge discontinuity (Figueiredo, 2000). As a consequence it is expected the
InGaAlAs RTD-OW shows superior speed and modulation depth performance mainly to
the InGaAs RTD higher peak current density and peak-to-valley current ratio, and smaller
operating voltage. The In- GaAlAs quaternary system lattice matched to InP allows as well
operation at 1300 nm, where standard single-mode optical fibres show zero dispersion
(Chuang, 1995)(Figueiredo, 2000).
1
Structures incorporating InGaAsP are usually grown by MOCVD (Bohrer et al., 1993).
Advances in Optical and Photonic Devices
188
The InGaAlAs RTD-OW schematic wafer structure for operation at 1550 nm is shown in Fig.
14, with wafer
Γ-valley and refractive index profiles. The core consisted of two
In
0.53
Ga
0.42
Al
0.05
As layers (refractive index of 3.56), 0.5
μ
m thick each, with a band-gap
energy around 0.826 eV (absorption band-edge wavelength around 1500 nm), to allow
operation at 1550 nm when biased around the peak voltage. The upper cladding was
implemented using a layer of In
0.52
Al
0.48
As, refractive index of 3.24. Because InP refractive
index at 1550 nm ( 3.17) is considerably smaller than the In
0.53
Ga
0.42
Al
0.05
As refractive index,
the n-type InP substrate acted as lower cladding region. As previously discussed, the upper
cladding layer thickness was made 300 nm thick. A detailed description of the wafer
structure is given in (Figueiredo, 2000). Most of the RTD-EAMs characterized were 4
μ
m
wide ridges with 200
μ
m active lengths. Typical current-voltage characteristic of 4
μ
m × 200
μ
m InGaAlAs/InP RTD-EAM is presented in Fig. 5(b) (section 2), showing PVCR around 3.
These devices showed valley-to-peak voltage differences
ΔV
VP
~ 0.8 V, with peak-to-valley
current density differences
ΔJ
PV
~ 10 kA/cm
2
. (Typical GaAs/AlAs devices show ΔV
VP
~ 0.4
V and
ΔJ
PV
~ 5 kA/cm
2
.)
DBQW
500 nm
500 nm
300 nm
refractive index profile
-conduction band profile
16
16
2x10 cm
2x10 cm
18
19
z
z
-3
-3
-3
-3
30 nm
In Ga Al As upper core
0.050.42
In Ga Al As upper core
0.050.42
0.53
0.53
In Al As upper cladding
0.52
0.48
0.52
0.48
In Ga As contact layer
5x10 cm
5x10 cm
n+ InP substrate lower cladding
lower
Fig. 14. InGaAlAs RTD-EAM structure,
Γ-valley and refractive index profiles.
The devices’ frequency response was investigated by on wafer impedance measurements in
the 45 MHz to 18 GHz frequency range for all values of bias voltage. The results indicate the
InGaAlAs RTD-EAM small signal equivalent circuit consists of a capacitance C in parallel
with a non-linear resistor R
d
(V), in series with a resistance R
S
; the series inductance was
found to be negligible (Figueiredo, 2000)(Alkeev et al., 2000). The devices average
capacitance C and shunt resistance R around the NDC region were 1 pF and -15 Ω,
respectively; the R
S
was typical few ohms (less than 5 Ω) ((Figueiredo, 2000)(Alkeev et al.,
2000). The device switching time can be estimated as t
R
4(ΔV
VP
/ΔJ
PV
)C
V
, where C
V
is the
device capacitance per unit area (C
V
≈ ε/W
dep
(V)). For the devices tested the expected
modulation bandwidth was superior to 30 GHz (Figueiredo, 2000).
Following the frequency characterization, the waveguide low frequency electro-absorption
response was characterized with no applied voltage, dc biased at slightly below the peak
voltage, and on the valley region; the device was not dc biased in the NDC region in order
to avoid self-oscillations. Light from a Tunics diode laser, tunable in the wavelength range
1480 nm to 1580 nm was fibre coupled to the waveguide, with the light output fibre coupled
to an optical power meter or a high bandwidth photo-detector. The InGaAlAs/InP RTD-
EAM waveguide transmission spectrum change due to the Franz-Keldysh effect absorption
bandedge broadening induced by peak-to-valley switching is indicated in Fig. 15(a). The
measured wavelength band-edge shift was 43 nm, which compares quite well with the
estimation of 46 nm, equation 12. The low frequency electro-absorption response showed 5