Báo cáo hóa học: "Research Article Spectrum Sharing in an ISM Band: Outage Performance of a Hybrid DS/FH Spread Spectrum System with Beamforming" docx
Bạn đang xem bản rút gọn của tài liệu. Xem và tải ngay bản đầy đủ của tài liệu tại đây (1.66 MB, 11 trang )
Hindawi Publishing Corporation
EURASIP Journal on Advances in Signal Processing
Volume 2009, Article ID 834527, 11 pages
doi:10.1155/2009/834527
Research Article
Spectrum Sharing in an ISM Band: Outage Performance of
a Hybrid DS/FH Spread Spectrum System with Beamforming
Hanyu Li, Mubashir Syed, Yu-Dong Yao, and Theodoros Kamakaris
Wireless Information Systems Engineering Laboratory (WISELAB), Department of Electrical & Computer Engineering,
Stevens Institute of Technology, Hoboken, NJ 07030, USA
Correspondence should be addressed to Yu-Dong Yao,
Received 15 February 2009; Revised 19 May 2009; Accepted 16 September 2009
Recommended by R. Chandramouli
This paper investigates spectrum sharing issues in the unlicensed industrial, scientific, and medical (ISM) bands. It presents a
radio frequency measurement setup and measurement results in 2.4 GHz. It then develops an analytical model to characterize the
coexistence interference in the ISM bands, based on radio frequency measurement results in the 2.4 GHz. Outage performance
using the interference model is examined for a hybrid direct-sequence frequency-hopping spread spectrum system. The utilization
of beamforming techniques in the system is also investigated, and a simplified beamforming model is proposed to analyze the
system performance using beamforming. Numerical results show that beamforming significantly improves the system outage
performance. The work presented in this paper provides a quantitative evaluation of signal outages in a spectrum sharing
environment. It can be used as a tool in the development process for future dynamic spectrum access models as well as engineering
designs for applications in unlicensed bands.
Copyright © 2009 Hanyu Li et al. This is an open access article distributed under the Creative Commons Attribution License,
which permits unrestricted use, distribution, and reproduction in any medium, provided the original work is properly cited.
1. Introduction
Radio frequency (RF) has become one of the most precious
resources with the booming usage of wireless applications in
the recent years. Licensing radio frequencies for commercial
use has long been the mechanism adopted by regulatory
bodies for managing the RF spectrum. An exclusive license
was granted to protect the licensee’s service from interfer-
ence, but it also excluded shared use even when the licensee
is absent. Part of the reason for this approach was the
original technological limitations. Although technology has
evolved over time and overcome most of these limitations,
regulatory spectrum management methodology has not
been changed. On the other hand, the industrial, scientific,
and medical (ISM) radio bands, originally allocated for
noncommercial uses, were later modified to allow for more
services [1], prompting an influx of wireless communication
applications. Those applications, including wireless local
area networks (WLANs) and Bluetooth, take advantage of
these bands for license-free operation. This can be seen as an
indication of the role that unlicensed bands are set to play in
the evolution of wireless communications towards spectrum
sharing or dynamic spectrum access.
Efficient coexistence technology is essential for successful
operation of systems in the unlicensed band since there
is no protection from interference caused by coexisting
systems. This requires a multifaceted approach to system
design which includes spectrum occupancy measurements,
modeling of coexistence interference, performance evalua-
tion, and development of optimum waveforms. A number
of studies of spectrum occupancy measurements in the
ISM band have been reported in [2–5]. At Stevens Institute
of Technology, an investigative study is being carried out
for distributed spectrum occupancy measurements in the
2.4 GHz ISM band [6]. Based on measurement data in typical
environments (indoor, outdoor, etc.), an analytical model
of the coexistence interference was investigated in [7]. The
model illustrates a simple approach to interference modeling
due to uncoordinated sources/technologies, which share a
common band of frequencies.
Beamforming, a multiple antenna technique, has
received great attention in wireless communications recently
2 EURASIP Journal on Advances in Signal Processing
Receiver specifications
Frequency range
- 2025 MHz–2500MHz
Bandwidth
-40MHz
Front end
-Sensitivity:
−115 dBm
- Dynamic range: 60 dB
Data acquisition
-
≤ 2.5 s contiguous data
-20Mbpstransfer
COM-3001
2.4 GHz
receiver
COM-8002
high-speed
data
acquisition
COM-5001
network
interface
Baseband
10 bit complex
samples
40 M samples/s
I
Q
Antenna
PC
TCP-IP/LAN
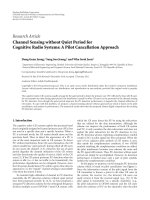
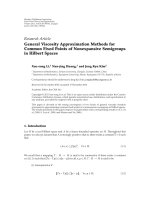
Figure 1: Measurement setup.
as it provides solutions to problems such as increasing
interference, limited bandwidth, and limited transmission
range [8]. In an interference rich scenario such as ISM
band, beamforming is expected to play an important role.
Beamforming uses arrays of antennas to control the RF
radiation pattern. When receiving a signal, beamforming
can increase the gain in the direction of desired signal
and decrease the gains in the directions of interferences.
When transmitting a signal, beamforming can increase the
gain in the direction of the signal. A preliminary study of
a single hybrid direct-sequence and frequency-hopping
(DS/FH) signal operating in an ISM band was presented
in [7], in which beamforming was not considered. This
paper investigates a multiple user DS/FH system using
beamforming.
The rest of the paper is structured as follows. In the
next section, we first present an RF measurement setup
and measurement results in the 2.4 GHz ISM band. We
then discuss the 2.4 GHz ISM band occupancy scenarios
and describe our approach to characterize interference for
a typical application environment. The signal model that
is considered for the analysis in this paper is explained
in the subsequent section. Section 4 presents mathematical
derivations of expressions for outage probabilities. Error
performance analysis is discussed in Section 5.Numerical
results are presented in Section 6. Finally, the conclusions are
drawn in Section 7.
2. Interference Measurement and Modeling
2.1. Measurement Setup. In order to develop a system
capable of distributed spectrum measurements, 10–20 inex-
pensive, portable, off-the-shelf, lightweight and Ethernet
interfaced measurement devices are used. ComBlocks [9]
are small commercial off-the-shelf modules which are pre-
programmed with essential communication processing func-
tions, including modulation, demodulation, error correction
encoding and decoding, digital to analog/RF, RF/analog to
digital, formatting, data storage, and baseband interface.
With two or more ComBlock modules interfaced with each
other, we build the whole data measurement system based on
our requirements.
Figure 1 illustrates a ComBlock receiver assembly for the
2.4 GHz ISM band with 40 MHz bandwidth. The baseband
signal is digitized and sent to a data acquisition server
over LAN. The ComBlock assemblies are fully controlled
over LAN by our MATLAB-based application that coordi-
nates data acquisition from multiple distributed ComBlock
assemblies and allows flexible signal processing. Using this
configuration we can capture up to 2.5 seconds of continuous
signal, or smaller segments for spectral analysis with a
capture to processing ratio of 1%. The RF front end has a
frequency range from 2025 MHz to 2500 MHz, sensitivity of
−115 dBm, and a dynamic range of 60 dB.
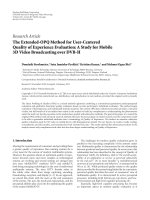
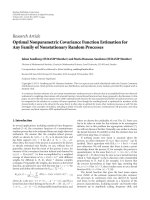
2.2. Measurement Results and Modeling. Using the RF setup
(Figure 1), we obtained measurement results and show
in Figure 2 some sample data (spectrogram at microsec-
ond/10 KHz resolution) observed in the 2.4 GHz ISM band
that highlight spectrum occupancy by typical devices. From
the temporal and spectral emission characteristics, various
applications have been identified, including Bluetooth, IEEE
802.11b WLAN, and microwave oven emissions. Additional
tone and narrowband emissions have also been observed.
In view of the variations in bandwidth occupancy
patterns of coexisting wireless devices and several other
factors (such as proximity constraints and application
environment), design considerations for effective introduc-
tion of additional signal transmissions in the ISM band
necessitate that a threefold approach is employed. The first
requirement is to minimize the interference to coexisting
services. The second is to quantify the interference from
coexisting users. Finally, building on the above two efforts,
effective waveforms that are robust to interference need
to be developed. Towards this end, we attempt to profile
EURASIP Journal on Advances in Signal Processing 3
−110
−100
−90
−80
−70
−60
We lc h p e ri od o gr a m
(dBm)
45
40
35
30
25
20
Time (ms)
2445 2455 2465 2475 2485
Frequency (MHz)
2445 2455 2465 2475 2485
Frequency (MHz)
1msslices
processed to
generate
averaged
periodogram
with max hold
for the entire
capture period
shown below
(a)
−110
−100
−90
−80
−70
−60
We lc h p e ri od o gr a m
(dBm)
45
40
35
30
25
20
15
10
5
0
Time (ms)
2410 2430 2450 2470
Frequency (MHz)
2410 2430 2450 2470
Frequency (MHz)
Microwave
emissions
Bluetooth
packet
(b)
−110
−100
−90
−80
−70
−60
We lc h p e ri od o gr a m
(dBm)
45
40
35
30
25
20
15
10
5
0
Time (ms)
2410 2430 2450 2470
Frequency (MHz)
2410 2430 2450 2470
Frequency (MHz)
802.11b ch9
802.11b ch11
Channel 13
2475 MHz
(c)
Figure 2: ISM band spectral emission measurement. (a) observations of Bluetooth packet; (b) observations of Bluetooth packets and
microwave oven emissions; (c) observation of IEEE 802.11b packets.
the observed emissions in terms of various representative
interference types.
The spectral, spatial, and temporal characterizations of
interferences are summarized in Ta ble 1. It is noted that the
profiling presented here is derived from the measurements
conducted in a specific office environment with the usual set
of devices currently typical in the 2.4 GHz ISM band. The
significance of this interference modeling approach is that
it showcases a simple and sufficiently accurate methodology
for profiling emissions in an unlicensed band that can be
used for different interference scenarios. Assume that the
bandwidth of the signal of interest is B and the entire
ISM band can be divided into N frequency slots, each
with bandwidth B. Transmissions from devices operating
in ISM band can cover the entire signal bandwidth or a
part of it. As listed in the table, the observed emissions
are categorized into three broad interference types based on
their transmission bandwidth—barrage, partial-band, and
tone. Barrage type interferers are those whose transmission
bandwidth covers the entire signal bandwidth B. Partial-
band interference is a generic grouping of interference
sources that occupy part of the desired signal bandwidth B.
Devices transmitting single frequency impulses are grouped
under the tone interference type. To capture the effect of
spatial characteristics of the different interference sources,
emissions are also parameterized in terms of their received
power levels as Y
i,j
, where the first subscript corresponds
to the interference type (i.e., i
∈{1, 2, 3} denoting barrage
interference, partial-band interference, and tone interference
resp.) and the second subscript, j,denotesaspecificsource
of the given interference type. Emissions from different
sources also have different temporal characteristics such as
periodicity and duty cycle. Similar to power level, the duty
cycle of each source is parameterized as ρ
i,j
.
3. Signal and Beamforming Models
In order to introduce new signals in coexistence environ-
ment, an appropriate waveform has to be adopted. FH
and DS have been widely used in ISM band. For example,
BluetoothusesFH[10] and Wi-Fi employs DS [11]. A
hybrid DS/FH system has been implemented in [12]and
analyzed in terms of spectral efficiency in [13]. Hybrid spread
spectrum (SS), where a direct-sequence modulated signal is
frequency hopped, is an attractive choice. DS/FH waveform
has been used in fixed spectrum systems but it has great
potential in dynamic spectrum access methodology since
its inherent ability to dynamically change signal frequency
and it can mitigate interference caused to others through
FH. Additional interference reduction is provided due to the
DS spreading gain. It is noted that in keeping with a more
generalized treatment of the approach presented in this paper
and for lucidity of presentation, specifics have been avoided.
For instance, explicit details of the signature sequence used
for spreading, the frequency hopping pattern and the signal
processing aspects of multipath fading have been ignored.
Just enough detail is furnished so as to account for the
concerned phenomena for our purposes.
3.1. Signal and Channel Model. For the analysis presented
here, a DS/FH system with multiple users is considered and
all the other transmitting sources occupying the frequency
band are taken to be interferers. A binary phase shift keying
(BPSK) modulation and asynchronous DS/FH system are
considered. Let us denote the BPSK modulated DS/FH signal
of user i as s
i
(t), and is given by
s
i
(
t
)
=
2X
i
c
i
(
t
)
b
i
(
t
)
cos
2π
f
c
+ f
i
(
t
)
t + θ
i
+ φ
i
(
t
)
,
(1)
4 EURASIP Journal on Advances in Signal Processing
Table 1: 2.4 GHz ISM band interference characteristics based on measurements.
Emissions Interference type Power level Duty cycle Periodicity Bandwidth
802.11b packets Barrage Y
1,j
ρ
1,j
No B
Microwave oven Barrage Y
1,j
ρ
1,j
Ye s B
Bluetooth packets Partial-band Y
2,j
ρ
2,j
No ≈ B
Others Tone Y
3,j
ρ
3,j
Ye s B
where f
c
is the carrier frequency, X
i
is the power of the
transmitted signal, and θ
i
is the phase introduced by the
BPSK modulator. The signal is frequency-hopped according
to f
i
(t)andφ
i
(t) is the phase waveform introduced by
the frequency hopper. The data signal, b
i
(t), (which is a
differentially encoded version of the information signal) is a
sequence of rectangular pulses with amplitude equal to either
+1 or
−1 and its duration is T.Thecodewaveformc
i
(t)isa
periodic sequence of positive and negative rectangular pulses
of unit amplitude and duration T
c
. The processing gain (PG)
of the system is defined as G
DS
= T/T
c
.
We consider that the propagation channel for the desired
signal is characterized by fading channel with impulse
response h
i
(t). In a multipath environment, the impulse
response h
i
(t)canbewrittenas
h
i
(
t
)
=
L−1
l=0
β
i,l
e
jϕ
i,l
δ
t − τ
i,l
,(2)
where L is the number resolvable paths, β
i,l
is the amplitude,
ϕ
i,l
is the phase shift, and τ
i,l
is the delay. Assuming each
path is following a Rayleigh fading, its power, γ
i,l
, is following
exponential distribution
f
γ
i,l
γ
i,l
=
1
Ω
i,l
exp
−
γ
i,l
Ω
i,l
, γ
i,l
≥ 0, (3)
where Ω
i,l
= E[β
2
i,l
] is the average channel power. For
fare comparison, the total power of multipath channel is
normalized to one
L−1
l=0
Ω
i,l
= 1.
(4)
For the wireless mobile channel, it has been found that the
multipath intensity profile (MIP) usually follows the negative
exponential relationship [14]
Ω
i,l
= Ω
i,0
e
−lδ
, l = 0, 1, , L − 1
. (5)
The decay factor δ reflects the decay rate of the average path
strength as a function of the path delay. Thus, the signal at
the input of the receiver is given by
r
(
t
)
=
K
i=1
s
i
(
t
)
⊗ h
i
(
t
)
+ y
(
t
)
+ n
(
t
)
=
K
i=1
L
−1
l=0
β
i,l
e
jψ
i,l
s
i
t − τ
i,l
+ y
(
t
)
+ n
(
t
)
,
(6)
where
⊗ denotes the convolution operation, y(t)denotes
the total interference, K is the number of users, and n(t)is
the additive white Gaussian noise (AWGN) with two-sided
spectrum density N
0
/2. The receiver is assumed capable of
acquiring the frequency-hopping pattern, signature sequence
and time synchronization of the user. The output of the
frequency dehopper in the receiver enters the despreader and
then the BPSK demodulator.
3.2. Introduction of Simplified and Accurate Beamforming
Model. Beamforming, a multiple antenna technique, is able
to increase the gain in the direction of desired signal
and decrease the gain in the direction of interference.
A beamforming combining network connects an array of
low gain antenna elements and could generate an antenna
pattern [15]
G
ψ,θ
=
sin
0.5Mπ
sin θ − sin ψ
M sin
0.5π
sin θ − sin ψ
2
,
(7)
where M is the number of antenna elements, θ is an arrival
angle of incident waves, and ψ is a scan angle. The beam
could be steered to a desired direction by varying ψ.The
complexity considering the exact beam pattern can be high,
especially for performance evaluation under beamforming
impairments such as DOA estimation errors, due to multiple
integrals. A simple Bernoulli model is introduced in [16]
in which a signal is considered to be within a mainlobe
(G
= 1) or out of the mainlobe (G = 0) and the half-
power beamwidth is defined as the beamwidth. This model
is easy to use, but it neglects the impact of sidelobes and the
effect of any specific beam patterns. Reference [17]providesa
beamforming model with a triangular pattern to characterize
the mainlobe of a beam. In [18], a beamforming model
having a flat mainlobe and a flat sidelobe is developed.
The width of the mainlobe and the height of the sidelobe
are calculated based on the first moment and the second
moment of the real beam pattern. This model considers
the impact of real beam pattern and it is proven to be
accurate [19], but it is cumbersome to use if there are
multiple types of interference since the derivation has to
consider all the cases when a specific interferer is in the
mainlobe or sidelobe. In this paper, we introduce a simple,
yet accurate beamforming model and then use it to evaluate
the performance of a Hybrid DS/FH spread spectrum system
with beamforming. While evaluating the interference, there
EURASIP Journal on Advances in Signal Processing 5
0
30
60
90
120
150
180
210
240
270
300
330
0.2
0.4
0.6
0.8
1
M
= 2
M
= 3
(a)
0
30
60
90
120
150
180
210
240
270
300
330
0.2
0.4
0.6
0.8
1
Jin model M
= 2
New simplified model M
= 2
Jin model M
= 3
New simplified model M
= 3
(b)
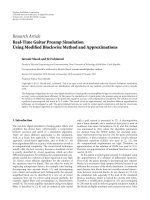
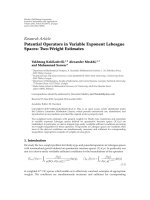
Figure 3: A simplified model for beamforming with arrival angle θ = 30
◦
. (a) Signal model, (b) interference model.
is only one parameter, α
BF
, associated with the simplified
model (Figure 3(b)). The parameter
α
BF
= E
G
ψ,θ
=
2π
0
sin
0.5Mπ
sin θ − sin ψ
M sin
0.5π
sin θ − sin ψ
2
p
ψ
ψ
p
θ
(
θ
)
dψdθ
(8)
is the antenna gain averaged with respect to random vari-
ables, ψ and θ, in the region from 0 to 2π. While evaluating
the signal, it uses the real beam pattern (Figure 3(a)). In
Figure 3, the model proposed in [18] is also plotted for
comparison. It is noted that the simplified model differs
with Jin’s model in [18] on evaluating interference. Using
the new simplified model to evaluate the performance of a
wireless system with beamforming is simple. Just reduce all
the interference power by α
BF
and all the existing results are
still valid. For example, the outage probability of a wireless
system in Rayleigh fading environment with K interferers can
be written as
P
out
= 1 −
1
(
1+
(
α
BF
/SIR
))
K
. (9)
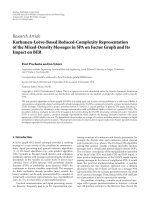
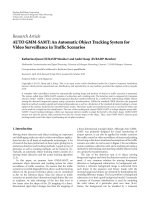
3.3. Accuracy of Simplified Model. We use (9) (an expression
derived based on the simplified beamforming model) and
results in [19] to calculate outage probabilities of wireless
systems with beamforming. The numerical results are shown
in Figure 4. It can be seen that the evaluation results using the
simplified model match those using the actual beam pattern
very well. For comparison, the Jin’s model in [18] is also
10
−6
10
−5
10
−4
10
−3
10
−2
10
−1
10
0
Outage probability
0 5 10 15 20 25 30 35 40 45 50
SIR
Outage probability of beamforming with 4 antenna elements
Actual 3 users
Jin model 3 users
New simplified 3 users
Actual 2 users
Jin model 2 users
New simplified 2 users
Actual 1 user
Jin model 1 user
New simplified 1 user
Figure 4: Accuracy of the new simplified beamforming model
compared with Jin’s model and exact result. The number of antenna
elements M
= 4.
plotted. The accuracy of the simplified beamforming model
can be concluded that the model becomes more accurate at
higher SIR and the outage probability error introduced by
the simplified beamforming model is inversely proportional
to the square of average SIR.
6 EURASIP Journal on Advances in Signal Processing
4. Derivation of Outage Probabilities
In wireless communications, adequate signal-to- interference
-plus-noise ratio (SINR) is essential for successful communi-
cations [20, 21]. Therefore, the outage probability, defined as
the probability of not being able to achieve a SINR sufficient
to give satisfactory reception, is an important measure in the
evaluation of performance of wireless systems. Mathemati-
cally the outage probability P
out
is given by
P
out
=
R
0
p
γ
γ
dγ = Pr
x
y + n
<R
(10)
in which γ is the instantaneous SINR, p
γ
(γ) is the probability
density function (pdf) of γ,andR is a required threshold.
The variable γ is a function of x, y and n,withx denoting
the desired signal power, y denoting the total interference
power and n denoting the noise power. For the derivations
presented here, the interferers (if any) include multiple user
interference and signals of the above discussed three types
(namely, barrage, partial-band or tone interferers). Without
loss of generality, we can investigate the outage probability
of the first user. In this section, we only consider the spectral
and spatial characterization of the system and assume all the
users and interferences are present in the band where the first
user is active. The temporal characterization of the system
and interferences is investigated in the next section.
The received signals on each antenna elements are
combined by beamforming network and feed into the
RAKE receiver. Assuming maximum ratio combining (MRC)
technique is used, and following [22], the signal used to
estimate the 0th symbol of the first user can be written as
U
=
L−1
n=0
S
n
+ I
mai,n
+ I
si,n
+ I
yi,n
+ I
ni,n
,
(11)
where S
n
is the signal, I
mai,n
is the multiple access interference
from coexisting users, I
si,n
is the self interference due to
multipath, I
yi,n
is the jamming interference, and I
ni,n
is the
noise
S
n
=
P
2
d
1
0
T
G
θ
1,n
, θ
1,n
β
2
1,n
,
I
mai,n
=
P
2
K
k=2
L
−1
l=0
β
1,n
β
k,l
G
θ
1,n
, θ
k,l
×
d
k
−1
RW
k1
τ
k
n,l
+ d
k
0
RW
k1
τ
k
n,l
cos
ϕ
k
n,l
,
I
si,n
=
P
2
L−1
l=0, l
/
= n
β
1,n
β
1,l
G
θ
1,n
, θ
1,l
×
d
1
−1
RW
11
τ
1
n,l
+ d
1
0
RW
11
τ
1
n,l
cos
ϕ
1
n,l
,
I
yi,n
=
T+nT
c
nT
c
y
(
t
)
G
θ
1,n
, θ
y
β
1,n
c
1
(
t
)
cos
ϕ
1,n
dt,
I
ni,n
=
T+nT
c
nT
c
n
(
t
)
β
1,n
c
1
(
t
)
cos
ϕ
1,n
dt,
(12)
where d
1
0
is the information bit of the first user, d
1
−1
is its
preceding bit, τ
k
n,l
= τ
k,l
−τ
1,n
, ϕ
k
n,l
= ϕ
k,l
−ϕ
1,n
, θ
i,j
is the DOA
of the path j of the user i, RW and
RW are partial correlation
function between spreading codes, where they are defined as
[22]
RW
k1
(
τ
)
=
τ
0
c
k
(
t
− τ
)
c
1
(
t
)
dt,
RW
k1
(
τ
)
=
T
τ
c
k
(
t
− τ
)
c
1
(
t
)
dt.
(13)
Performance of CDMA system has been analyzed using Stan-
dard Gaussian approximation (SGA), improved Gaussian
approximation (IGA), and simplified IGA (SIGA) to model
the interference statistics [23]. In this paper, we follow the
analysis in [22] and use SGA to approximate the interference.
The variance of the nth RAKE finger due to multiple access
interference is give by
σ
2
mai,n
=
E
b
T
6G
DS
β
2
n
K
k=2
L
−1
l=0
Ω
k
l
G
θ
1,n
, θ
k,l
. (14)
The variance of self interference is approximated by
σ
2
si,n
≈
E
b
T
4G
DS
β
2
n
L
−1
l=2,l
/
= n
Ω
1
l
G
θ
1,n
, θ
1,l
(15)
The variance of AWGN is
σ
2
ni,n
=
TN
0
4
β
2
n
.
(16)
The impact of jamming interference is analyzed for different
types of interferers.
4.1. Barrage Interference. Barrage interferers transmit ban-
dlimited signals at high power and the performance of a
spread spectrum signal is the same in the scenario of either
AWGN or barrage interferers [24]. If there are J
1
barrage
interferers present, and for the jth interferer, denoting its
average power as Y
1,j
, its direction of arrival angle is θ
1,j
,and
its bandwidth is B
1,j
, the variance of barrage interference is
given by
σ
2
J
1
,n
=
J
1
i=1
TY
1,i
4G
DS
B
1,i
β
2
n
G
θ
1,n
, θ
1,i
. (17)
4.2. Partial-Band Interference. Partial-band interferers
occupy part of the hoped bandwidth. A partial-band
interferer to a DS/FH signal is the same as a partial-band
jammer to a spread spectrum signal. The received power
EURASIP Journal on Advances in Signal Processing 7
of the jth partial-band interferer, with transmit power y
2,j
,
after despreading is given by [24]
y
2,j
= y
2,j
×
1
B
2,j
B
2,j
−B
2,j
sin
2
Δ f
j
− f
2/B
(Δ f
j
− f )2/B
2
df
. (18)
In the above equation B
2,j
is the bandwidth of the j-
th partial-band interferer, and Δ f
j
is the frequency offset
between the jth interferer and the user. Assuming that there
are J
2
partial-band interferers, each with the average transmit
power of the jth interferer denoted as Y
2,j
, we obtain the
variance of partial-band interference
σ
2
J
2
,n
=
J
2
i=1
TY
2,i
α
2,j
4G
DS
B
β
2
n
G
θ
1,n
, θ
2,i
, (19)
in which α
2,j
is a coefficient and it can be numerically
calculated as
α
2,j
=
1
B
2,j
B
2,j
−B
2,j
sin
2
Δ f
j
− f
2/B
(Δ f
j
− f )2/B
2
df
. (20)
4.3. Tone Interference. The received power of a single tone
interferer, with transmit power y
3,j
, after despreading is
found to be [24]
y
3,j
= y
3,j
×
sin
2
ΔW
j
/2B
2
ΔW
j
/2B
2
×
⎛
⎝
1+
cos
2Δφ
j
+G
DS
ΔW
j
/B
sin
G
DS
ΔW
j
/B
G
DS
sin
ΔW
j
/B
⎞
⎠
,
(21)
in which ΔW
j
and Δφ
j
are the frequency and phase offset
between the jth interferer and the signal. Assuming that
there are J
3
tone interferers and the average transmit power
of interferer j is denoted as Y
3,j
, the variance of tone
interference is
σ
2
J
3
,n
=
J
3
i=1
TY
3,i
α
3,j
4G
DS
B
β
2
n
G
θ
1,n
, θ
2,i
,
(22)
in which α
3,j
is a coefficient and
α
3,j
=
sin
2
ΔW
j
/2B
2
ΔW
j
/2B
2
×
⎛
⎝
1+
cos
2Δφ
j
+G
DS
ΔW
j
/B
sin
G
DS
ΔW
j
/B
G
DS
sin
ΔW
j
/B
⎞
⎠
.
(23)
4.4. Different Interference Types. Assuming that there are J
1
barrage interferers (each with average transmit power Y
1,j
),
J
2
partial-band interferers (each with average transmit power
Y
2,j
), and J
3
tone interferers (each with average transmit
power Y
3,j
) at the same time, the variance of the total
interference is
σ
2
T
=
L−1
n=0
σ
2
mai,n
+ σ
2
si,n
+ σ
2
ni,n
+
3
i=1
σ
2
J
i
,n
. (24)
The desired signal is
U
S
=±
E
b
T
2
L−1
n=0
β
2
n
G
θ
1,n
, θ
1,n
. (25)
The SINR after maximum ratio combining is
γ
=
U
2
S
2σ
2
T
= σ
0
L
−1
n=0
β
2
n
,
(26)
where
σ
0
=
⎡
⎣
2
K
k=2
L−1
l=0
Ω
k
l
G
θ
1,n
, θ
k,l
3G
DS
+
L−1
l
=1
Ω
l
1
G
θ
1,n
, θ
1,l
G
DS
+
n
0
E
b
+
3
i=1
J
i
j=1
TY
i,j
α
i,j
4G
DS
B
β
2
n
G(θ
1,n
, θ
i,j
)
⎤
⎦
−1
.
(27)
Applying the simplified beamforming model and replace the
beamforming pattern by α
BF
, we can simplify the σ
0
to
σ
0
(
K, J
1
, J
2
, J
3
)
=
⎡
⎣
2
(
K − 1
)
α
BF
3G
DS
+
(
1
− Ω
0
)
α
BF
G
DS
+
1
Γ
N
+
3
i=1
J
i
j=1
α
i,j
α
BF
G
DS
Γ
i,j
⎤
⎦
−1
,
(28)
in which Γ
i,j
= X
0
/Y
i,j
is average SIR corresponding to
interferer j of the ith type. α
i,j
is its coefficient; α
1,j
= B/B
1,j
,
α
2,j
and α
3,j
can be found by (20)and(23). If the power of
multiple paths is equally distributed, for example, δ
= 0, the
outage probability can be derived as
P
out
(
K, J
1
, J
2
, J
3
)
= 1 −
Γ
(
L, R/
(
σ
0
(
K, J
1
, J
2
, J
3
)
Ω
1
))
Γ
(
L
)
.
(29)
If the power of multiple paths is mutually different, for
example, δ>0, the outage probability can be given as
P
out
(
K, J
1
, J
2
, J
3
)
=
⎡
⎣
L−1
i=0
1
σ
0
(
K, J
1
, J
2
, J
3
)
Ω
i
⎤
⎦
×
L−1
j=0
e
−R/σ
0
(K,J
1
,J
2
,J
3
)Ω
j
L−1
k
=0,k
/
= j
1/
(
σ
0
(
K, J
1
, J
2
, J
3
)
Ω
k
)
−1/
σ
0
(
K, J
1
, J
2
, J
3
)
Ω
j
.
(30)
8 EURASIP Journal on Advances in Signal Processing
5. Error Performance
5.1. Average Outage Probability. The outage probability of a
DS/FH system is analyzed in the previous section without
considering the temporal characterization of interferers and
signals. The temporal characterization of an interferer can
be represented by its duty cycle which is the proportion of
time during which the interferer is operated. Considering
that the duty cycle of an interferer is ρ
i,j
, the probability that
the interferer is present in a certain channel (slot) is ρ
i,j
/N,
in which N is the total number of available channels. Let the
total number of interferers of the three interference types be
denoted as J
1
, J
2
,andJ
3
,respectively.IfK users are randomly
hopping among the N channels and all the users have the
same power and all the interferers of a given type have the
same transmitting power, duty cycle, and coefficients, the
outage probability of the first user is obtained as
P
out
=
J
1
j
1
=0
J
2
j
2
=0
J
3
j
3
=0
K
−1
k=0
P
out
k +1,j
1
, j
2
, j
3
p
k
3
i=1
p
j
i
, (31)
where
p
k
=
⎛
⎝
K
−1
k
⎞
⎠
1
N
k
1 −
1
N
(K−1−k)
,
p
j
i
=
⎛
⎝
J
i
J
i
⎞
⎠
ρ
i
N
j
i
1 −
ρ
i
N
(J
i
− j
i
)
,
(32)
where P
out
(k, j
1
, j
2
, j
3
)canbe(29)or(30) depending the
value of decay factor δ.
5.2. Packet Error Probability. Reed-Solomon (RS) code is an
effective FEC coding scheme used in packet transmissions.
If the code length is L
RS
and its symbol error correction
capability is R
C
, the packet error probability is
P
e
= 1 −
R
C
i=0
⎛
⎝
L
RS
i
⎞
⎠
P
i
out
(
1
− P
out
)
L
RS
−i
, (33)
in which the outage probability P
out
can be calculated using
the results in (31). The above equation is derived under the
assumption that the outage probability of each symbol is
independent from each other. This can be accomplished by
using an interleaved RS code [25]. Such an assumption is
used in this paper to focus the impact of beamforming rather
than the wireless channel time coherence on the hybrid
DS/FH system.
6. Numerical Analysis
This section presents numerical results based on the deriva-
tions in Sections 4 and 5. For the performance evaluation
presented here, each user in the DS/FH spread spectrum
system is considered to have a DS spreading gain G
DS
=
50 and occupy a 1 MHz bandwidth (i.e., B = 1 MHz) in
each frequency slot, which is reflective of a transmission
bandwidth of a frequency hopping signal. The propagation
10
−4
10
−3
10
−2
10
−1
10
0
Outage probability
−40 −30 −20 −10 0 10 20
SIR (dB)
M
= 1
M
= 2
M
= 4
M
= 8
Figure 5: Outage probability of a DS/FH system, impact of
beamforming, processing gain G
DS
= 50, the number of users
K
= 40, the number of interferers is J
1
= 1,J
2
= 2,J
3
= 3, duty
cycles of interferes are ρ
1
= ρ
2
= ρ
3
= 0.2, SNR Γ
N
= 100 dB, the
number of hopping channels N
= 10, the number of multiple path
L
= 3, decay factor δ = 0, and protection ratio r
th
= 3dB.
of signals from the desired transmitter as well as interfering
sources to the receiver in a typical environment where
such devices as those that operate in the ISM band used
is well modelled through Rayleigh fading. It is reasonable
to assume that the transmissions from the various sources
are independent of each other. Therefore, all the signals
at the receiver are considered to have undergone mutually
independent Rayleigh fading.
The performance of a DS/FH system using beamforming
with different number of antenna elements is plotted in
Figure 5. It is seen that beamforming significantly improves
the system performance under various SIR conditions.
Beamforming with antenna elements of 2, 4, and 8 are
compared with the case without beamforming (M
= 1).
For the three types of interferers, the duty cycle of each
is 0.2, and the numbers of interferers are 1, 2, and 3,
respectively. The SNR is assumed to be 100 dB and spreading
gain within each frequency slot is 50. The total number
of users is 40, protection threshold equals 3 dB, decay
factor δ is 0, and the number of frequency slots N is
40. The bandwidth of the barrage interferers is assumed
to be 10 MHz which is an approximate based on the
observation in Figure 2. It is noticed that about 3 dB gain
is achieved as the number of antenna elements doubles
when SIR is relatively low (SIR is around
−20 dB). When
multiuser interference dominates the system performance (at
high SIR), increasing the number of antenna elements also
reduces the outage probability significantly. This illustrates
that beamforming is an effective technique which reduces
interference due to either coexisting DS/FH signals or other
interferers.
EURASIP Journal on Advances in Signal Processing 9
10
−4
10
−3
10
−2
10
−1
10
0
Outage probability
−40 −30 −20 −10 0 10 20
SIR (dB)
K
= 80
K
= 40
K
= 20
K
= 10
Figure 6: Outage probability of a DS/FH system; Impact of the
number of users, the number of antenna elements M
= 2,
processing gain G
DS
= 50, the number of interferers is J
1
= 1, J
2
=
2, J
3
= 3, duty cycles of interferes are ρ
1
= ρ
2
= ρ
3
= 0.2, SNR
Γ
N
= 100 dB, the number of hopping channels N = 10, the number
of multiple path L
= 3, decay factor δ = 0, and protection ratio
r
th
= 3dB.
10
−4
10
−3
10
−2
10
−1
10
0
Outage probability
−40 −30 −20 −10 0 10 20
SIR (dB)
ρ
1
= ρ
2
= ρ
3
= 1
ρ
1
= ρ
2
= ρ
3
= 0.8
ρ
1
= ρ
2
= ρ
3
= 0.4
ρ
1
= ρ
2
= ρ
3
= 0.2
Figure 7: Outage probability of a DS/FH system, impact of the
duty cycle of interferers, the number of antenna elements M
= 2,
processing gain G
DS
= 50, the number of users K = 40, the number
of interferers is J
1
= 1, J
2
= 2, J
3
= 3, SNR Γ
N
= 100 dB, the number
of hopping channels N
= 10, the number of multiple path L = 3,
decay factor δ
= 0, and protection ratio r
th
= 3dB.
The impact of multiple users in the system is shown
in Figure 6. Outage probability results of a system with 10,
20, 40, and 80 users are compared. The number of antenna
elements is assumed to be 2 and other parameters are the
10
−4
10
−3
10
−2
10
−1
10
0
Outage probability
−40 −30 −20 −10 0 10 20
SIR (dB)
J
1
= 8, J
2
= 16, J
3
= 24
J
1
= 4, J
2
= 8, J
3
= 12
J
1
= 2, J
2
= 4, J
3
= 6
J
1
= 1, J
2
= 2, J
3
= 3
Figure 8: Outage probability of a DS/FH system; Impact of the
number of interferers, the number of antenna elements M
= 2,
processing gain G
DS
= 50, the number of users K = 40, duty cycles
of interferes are ρ
1
= ρ
2
= ρ
3
= 0.2, SNR Γ
N
= 100 dB, the number
of hopping channels N
= 10, the number of multiple path L = 3,
decay factor δ
= 0, and protection ratio r
th
= 3dB.
10
−4
10
−3
10
−2
10
−1
10
0
Outage probability
−40 −30 −20 −10 0 10 20
SIR (dB)
N
= 10
N
= 20
N
= 40
N
= 80
Figure 9: Outage probability of a DS/FH system, impact of the
number of hopping channels, the number of antenna elements
M
= 2, processing gain G
DS
= 50, the number of users K = 40,
the number of interferers is J
1
= 1, J
2
= 2, J
3
= 3, duty cycles of
interferes are ρ
1
= ρ
2
= ρ
3
= 0.2, SNR Γ
N
= 100 dB, the number
of multiple path L
= 3, decay factor δ = 0, and protection ratio
r
th
= 3dB.
same as those in Figure 5. It is seen that if multiple users
are present in the system, increasing SIR does not always
decrease the outage probability. This is due to the fact that
multiple user interference in the DS/FH system will dominate
the system performance as SIR increases.
10 EURASIP Journal on Advances in Signal Processing
10
−4
10
−3
10
−2
10
−1
10
0
Outage probability
−40 −30 −20 −10 0 10 20
SIR (dB)
G
DS
= 10
G
DS
= 20
G
DS
= 50
G
DS
= 100
Figure 10: Outage probability of a DS/FH system, impact of
processing gain, the number of antenna elements M
= 2, the
number of users K
= 40, the number interferers are J
1
= 1, J
2
=
2, J
3
= 3, duty cycles of interferes are ρ
1
= ρ
2
= ρ
3
= 0.2, SNR
Γ
N
= 100 dB, the number of hopping channels N = 10, the number
of multiple path L
= 3, decay factor δ = 0, and protection ratio
r
th
= 3dB.
10
−4
10
−3
10
−2
10
−1
10
0
Outage probability
−40 −30 −20 −10 0 10 20
SIR (dB)
δ
= 4
δ
= 2
δ
= 1
δ
= 0
Figure 11: Outage probability of a DS/FH system, impact of the
decay factor, the number of antenna elements M
= 2, processing
gain G
DS
= 50, the number of users K = 40, the number interferers
are J
1
= 1, J
2
= 2, J
3
= 3, duty cycles of interferes are ρ
1
= ρ
2
=
ρ
3
= 0.2, SNR Γ
N
= 100 dB, the number of hopping channels N =
10, the number of multiple path L = 3, and protection ratio r
th
=
3dB.
The impacts of ISM band interference duty cycles, the
number of interferers, and the number of frequency slots
are examined in Figures 7, 8,and9,respectively.Itisseen
10
−4
10
−3
10
−2
10
−1
10
0
Outage probability
−40 −30 −20 −10 0 10 20
SIR (dB)
L
= 1
L
= 2
L
= 4
L
= 8
Figure 12: Outage probability of a DS/FH system, impact of the
number of multipath, the number of antenna elements M
= 2,
processing gain G
DS
= 50, the number of users K = 40, the number
of interferers is J
1
= 1, J
2
= 2, J
3
= 3, duty cycles of interferes
are ρ
1
= ρ
2
= ρ
3
= 0.2, SNR Γ
N
= 100 dB, the number of
hopping channels N
= 10, decay factor δ = 0, and protection ratio
r
th
= 3dB.
that the duty cycles and the number of interferers have
greater impact on the outage probability at lower SIR, where
ISM band interference dominates the system as compared to
DS/FH multiple access interference. Those impacts diminish
at higher SIR when multiuser interference becomes the major
concern in the system. It is also seen that increasing the
number of frequency slots improves the system performance
regardless of the signal to interference ratio. This is due to the
increase of the processing gain of the DS/FH system.
The impact of spreading gain is shown in Figure 10.Itis
seen that increasing the spreading gain improves the outage
performance at all SIR ranges. This is due to the fact that
increasing the spreading gain can reduce multiple access
interference at lower SIR and decrease the self-interference
at higher SIR.
The impact of fading channel is shown in Figures 11
and 12.ItisseeninFigure 11 that the outage performance
becomes worse if the signal strength on multiple paths decays
fast. Figure 12 illustrates that the more equally distributed
paths are in the fading channel the better outage performance
the system has. Those performance improvements can be
explained by more effective diversity in the fading channel.
7. Conclusion
In this paper, we have investigated the issue of coexistence
interference in unlicensed bands. Motivation for the work
originates from the widespread use of the 2.4GHz ISM
band for varied services and the growing realization of
the inadequacy of the licensing methodology for spectrum
EURASIP Journal on Advances in Signal Processing 11
management that is currently in place. The paradigm
for operation in an unlicensed band is to minimize the
interference caused to other users in the band and to avoid
and suppress the interference from coexisting devices. Based
on our measurement studies in the 2.4 GHz ISM band, an
analytical interference model has been developed in this
paper. The modeling approach adopted involves profiling the
observed emissions under different interference types based
on their spectral characteristics. The model also considers
the temporal characterizations and power levels of all the
emissions. The effect of coexistence interference in the
2.4 GHz ISM band on the performance of a hybrid DS/FH
system using beamforming, in terms of outage probability
and packet error probability, has also been evaluated in
this paper. Results of numerical evaluation of the derived
performance measures have been presented. This study is
part of our ongoing effort to develop an analytical framework
for interference modeling and performance evaluation in
the unlicensed band, as it is seen as an invaluable tool for
dynamic spectrum access system designs.
Acknowledgments
The authors would like to acknowledge and thank Mr. Jason
Evans, Dr. Ufuk Tureli, Dr. Paul Kolodzy, and Dr. Joseph
Evans for their support and contributions.
References
[1] “Code of federal regulations (CFR) title 47:
telecommunication—part 15: radio frequency devices,” Octo-
ber 2004, />04/
47cfr15
04.html.
[2] P. B. Kenington and D. W. Bennett, “Field measurements
study into the potential effects of ISM emissions on cellular
radio equipment,” IEE Proceedings: Science, Measurement and
Technology, vol. 144, no. 3, pp. 134–140, 1997.
[3] C. C. Huang and R. Khayata, “Delay spreads and channel
dynamics measurements at ISM bands,” in Proceedings of IEEE
International Conference on Communications—Discovering a
New World of Communications (SUPERCOMM/ICC ’92), vol.
3, pp. 1222–1226, Chicago, Ill, USA, June 1992.
[4] K. Giannopoulou, A. Katsareli, D. Dres, D. Vouyioukas, and P.
Constantinou, “Measurements for 2.4 GHz spread spectrum
system in modern office buildings,” in Proceedings of the 10th
Mediterranean Electrotechnical Conference (MELECON ’00),
vol. 1, pp. 326–329, May 2000.
[5] M. Biggs, A. Henley, and T. Clarkson, “Occupancy analysis of
the 2.4 GHz ISM band,” IEE Proceedings: Communications, vol.
151, no. 5, pp. 481–488, 2004.
[6] T. Kamakaris and J. Evans, “Distributed spectrum measure-
ments,” in Proceedings of the 24th Annual Joint Conference of
the IEEE Computer and Communications Societies (INFOCOM
’05), March 2005.
[7] H. Li, M. Syed, and Y D. Yao, “Outage performance of
a hybrid DS/FH spread-spectrum signal in an ISM band,”
International Journal of Network Management,vol.16,no.2,
pp. 115–129, 2006.
[8] H.L.V.Trees,Optimum Array Processing, Part IV of Detection,
Estimation, and Modulation Theory, Wiley-Interscience, New
York, NY, USA, 2002.
[9] “MSS Comblock Modules,” .
[10] “The bluetooth special interest group,” May 2009,
.
[11] IEEE Standard 802.11b-1999 (Supplement to ANSI/IEEE Stan-
dard 802.11, 1999 Edition), 1999.
[12] A. Hoshikuki, M. Yamamoto, S. Ishii, R. Kohno, and H. Imai,
“Implementation of an industrial R/C system using a hybrid
DS/FH spread spectrum technique,” in Proceedings of the 2nd
IEEE International Symposium on Spread Spectrum Techniques
and Applications, pp. 179–182, November-December 1992.
[13] P. Varzakas and G. S. Tombras, “Spectral efficiency for a
hybrid DS/FH code-division multiple-access system in cellular
mobile radio,” IEEE Transactions on Vehicular Technology, vol.
50, no. 6, pp. 1321–1327, 2001.
[14] J. G. Proakis, Digital Communications, McGraw-Hill, New
York, NY, USA, 3rd edition, 1995.
[15] S. Haykin, Adaptive Filter Theory, Prentice-Hall, Upper Saddle
River, NJ, USA, 3rd edition, 1986.
[16] A. F. Naguib, A. Paulraj, and T. Kailath, “Capacity improve-
ment with base-station antenna arrays in cellular CDMA,”
IEEE Transactions on Vehicular Technology,vol.43,no.3,pp.
691–698, 1994.
[17] U. Spagnolini, “A simplified model for probability of error in
DS CDMA systems with adaptive antenna arrays,” in Proceed-
ings of IEEE International Conference on Communications (ICC
’01), vol. 7, pp. 2271–2275, June 2001.
[18] J. Yu and Y D. Yao, “Reverse link capacity of SIR-based power-
controlled CDMA systems with antenna arrays,” Wireless
Communications and Mobile Computing, vol. 3, no. 6, pp. 759–
772, 2003.
[19] H. Li, Y D. Yao, and J. Yu, “Outage probabilities of wireless
systems with imperfect beamforming,” IEEE Transactions on
Vehicular Technology, vol. 55, no. 5, pp. 1503–1515, 2006.
[20] Y D. Yao and A. U. H. Sheikh, “Investigations into cochannel
interference in microcellular mobile radio systems,” IEEE
Transactions on Vehicular Technology, vol. 41, no. 2, pp. 114–
123, 1992.
[21] Y D. Yao and A. U. H. Sheikh, “Outage probability analysis
for microcell mobile radio systems with cochannel interferers
n Rician/Rayleigh fading environment,” Electronics Letters, vol.
26, no. 13, pp. 864–866, 1990.
[22] G. P. Efthymoglou, T. Piboongungon, and V. A. Aalo, “Per-
formance of DS-CDMA receivers with MRC in nakagami-
m fading channels with arbitrary fading parameters,” IEEE
Transactions on Vehicular Technology, vol. 55, no. 1, pp. 104–
114, 2006.
[23] J. M. Holtzman, “A simple, accurate method to calculate
spread-spectrum multiple-access error probabilities,” IEEE
Transactions on Communications, vol. 40, no. 3, pp. 461–464,
1992.
[24]R.L.Peterson,R.E.Ziemer,andD.E.Borth,Introduction
to Spread Spectrum Communications, Prentice-Hall, Upper
Saddle River, NJ, USA, 1995.
[25] C. Yi and J. H. Lee, “Hybrid ARQ scheme using interleaved
reed-solomon codes in a power-controlled DS-CDMA cellular
system,” IEEE Transactions on Vehicular Technology, vol. 45, no.
4, pp. 683–687, 1996.