Multiprocessor Scheduling Part 15 ppt
Bạn đang xem bản rút gọn của tài liệu. Xem và tải ngay bản đầy đủ của tài liệu tại đây (485.8 KB, 27 trang )
Multiprocessor Scheduling: Theory and Applications 410
processing sequence is reversed, and the schedule time frame is reversed back to forward
time frame.
The backward scheduling considers inserted idle times between processing of orders.
Forward scheduling is a straightforward method that schedules jobs one by one from the
beginning time of the planning period. The main objective is to make sure that each job can
meet its due date. The forward scheduling methodology presented in the previous section
does not minimize AWT effectively. This is overcome by adopting a backward approach
that inserts idle times between order groups.
The last flight’s departure time determines the completion time for the last order to be
scheduled in the assembly in the planning period. To minimize order earliness before
transportation, the favorable completion time for each order is their corresponding flight
departure time. Hence, within each group, orders are scheduled one by one without
inserted idle time in backward direction from the order group’s due-date. Once the
completion time for the last order to be scheduled in each group is determined, the release
times for the preceding orders is calculated by subtracting its processing times from the
release time of the succeeding orders. Idle times are inserted only between order groups.
When the release time of the first order in the succeeding group is later than the current
order group’s due date, idle time is inserted between the two groups. Thus the last job of the
current order group is scheduled to complete at the corresponding flight departure time.
The pseudo code description of the backward scheduling logic is presented below:
If (job i is the last job in flight j) then
If (flight j is the last flight) then
Release time(job i, flight j) =Departure time(flight j) –
Processing time(job i, flight j)
Else
If (Release time (the first job, fight j+1) is earlier than
Departure time(flight j)) then
Release time (job i, flight j) =Release time (the first job,
flight j+1) – Processing time(job i, flight j)
Else
Release time (job i, flight j) =Departure time (flight j) –
Processing time (job i, flight j)
End if
End if
Else
Release time (job i, flight j) =Release time (job i+1, flight j) –
Processing time (job i, flight j)
End if
Computational results indicate that BSSH outperforms FSSH in terms of AWT. For detailed
results of the comparison, it can be referred to Li et al. (2005).
4. Single Machine Assembly Scheduling Problem with random delay
Today’s manufacturing environment is highly time varying, and most of the components in
the supply chain have stochastic nature of objectives and constraints due to environmental
uncertainties and executional uncertainties (Szelke & Markus, 1997). These uncertainties can
be triggered by machine breakdowns, shortage of materials, interruption of machine
Synchronized scheduling of manufacturing and 3PL transportation 411
operations when their performance violates quality control standards, etc. The occurrence of
interruptions and the time required for assembly to resume from the interruptions are often
highly stochastic in nature. These issues always lead to unexpected delays in assembly. The
deterministic schedule obtained prior to the start of assembly processing is affected and
becomes inappropriate. Thus, the deterministic schedule should be updated so as to
minimize the disturbances due to uncertainties. The scenario of assembly process delays
caused by the stochastic events is studied and a schedule repair heuristic is presented to
minimize the influence of stochastic events on deliveries.
There are two types of orders, viz., regular (non-delayed) orders and delayed orders.
Regular (non-delayed) orders are the orders that are released into the shop as per the
predetermined transportation allocation. Orders that have not been processed in assembly
because of unexpected uncertainties are referred as delayed orders. The decision consists of
the schedule of the delayed orders which have missed their earlier departure due-dates
along with non-delayed orders. A delay is characterized by a start time and duration. It may
result from machine breakdowns, shortage of materials, interruption of machine operations
when their performance violates quality control standards, etc. The jobs completed prior to
the delay are not taken into account. Hence, this section considers a situation of
rescheduling the delayed orders along with non-delayed orders with a possibility of
identifying a sequence in which non-delayed orders in the original schedule can reach their
destination on time. It is also to be stated again that if an order misses it scheduled
departure time it can only be shipped by a commercial fight at a higher cost. Basically, this
possibility is considered to avoid a situation of very high disruptions caused in relation to
the customer deliveries.
4.1 Problem formulation
The formulation presented in this section assumes that the new schedule obtained does not
include unexpected delays in the remaining time of the planning period. However, if delay
occurs at any future time point in the planning period, a new schedule is generated again
considering the remaining time horizon. Thus, the formulation considers a decision
situation of re-scheduling both delayed and non-delayed orders without considering
unexpected future delays. The input data consists of a set of orders to be processed, the
machine capacity, allocation of orders to flights, transportation cost by commercial flight,
and delivery earliness/tardiness cost per unit time for each order. The objective is to
minimize the total waiting cost between assembly and transportation, the total
transportation cost, total delivery earliness/tardiness costs, and the penalty costs of missed
allocations. The following notation is defined before presenting the Mixed Integer
Programming (MIP) model.
i the job/order index, i=1, 2, …, Nc, Nc is the total number of jobs considered at the
decision instant;
t the delay start time;
DU the delay duration;
R
i
the release time of job i;
P
i
the processing time of job i;
C
i
the assembly completion time of job i
ǃ
1i
per unit transportation cost of job i when transported by a commercial flight;
ǂ
1i
the per hour earliness penalty of job i for assembly and it is assumed that ǂ
1i
= Q
i
;
Multiprocessor Scheduling: Theory and Applications 412
PI
ij
1 if job i precedes job j immediately, 0 otherwise;
EF
if
1 if assembly completion time of job i is earlier than flight f’s departure time,
otherwise 0;
PA
if
the predetermined allocation, 1 if job i is predetermined to be allocated to flight f by
the ILP model, 0 otherwise;
TC
if
the transportation cost matrix which is determined by the ILP model.
The model is expressed as follows:
Min
'
1
11
'
11
1
1
( ( * *( * (0, ) * (0, ) * (0, ))))
((1 ( * ))
*( * ( *( * (0, ( )) * (0, ( ) )))))
NF
if if if i f i i i f i f i
if
NF
if if
jf
F
ii ifi i fif i fif i
f
PA EF TC Max D C Max d A Max A d
PA EF
QPA MaxdACD MaxACDd
DDE
ED E
¦¦
¦¦
¦
(11)
Subject to: C
i
=R
i
+P
i
, i=0,1,…, Nc,Nc+1 (12)
R
0
=t+DU (13)
'
1
1
N
N
i
i
R
P
t
¦
(14)
'1
1
1
N
ij
j
PI
¦
, ij, i=0,1,…,N
c
(15)
'
0
1
N
ji
j
PI
¦
, ij, i=1,…,N
c
, N
c
+1 (16)
'1
0
1
0
N
j
j
PI
¦
(17)
'
('1)
0
0
N
Nj
j
PI
¦
(18)
C
i
- C
j
– LN*PI
ji
>= P
i
-LN i, j=0, 1,…,N
c
, N
c
+1 (19)
1
if
EF , For i, f with C
i
<= D
f
(20)
0
if
EF , For i, f with C
i
>D
f
(21)
PI
ij
{0,1}, i, j=0, 1,…,N
c
, N
c
+1 (22)
Synchronized scheduling of manufacturing and 3PL transportation 413
The decision variables are R
i
, PI
ij
, EF
if
. The objective function includes the two early and two
late penalties for the orders. Early penalties are incurred when assembly of the order is
completed earlier than its transportation departure time. The late penalties are the special
flight transportation cost when orders miss their predetermined flight. Since the assembly
scheduling model considers synchronization with transportation, early and late penalty for
assembly together with final delivery early and late penalties are taken into account in this
model. The first term in the objective function is the cost of early penalties of the orders
when they can catch its pre-determined flight. The early penalties consist of earliness cost
before transportation, predetermined flight transportation cost, final delivery
earliness/tardiness costs. The second term in the objective function is the late penalties of
the orders when they miss their predetermined flights. The late penalties consist of the
commercial flight transportation cost, the final delivery earliness/tardiness costs.
Note that two dummy jobs are created in order to facilitate the representation of the
immediate precedence of the jobs. They are the first and the last job which has zero quantity.
Constraint (12) represents the relationship among the release time, completion time and
processing time of each order. Constraint (13) sets the release time of the first job, R
0
, to the
assembly resume time, which is the sum of delay start time t and the delay duration DU.
Constraint (14) sets the release time of the last job, R
N’+1
, larger or equal to the total
processing time of all the jobs. These two constraints denote that there might be inserted idle
time between the release times of each two adjacent jobs. Constraint (15) and (17) ensure
that all the jobs should have a precedence job except the first job. Constraint (16) and (18)
ensures that all the jobs should have a successive job except the last job. Constraint (19)
represents the completion time relationship between any two jobs. Constraint (20) and (21)
indicate that when a job’s completion time is earlier than a flight departure time, it can catch
the flight. Constraint (22) indicates that PI
ij
is 0-1 integer variable.
4.2 NP-completeness proof
To prove the assembly scheduling problem is NP-hard, it is reduced to a single machine
scheduling problem with distinct due windows and job dependent earliness/tardiness
penalty weights. The reduced problem is then proved to be NP-hard. Thus, the assembly
scheduling problem investigated in this chapter is also NP-hard. In the following, the
equivalence is established between the reduced problem and the problem studied by Wan &
Yen (2002), which is NP-hard.
The reduced problem: For the present discussion, the air transportation cost and time is
ignored, as well as the final delivery earliness penalties. This is equivalent to say that these
parameters take value zero. Therefore, the problem basically becomes a scheduling problem
with distinct due-windows and job dependent earliness/tardiness penalty weights for each
job. The due-window has a length equal to the difference between the final customer
delivery time and transportation departure time.
Distinct due-windows: There is waiting cost if an order completed earlier than its assembly
due date. As there is no earliness cost for final delivery, only tardiness cost is taken into
account if the order is delivered later than the final due-date. Also, it is assumed that the air
transportation cost and time are ignored. Therefore, the assembly of orders completed
between assembly due-date and final due-date lead to no penalty. It is obvious that the
number of flights corresponds to the number of due-dates for assembly. Thus, the assembly
Multiprocessor Scheduling: Theory and Applications 414
due-date is distinct. In addition, the final due-date of each order is distinct. Hence the
reduced problem is a distinct due windows scheduling problem.
Job dependent earliness penalty: If assembly of a job is completed earlier than its due date,
there is a waiting penalty, which depends on the product of the early time and the quantity
of the job.
Job dependent tardiness penalty: As assumed that if an order is delivered later than its
final due date, a late delivery penalty, which is the product of lateness time length and the
order quantity, is incurred.
Wan & Yen (2002) show that the single machine scheduling problem with distinct due
windows to minimize total weighted earliness and tardiness is NP-hard. As the reduced
assembly scheduling problem is equivalent to the problem studied by Wan & Yen (2002),
the prior problem is NP-hard. Therefore, the assembly scheduling problem studied in this
chapter is NP-hard.
4.3 Schedule Repair Heuristics
In many production situations, it is not desirable to reschedule all the non-delayed jobs
along with the delayed jobs. Instead, the required changes should be performed in such a
way that the entire system is affected as little as possible (Roslöf, et al. 2001). This process is
termed schedule repair in this chapter. To repair an unfinished schedule which has delayed
orders, its valid parts (or the remaining unaffected schedule) should be re-used as far as
possible, and only the parts touched by the disturbance are adjusted (Szelke & Markus
1997). At the beginning of assembly, the schedule obtained using BSSH is executed. Suppose
the delay is caused by machine breakdown starting from time t and the assembly resumes
after time length DU. Jobs that are to be released between t and t+DU in original schedule
are only influenced by the disturbance. In line with the concept of schedule repair, the
schedule after time t+DU is valid part and should be kept unchanged. The schedule of the
influenced jobs between time t and t+DU should be adjusted.
The schedule generated using BSSH methodology will have idle times between job groups,
during which the assembly does not work at its full capacity. The idle time can be utilized to
process the delayed jobs. Therefore, a heuristic to repair the disturbed schedule is proposed
is this section. The main motive is to insert the disturbed job into the idle time spans so that
the assembly utilization is improved at the advantage of minimizing the delay penalties for
the jobs. If still some jobs cannot be inserted into the idle time span, they are appended after
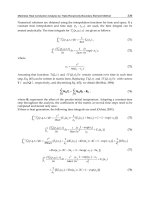
the last job of the final schedule. Figure 2 illustrates this idea in detail.
7L PHWW'8
Figure 2. Illustration of schedule repair heuristic
Synchronized scheduling of manufacturing and 3PL transportation 415
In Figure 2, the x axial denotes time. The blocks denote the scheduled jobs. During time t to
t+DU, the jobs predetermined to be processed are denoted using shaded blocks. The
delayed jobs are to be inserted into the idle times among the job groups in the BSSH
schedule as denoted by the arc in the figure using the following heuristic.
The schedule repair heuristic (SRH):
1. Sequence the jobs scheduled between t and t+DU by Longest-Processing Time (LPT)
first rule.
2. Insert disturbed jobs into the idle time spans between order groups. Suppose there are
N
d
disturbed jobs and are sequenced by LPT rule. Let the BSSH schedule has S idle
time spans from time t+DU till the end of the planning period. The detailed steps are:
2.1. i=1, j=1
2.2. If Length[span(i)]>ProcessingTime[job(j)], insert job j into span i.
Else, go to 2.5.
2.3. Length[span(i)]= Length[span(i)]- ProcessingTime[job(j)].
2.4. j=j+1. If j> N
d
, go to 2.7. Else, go to 2.2.
2.5. i=i+1. If
Lื
S, go to 2.2. Else, go to 2.6.
2.6. Append the remaining N
d
-j jobs after the last job of the BSSH schedule.
2.7. Stop.
By computational experiments, it is shown that SRH can achieve good results. For
detailed content, it can be referred to Li et al. (2006).
5. Conclusion and Further Research
In this chapter, the formulation of synchronized scheduling problem of production and
transportation is presented. The solution methodology is to decompose the overall problem
into two sub-problems, i.e., the transportation allocation problem and machine scheduling
problem. The 3PL transportation allocation problem is formulated using an integer
programming model. It is shown that the problem is solvable in polynomial time.
Furthermore, the formulations for single machine with and without random delay are
presented. The methods to solve these two problems are summarized. Further research can
address the assembly sub-problem with parallel machines or sequential machines, etc.
6. References
Chen, Z.L. and Vairaktarakis, G.L., 2005. Integrated Scheduling of Production and
Distribution Operations. Management Science, 51(4), 614-628.
Garcia, J.M., Lozano, S. and Canca, D., 2004. Coordinated scheduling of production and
delivery from multiple plants. Robotics and Computer-Integrated Manufacturing, 20(3),
191-198.
Li, K.P., Ganesan, V.K and Sivakumar, A.I., 2005. Synchronized scheduling of Assembly and
Multi-Destination Air Transportation in Consumer Electronics Supply Chain.
International Journal of Production Research᧨43(13), 2671-2685.
Li, K.P., Ganesan, V.K. and Sivakumar, A.I., 2006. Scheduling of Single Stage Assembly with
Air Transportation in A Consumer Electronics Supply Chain. Computers &
Industrial Engineering, 51, 264-278.
Multiprocessor Scheduling: Theory and Applications 416
Panwalkar, S.S., Smith, M.L., and Seidmann, A., 1982, Common due-date assignment to
minimize total penalty for the one machine scheduling problem. Operations
Research, 30, 391-399.
Roslöf, J., Harjunkoski, I., Björkqvist, J, Karlsson, S. & Westerlund, T. (2001). An MILP-based
reordering algorithm for complex industrial scheduling and rescheduling.
Computers & Chemical Engineering, 25(4-6), 821-828.
Szelke, E. & Markus G. (1997). A learning reactive scheduler using CBR/L. Computers in
Industry, 33, 31-46.
Wan, G.H. & Yen, B.M.P.C. (2002). Tabu search for single machine scheduling with distinct
due windows and weighted earliness/tardiness penalties. European Journal of
Operational Research, 142(2), 271-281.
Winston, W.L. (1994). Operations research: applications and algorithms (3rd edition).
(Duxbury, California).
23
Scheduling for Dedicated Machine Constraint
Arthur Shr
1
, Peter P. Chen
1
and Alan Liu
2
1
Department of Computer Science, Louisiana State University,
2
Department of Electrical Engineering, National Chung Cheng University
1
U.S.A.,
2
Taiwan, R.O.C.
1. Introduction
We have proposed the heuristic Load Balancing (LB) scheduling (Shr et al., 2006a) (Shr et al.,
2006b) (Shr et al., 2006c) and Multiagent Scheduling System (MSS) (Shr, et al. 2006d)
approaches to provide solutions to the issue of dedicated photolithography machine
constraint. The dedicated photolithography machine constraint, which is caused by the
natural bias of the photolithography machine, is a new challenge in the semiconductor
manufacturing systems. Natural bias will impact the alignment of patterns between
different layers. This is especially true for smaller dimension IC for high technology
products. A study considered different production control policies for semiconductor
manufacturing, including a “machine dedication policy” in their simulation, has reported
that the scheduling policy with machine dedication had the worst performance of
photolithography process (Akcalt et al., 2001). The machine dedication policy reflects the
constraint we are discussing here.
In our previous work, along with providing the LB scheduling or MSS approaches to the
dedicated machine constraint, we have also presented a novel model––the Resource
Schedule and Execution Matrix (RSEM) framework. This knowledge representation and
manipulation method can be used to tackle the dedicated machine constraint. A simulation
system has also been implemented in these researches and we have applied our proposed
scheduling approaches to compare with the Least Slack (LS) time approach in the simulation
system (Kumar & Kumar, 2001). The reason for choosing the LS scheduling approach was
that this approach was the most suitable method for solving the types of problems caused
by natural bias at the time of our survey.
The LS scheduling approach has been developed in the research of Fluctuation Smoothing
Policy for Mean Cycle Time (FSMCT) (Kumar & Kumar, 2001), in which the FSMCT
scheduling policy is for the re-entrant production lines. The entire class of the LS scheduling
policies has been proven stable in a deterministic setting (Kumar, 1994) (Lu & Kumar, 1991).
The LS approach sets the highest priority to a wafer lot whose slack time is the smallest in
the queue buffer of one machine. When the machine becomes idle, it selects the highest
priority wafer lot in the queue buffer to service next. However, the simulation result has
shown that the performances of both our proposed LB and MSS approaches were better
than the LS method. Although the simulations were simplified, they have reflected the real
situation we have met in the factory.
Multiprocessor Scheduling: Theory and Applications
418
Extending the previous simulations, we introduce two different types of simulation for the
dedicated machine constraint in this paper. One is to show that our proposed LB scheduling
approach is still better than the LS approach under the different capacity and service
demand of the wafer lots. The case of setting with different photolithography machines
represents the different capacity of the semiconductor factory, while the case of setting with
different photolithography layers represents the different products’ demand for the
semiconductor factory. The other simulation is to show the situation of the thrashing
phenomenon, i.e., the load unbalancing among the photolithography machines during the
process when we apply the LS approach. We have also learned that the load unbalancing is
consistent with different photolithography machines.
The rest of the paper is organized as follows: Section 2 describes the motivation of this
research including the description of dedicated machine constraint, the load balancing issue,
and related research. In Section 3, we present the construction procedure and algorithms of
the RSEM framework to illustrate the proposed approach for dedicated machine constraint.
The proposed LB scheduling approach is presented along with an example of the
semiconductor factory in Section 4. Section 5 shows the simulation results and we conclude
the work in Section 6.
2. Motivation
2.1 Dedicated Machine Constraint
Dedicated machine constraint forces wafer lots passing through each photolithography
stage to be processed on the same machine. The purpose of the limitation is to prevent the
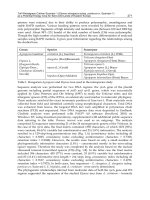
impact of natural bias and to keep a good yield of the IC product. Fig. 1. describes the
dedicated machine constraint. When material enters the photolithography stage with
dedicated machine constraint, the wafer lots dedicated to machine X need to wait for it, even
if machine Y is idle. By contrast, when wafer lots enter into non-photolithography stages
without any machine constraints, they can be scheduled to any machine, A, B, or C.
Non-Photolithography Stages
Machine A
Machine
B
Machine
C
Machine
X
Machine
Y
Machine
Z
Busy
Photolithography Stages
With dedicated machine Constraint
idle
Wafer lots
Without dedicated machine Constraint
Wafer lots
Figure 1. Dedicated machine constraint
Scheduling for Dedicated Machine Constraint
419
Presently, the dedicated machine constraint is the most significant barrier to improving
productivity and fulfilling the requests of customers. It is also the main contributor to the
complexity and uncertainty of semiconductor manufacturing. Moreover, photolithography
is the most important process in semiconductor manufacturing. A good yield of IC products
is heavily dependent on a good photolithography process. At the same time, the process can
also cause defects. Therefore, the performance of a factory particularly relies on the
performance of photolithography machines.
2.2 Load Balancing Issue
The load balancing issue is mainly derived from the dedicated photolithography machine
constraint. This happens because once the wafer lots have been scheduled to one of the
machines at the first photolithography stage, they must be assigned to the same machine in
all subsequent photolithography stages. Therefore, if we randomly schedule the wafer lots
to arbitrary photolithography machines at the first photolithography stage, then the load of
all photolithography machines might become unbalanced. Any unexpected abnormal events
or a breakdown of machines will cause a pile-up of many wafer lots waiting for the machine
and cause a big problem for the factory. Therefore, the unbalanced load among
photolithography machines means that some of the photolithography machines become idle
and remain so for a while, due to the fact that no wafer lots can be processed, and the other
is always busy while many wafer lots bound to this machine are awaiting processing. As a
result, some wafer lots are never delivered to the customer on time, and the performance of
the factory decreases. Moreover, it cannot meet the fast-changing market of the
semiconductor industry.
2.3 Related Research
The scheduling problems of the semiconductor manufacturing systems or photolithography
machines have been studied by some researchers. By using a queuing network model, a ''Re-
Entrant Lines'' model has been proposed to provide the analysis and design of the
semiconductor manufacturing system. Kumar's research described several scheduling
policies with some results concerning their stability and performance (Kumar, 1993)
(Kumar, 1994). These scheduling policies have been proposed to deal with the buffer
competing problem in the re-entrant production line, wherein they pick up the next wafer
lot in the queue buffers when machines become idle. A study proposed a stochastic dynamic
programming model for scheduling a new wafer lot release and bottleneck processing by
stage in the semiconductor factory. This scheduling policy is based on the paradigm of
stochastic linear quadratic control and incorporates considerable analysis of uncertainties in
products' yield and demand (Shen & Leachman, 2003). A special family-based scheduling
rule, Stepper Dispatch Algorithm (SDA-F), is proposed for the wafer fabrication system
(Chern & Liu, 2003). SDA-F uses a rule-based algorithm with threshold control and least
slack principles to dispatch wafer lots in photolithography stages. Many queuing network
scheduling policies or methods have been published to formulate the complexity of
semiconductor manufacturing problems; however, they need to be processed off-line and
cannot respond rapidly to dynamic changes and uncertainty in the environment.
Vargas-Villamil, et al. proposed a three-layer hierarchical approach for semiconductor
reentrant manufacturing (Vargas-Villamil et al., 2003), which decomposes the big and
intractable problems of semiconductor manufacturing into smaller control problems. It
Multiprocessor Scheduling: Theory and Applications
420
reduces the effort and frequency of the control decisions. The scheduling problems of the
photolithography machines have been studied by some researchers. Their proposed
scheduling methods make an effort to improve the performance of the photolithography
machines. Two approaches were reported to use simulations to model the photolithography
process. One of them proposed a Neural Network approach to develop an intelligent
scheduling method according to a qualifying matrix and lot scheduling criteria to improve
the performance of the photolithography machines (Mönch et al., 2001). The other approach
decides the wafer lots assignment of the photolithography machines at the time when the
wafer lots are released to the manufacturing system in order to improve the load-balancing
problem (Arisha & Young, 2004). These researches have emphasized that photolithography
process scheduling issues are the most important and critical challenge of the semiconductor
manufacturing system. However, it might be difficult to have the proper training data to
build a Neural Network scheduling system. It is also inefficient to manually adjust lot
scheduling criteria or lot assignment to fit the fast-changing market of semiconductor
manufacturing. Moreover, their proposed scheduling methods did not concern the
dedicated machine constraint.
3. Resource Schedule and Execution Matrix (RSEM) Framework
In this section, the procedure and algorithm associated with the Resource Schedule and
Execution Matrix (RSEM) framework are presented. The RSEM framework construction
process consists of three modules including the Task Generation, Resource Calculation, and
Resource Allocation modules.
The first module, Task Generation, models the tasks for the scheduling system and it is
represented in a two-dimensional task matrix. One dimension is reserved for the tasks, t
1
, t
2
,
…, t
n
; the other represents the periodical time events (or steps) s
1
, s
2
, …,s
m
. Each task has a
sequential Process Pattern to represent the resources it needs to go from the raw material to
a product during the process sequence and we put the process pattern in an array. We
define each type of resource as r
k
, k =1 to o. For example, the process pattern, r
1
, r
2
, …, r
o
,
means that a particular task needs the resources in the sequence of r
1
first and r
2
following
that until r
o
is gained. Therefore, the matrix looks as follows:
s
1
s
2
. . s
q
. . . s
j
. s
m
t
1
r
1
r
2
r
3
t
2
r
3
r
4
. r
1
r
3
t
i
r
3
r
4
r
k
. . .
t
n
Scheduling for Dedicated Machine Constraint
421
The symbol r
k
in the task matrix entry [t
i
, s
j
] represents that task t
i
needs the resource r
k
at
the time s
j
. If t
i
starts to be processed at s
q
, and the total number of steps needed for t
i
is p, we
will fill its process pattern into the matrix from [t
i
, s
q
]… to [t
i
, s
q+p-1
] with r
k
, k =1 to o. All the
tasks, t
1
…t
n
, follow the illustration above to form a task matrix in the Task Generation
module. To represent dedicated machine constraint in the matrix for this research, the
symbol r
k
x
, a replacement of r
k
, represents that t
i
has been dedicated to a particular instance x
of a resource type r
k
at s
j
. One more symbol w
k
represents the wait situation when the r
k
cannot allocate to t
i
at s
j
. The situation can be that r
k
is assigned to other higher priority tasks
or it is breakdown. This symbol will be used in the Resource Allocation module.
The Resource Calculation module summarizes the value of each dimension as the factors for
the scheduling rule of the Resource Allocation module. For example, by counting the task
pattern of the row t
i
in the task matrix, we can determine how many steps t
i
processed after
it finished the whole process. We can also realize how many wait steps t
i
has had by
counting w
k
from the starting step to the current step in that row of the task matrix.
Furthermore, if we count the symbol r
k
x
at the column s
j
, we can know how many tasks will
need the machine m
x
of resource r
k
at s
j
.
We need to generate the task matrix, obtain all the factors for the scheduling rules, and build
up the scheduling rules before starting the execution of the Resource Allocation module. The
module schedules the tasks to the suitable resource according to the factors and predefined
rules. To represent the situation of waiting for r
k
; i.e. when the resource of r
k
is not available
for t
i
at s
j
, then we will not only insert the symbol w
k
in the pattern of t
i
, but will also need to
shift one step for the process pattern following t
i
in the matrix. Therefore, we can obtain the
updated factor for the number of tasks waiting for r
k
at s
j
by simply counting w
k
at the
column s
j
. We can also obtain the factor for the number of wait steps t
i
has by counting w
k
,
1
≤
k
≤
o by the row t
i
in the matrix.
Our proposed approach can provide two kinds of functions. One is that, to define the factors
and resource allocation rules according to expert knowledge, we can quickly determine the
allocation of resources at each step by the factors summarized from the task matrix. The
other is that we can predict the bottleneck or critical situation quickly by executing proper
steps forward. This can also evaluate the predefined rules to obtain better scheduling rules
for the system at the same time. Moreover, by using different predefined rules and factors,
the RSEM framework could apply to different scheduling issues or constraints of
semiconductor manufacturing.
3.1 Procedure for Constructing the RSEM framework
To better understand our proposed scheduling process, the flowchart of the RSEM
framework construction process is shown in Fig. 2. The process of using the RSEM
framework starts from the Task Generation module, and it will copy the predefined task
patterns of tasks into the matrix. Entering the Resource Calculation module, the factors for the
tasks and resources will be brought out at the current step. This module will update these
factors again at each scheduling step. The execution of the scheduling process is in the
Resource Allocation module. When we have scheduled for all the tasks for the current step,
we will return to check for new tasks and repeat the whole process again by following the
flowchart. We will exit the scheduling process when we reach the final step of the last task if
there is still no new task appended to the matrix. After that, the scheduling process will
restart immediately when the new tasks arrives in the system.
Multiprocessor Scheduling: Theory and Applications
422
Figure 2. Flowchart of the RSEM framework construction process
3.2 Algorithms Associated to the RSEM framework
To make the construction process of the proposed RSEM framework more concrete, three
algorithms for the Task Generation (Algorithm-1), Resource Calculation (Algorithm-2), and
Resource Allocation (Algorithm-3) modules are depicted as follows.
In Algorithm-1, the procedure appends tasks to the task matrix by copying the task patterns
of the tasks in the matrix. It will start from the start step s
s
and go to the end step s
e
of each
task. The s
s
will not start before the current step s
c
and the s
e
should not end beyond the
maximum step m of the matrix in the system. The task matrix will be passed to and
manipulated at the other two algorithms.
Algorithm-1 Task_Generation
{
// s
c
s
s
s
e
m, where m is the max step in system, and
// s
c
is current step.
for i = 1 to n do
Copy task pattern of t
i
into matrix from its starting step s
s
, to its ending step s
e
next
}
Scheduling for Dedicated Machine Constraint
423
Algorithm-2 Resource_Calculation
{
//Factor for tasks, function: Total_Step(t
i
)
//To count total steps of tasks n: total tasks, m: max step in system.
for i = 1 to n do
for j = 1 to m
do;
if (matrix[t
i
,s
j
] is not empty) then
Total_Step(t
i
)= Total_Step(t
i
) + 1; /*Count total steps*/
end if
next
next
//Factor for tasks, function: Wait_Step(t
i
)
//To count total wait steps of tasks, s
c
: current step.
for i = 1 to n do
for j = 1 to s
c
do;
if (matrix[t
i
,s
j
] = w
k
) then
Wait_Step(t
i
)= Wait_Step(t
i
) + 1; /*Count wait steps*/
end if
next
next
//Factor for resource, function: Resource_Demand(r
k
)
//To count total tasks which are need of the resource r
k
//o: total resource.
for k = 1 to o do
for i = 1 to n do
if (matrix[t
i
,s
c
] = r
k
) then
Resource_Demand(r
k
)= Resource_Demand(r
k
) + 1;
end if
next
next
//Factor for Resource, function: Queue_Buffer(r
k
)
//To count total tasks which are waiting for of the resource r
k
for k = 1 to o do
for i = 1 to n do
if (matrix[t
i
,s
c
] = w
k
) then
Queue_Buffer(r
k
)=+1;
end if
next
next
//Factor for
…. // factor Load, Utilization, and so on.
}
We will have four factors ready for scheduling after the Resource Calculation process
described in Algorithm-2, namely, Total_Step(t
i
) and Wait_Step(t
i
) for the tasks, and
Resource_Demand(r
k
) and Queue_Buffer(r
k
) for the resources.
Multiprocessor Scheduling: Theory and Applications
424
We obtain these factors by simply counting the occurrences of the desired symbols like r
k
or
w
k
, along the specific task t
i
dimension or the current step s
c
of the task matrix. We can also
include other factors in this module depending on different applications, e.g., the factors of
the load of a particular photolithography machine and the remaining photolithography
stages of the tasks in the example of Section 3.
The procedure of Algorithm-3 executes the scheduling process for the tasks and resources.
The first part of the scheduling process allocates all the available resources to optimize the
performance or production goals of the manufacturing system, but it must satisfy all the
constraints. The scheduling rule of our proposed Load Balancing approach is one of the
examples. After the process for resource allocation, the second part of the scheduling
process is to insert a wait step and shift a step for all the tasks which are not assigned to a
machine. A wait symbol w
k
represents the state of waiting for machine type k, and a w
k
x
is
waiting for dedicated machine number x, m
x
, of machine type k.
Algorithm-3 Resource_Allocation
{
//Scheduling; o: total resource, s
c
:current step.
for k = 1 to o do
Assign tasks to r
k
, according to predefined rules
e.g., the Load Balancing scheduling (LB),
Multiagent Scheduling System (MSS) or
Least Slack time scheduling (LS) rules
next
//Execution; shift process pattern of the tasks,
//which do not be scheduled at current step;
//x: the machine number.
for i = 1 to n do
if (t
i
will not take the resource at this step) then
insert w
k
to wait for r
k
; /* without dedicated constraint */
or
insert w
x
k
to wait for m
x
of r
k
; /*dedicated constraint */
end if
next
}
4. Load Balancing Scheduling Method
In this section, we apply the proposed Load Balancing (LB) scheduling method to the
dedicated machine constraint of the photolithography machine in semiconductor
manufacturing. The LB method uses the RSEM framework as a tool to represent the
temporal relationship between the wafer lots and machines during each scheduling step.
4.1 Task Generation
After obtaining the process flow for customer product from the database of semiconductor
manufacturing, we can use a simple program to transform the process flow into the matrix
representation. There exist thousands of wafer lots and hundreds of process steps in a
Scheduling for Dedicated Machine Constraint
425
typical factory. We start by transforming the process pattern of wafer lots into a task matrix.
We let r
2
represent the photolithography machine and r
k
(k
≠
2) represent non-
photolithography machines. The symbol r
2
x
in the matrix entry [i,j] represents the wafer lot t
i
needing the photolithography machine m
x
at the time s
j
with dedicated machine constraint,
while r
k
(k
≠
2) in [i,j] represents the wafer lot t
i
needing the machine type k at s
j
without
dedicated machine constraint. There is no assigned machine number for the
photolithography machine before the wafer lot has passed the first photolithography stage.
Suppose that the required resource pattern of t
1
is as follows:
r
1
r
3
r
2
r
4
r
5
r
6
r
7
r
2
r
4
r
5
r
6
r
7
r
8
r
9
r
1
r
3
r
2
r
4
r
5
r
6
r
7
r
3
r
2
r
8
r
9
…and starts the process in the factory at s
1
. We will fill its
pattern into the matrix from [t
1
,s
1
] to [t
1
,s
n
], which indicates that t
1
needs the resource r
1
at
the first step, resource r
3
at the second step, and so on. The photolithography process, r
2
, in
this process pattern has not been dedicated to any machine and the total number of steps for
t
1
is n. The task t
2
in the task matrix has the same process pattern as t
1
but starts at s
3
;
meanwhile, t
i
in the matrix starts at s
8
. It requires the same type of resource r
2
, the
photolithography machine, but the machine is different from the machine t
2
needed at s
10
;
i.e., t
2
needs the machine m
1
, while t
i
has not been dedicated to any machine yet. Two tasks,
t
2
and t
i
, might compete for the same resource r
4
at s
11
if r
4
is not enough for them at s
11
. The
following matrix depicts the patterns of these tasks.
s
1
s
2
s
3
s
4
s
5
s
6
s
7
s
8
s
9
s
10
s
11
s
12
s
13
s
20
s
21
s
22
s
23
s
24
s
25
s
j
s
m
t
1
r
1
r
3
r
2
r
4
r
5
r
6
r
7
r
2
r
4
r
5
r
6
r
7
r
8
r
6
r
7
r
3
r
2
r
8
r
9
.
t
2
r
1
r
3
r
2
r
4
r
5
r
6
r
7
r
2
1
r
4
r
5
r
6
r
4
r
5
r
6
r
7
r
3
r
2
r
8
r
9
t
i
r
1
r
3
r
2
r
4
r
6
r
5
r
k
4.2 Resource Calculation
The definitions and formulae of these factors for the LB scheduling method in the Resource
Calculation module are as follows:
W: wafer lots in process,
W
p
: wafer lots dedicated to the photolithography machine, p,
P: numbers of photolithography machines,
R(t
i
): remaining photolithography layers for the wafer lot t
i
,
K: types of machine (resource),
s
s
: start step, s
c
: current step, s
e
: end step.
Required resources:
• How many wafer lots will need the k type machine x at s
j
?
PxrsttsrRR
Wt
x
kjiij
x
k
i
≤≤
¦
==
∈
1,}][|{),(
,
(1)
Count steps:
• How many wait steps did t
i
have before s
j
?
KkwstttWaitStep
c
s
s
sj
kjiii
≤≤
¦
==
=
1},],[|{)(
(2)
Multiprocessor Scheduling: Theory and Applications
426
• How many steps will t
i
have?
¦
≠=
=
e
s
s
sj
jiii
nullstttSteps }],[|{)(
(3)
• The load factor, L
p
, of the photolithography machine p.
¦
∈
×=
p
i
Wt
ii
p
tRtL )}({
(4)
L
p
is defined as the wafer lots that are limited to machine p multiplied by the remaining
layers of photolithography stages these wafer lots have. L
p
is a relative parameter,
representing the load of the machine and wafer lots limited to one machine compared to
other machines. A larger L
p
means that more required service from wafer lots is limited to
this machine. The LB scheduling method uses these factors to schedule the wafer lot to a
suitable machine at the first photolithography stage, which is the only photolithography
stage without the dedicated constraint.
4.3 Resource Allocation
The process flow of the Resource Allocation module for the example is described in this
section. Suppose we are currently at s
j
, and the LB scheduling method will start from the
photolithography machine. We check to determine if there is any wafer lot that is waiting
for the photolithography machines at the first photolithography stage. The LB method will
assign the p with the smallest L
p
for them, one by one. After that, these wafer lots will be
dedicated to a photolithography machine. For each p, the LB method will select one wafer
lot of W
p
that has the largest WaitStep(t
i
) for it. The load factor, L
p
, will be updated after
these two processes. The other wafer lots dedicated to each p, which cannot be allocated to
the p at current step s
j
, will insert a w
2
in their pattern. For example, at s
10
, t
i
has been
assigned to p; therefore, t
i+1
will have a w
2
inserted into s
10
, and then all the following
required resources of t
i+1
will shift one step. All other types of machines will have the same
process without need to be concerned with the dedicated machine constraint. Therefore, we
assigned the wafer lot that has the largest WaitStep(t
i
), then the second largest, and so on for
each machine r
k
. Similarly, the LB method will insert a w
k
for the wafer lots which will not be
assigned to machines r
k
at this current step. Therefore, WaitStep(t
i
) represents the delay
status of t
i
.
s
9
s
10
s
11
s
12
s
13
s
14
s
j
s
m
t
i
r
2
p
r
4
r
6
r
5
r
7
t
i+1
w
2
r
2
p
r
4
r
6
r
5
↑→→→→
Scheduling for Dedicated Machine Constraint
427
4.4 Discussion
Realistically, it is not difficult to approximate the real machine process time for different
steps using one or several steps together with a smaller time scale step. We can also use the
RSEM framework to represent complex tasks and allocate resources by simple matrix
calculation. This reduces much of the computation time for the complex problem.
Another issue is that the machines in the factory have a capacity limitation due to the capital
investment, which is the resource constraint. The way to make the most profit for the
investment mostly depends on optimal resource allocation techniques. However, most
scheduling policies or methods can provide neither the exact allocation in an acceptable
time, nor a robust and systematic resource allocation strategy. We use the RSEM framework
to represent complex tasks and allocate resources by simple matrix calculation. This reduces
much of the computation time for the complex problem.
5. Simulation
We have done two types of simulations using both the Least Slack (LS) time scheduling and
our LB approach. The LS policy has been developed in the research, Fluctuation Smoothing
Policy for Mean Cycle Time (FSMCT) (Kumar & Kumar, 2001). The FSMCT scheduling
policy is for re-entrant production lines. The LS scheduling policy sets the highest priority to
a wafer lot whose slack time is the smallest in the queue buffer of one machine. When the
machine becomes idle, it will select the highest priority wafer lot in the queue buffer to
service next. The entire class of LS policies has been proven stable in a deterministic setting
(Kumar, 1994) (Lu & Kumar, 1991), but without the dedicated machine constraint. To
simplify the simulation to easily represent the scheduling approaches, we have made the
following assumptions: (1) each wafer lot has the same process steps and quantity, and (2)
there is an unlimited capacity for non-photolithography machines
5.1 Simulation Results
We implemented a simulation program in Java and ran the simulations on NetBeans IDE 5
( To represent the different capacity and required resource
demand situation for a semiconductor factory, we take account of different
photolithography machines and wafer lots with different photolithography layers in the
simulation program. Our simulation was set with 6, 10, 13, and 15 photolithography
machines, and 11 to 15 photolithography layers. There are 1000 wafer lots in the simulation.
The wafer arrival rate between two wafer lots is a Poisson distribution. We also set up the
probability of breakdown with 1% for each photolithography machine at each step in the
simulation. The duration of each breakdown event may be 1 to 4 steps and their individual
probability is based on a Uniform distribution.
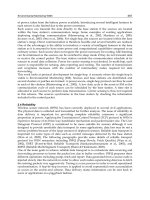
Fig. 3(a) illustrated the average Mean Time Between Failures (MTBF) and Mean Time
Between Repairs (MTBR) of different photolithography machines, i.e. in the case of 6
machines the average of MTBF and MTBR is 101.03 and 2.97 steps, respectively. While the
average MTBF and MTBR of different photolithography layers are shown in Fig. 3(b), in the
case of 15 layers the average of MTBF and MTBR is 102.56 and 3.30 steps, respectively.
Multiprocessor Scheduling: Theory and Applications
428
Machine Breakdown Different Machines
100.19
101.57
101.89
101.03
2.97
2.98
2.99
3.00
0
25
50
75
100
125
6101315
Machine
Step
0
1
2
3
4
5
Step
MTBF MTBR
(a)
Machine Breakdown Different Layers
103.23
102.56
101.09
100.11
98.85
3.03
3.00
2.96
2.96
2.97
0
25
50
75
100
125
11 12 13 14 15
Layer
Step
0
1
2
3
4
5
Step
MTBF
MTBR
(b)
Figure 3. MTBF and MTBR of machine breakdown
Scheduling for Dedicated Machine Constraint
429
In the task patterns, the symbol r represents the non-photolithography stage; and r
2
the
photolithography stage. The basic task pattern for 11 layers is:
“rrrrr
2
rrrrrrrrrrrrrrr
2
r
2
r
2
r
2
r
2
r
2
rrrrrrrrrrrrrrrr
2
r
2
r
2
r
2
rrrrrrrrrrrrrrrrrr
2
r
2
r
2
rrrrrrrr
2
r
2
rrrrrrr
2
r
2
rrrrr
2
r
2
rrrrr
2
r
2
rrrrr
2
r
2
rrrrr
2
r
2
rrrrr
2
r
2
rrrr”. Then the task pattern for each added layer after 11 layers
is: “r
2
rrrr”. Therefore, the task pattern for 12 layers is:
“rrrrr
2
rrrrrrrrrrrrrrr
2
r
2
r
2
r
2
r
2
r
2
rrrrrrrrrrrrrrrr
2
r
2
r
2
r
2
rrrrrrrrrrrrrrrrrr
2
r
2
r
2
rrrrrrrr
2
r
2
rrrrrrr
2
r
2
rrrrr
2
r
2
rrrrr
2
r
2
rrrrr
2
r
2
rrrrr
2
r
2
rrrrr
2
r
2
rrrrr
2
r
2
rrrr”,…, and the task pattern for 15 layers is:
“rrrrr
2
rrrrrrrrrrrrrrr
2
r
2
r
2
r
2
r
2
r
2
rrrrrrrrrrrrrrrr
2
r
2
r
2
r
2
rrrrrrrrrrrrrrrrrr
2
r
2
r
2
rrrrrrrr
2
r
2
rrrrrrr
2
r
2
rrrrr
2
r
2
rrrrr
2
r
2
rrrrr
2
r
2
rrrrr
2
r
2
rrrrr
2
r
2
rrrrr
2
r
2
rrrrr
2
r
2
rrrrr
2
r
2
rrrrr
2
r
2
rrrr”. The task matrix for 15 layers
looks as follows:
s
1
……………………………………………………………………………… s
m
t
1
rrrrr
2
rrrrrrrrrrrrrrr
2
r
2
r
2
r
2
r
2
r
2
rrrrrrrrrrrrrrrr
2
r
2
r
2
r
2
rrrrr r
2
r
2
rrrr
t
2
rrrrr
2
rrrrrrrrrrrrrrr
2
r
2
r
2
r
2
r
2
r
2
rrrrrrrrrrrrrrrr
2
r
2
r
2
r
2
rrrrr r
2
r
2
rrrr
:
t
i
rrrrr
2
rrrrrrrrrrrrrrr
2
r
2
r
2
r
2
r
2
r
2
rrrrrrrrrrrrrrrr
2
r
2
r
2
r
2
rrrrr
t
1000
:
Task Matrix (15 photolithography layers)
Both LB and LS approaches were applied to the same task matrix during each simulation
generated by the Task Generation module described in Section 3. The result of simulation, as
described in detail in the following subsections, shows the advantage of the LB approach
over the LS approach under different numbers of machines by the average of the different
photolithography layers, and under different numbers of layers by the average of the
different photolithography machines.
Different Photolithography Machines: By comparing the mean of cycle time, in the case of
6 machines, the LS method has 164.49 (LS-LB) steps more than the LB approach. That is
7.12% ((LS-LB)/LS) more in the simulation. The different steps from machines 10 to 15
incrementally rise from 175.54 to 184.16 steps and the percentages of the difference rises
from 14.92% to 28.83%. The simulation result of different photolithography machines
indicates that the more photolithography machines, the better the LB approach performs
than the LS method does. The simulation result is shown in Fig. 4(a).
Different Photolithography Layers: On the other hand, the simulation result of different
layers (11 to 15 layers) indicates that there is no significant difference with different
photolithography layers. The outperformance in percentage of the LB approach is between
the minimum, 16.71%, to the maximum, 19.72%. Such a simulation result is shown in Fig.
4(b).
Multiprocessor Scheduling: Theory and Applications
430
Simulation Result Different Machines
184.16
172.05
175.54
164.49
7.12%
14.92%
21.73%
28.83%
0
50
100
150
200
6101315
Machine
Step
(LS-LB)
0%
10%
20%
30%
40%
%
((LS-LB)/LS)
Diff Step %
(a). Different Photolithography Machines
Simulation Result Different Layers
187.11
201.56
171.33
164.63
145.68
16.71%
19.72%
19.27%
17.73%
17.32%
0
50
100
150
200
250
11 12 13 14 15
Layer
Step
(LS-LB)
0%
10%
20%
30%
40%
50%
%
((LS-LB)/LS)
Diff Step
%
(b) Different Photolithography Layers
Figure 4. Simulation results
Scheduling for Dedicated Machine Constraint
431
5.2 Thrashing and Load Unbalancing
After applying the LS approach to the above simulations and counting the required
resource (Equation (1): RR(r
k
x
, s
j
) of Section 4.2, k=2, x=6, 10, 13, 15) for the
photolithography machines at each step, we can observe that the load balancing status in
terms of the difference between maximum and minimum counts of the required resource
for the machines becomes larger and unstable, i.e., the thrashing phenomenon takes place
in the simulations. The simulation is set with 6, 10, 13, and 15 photolithography machines
and 15 photolithography layers. In the simulation, the Max-Min and Standard Deviation
of wafer lots in machine buffers set with 6, 10, 13, and 15 machines are shown in the
graphs in Fig. 5 ((a), (b), (c), and (d)), respectively. The simulation results also reveal that
the fewer machines the system has, the worse the situation of an unbalanced load would
be to the system. On the other hand, while applying the LB method, the load balancing
status is stable and consistent with different machines, and it is always less then 2.5 at
each execution step.
6. Conclusion
We presented the Resource Schedule and Execution Matrix (RSEM) framework–a novel
representation and manipulation method for the tasks in this paper. The RSEM framework
is used as a tool to analyze the issue of dedicated machine constraint and develop solutions.
The simulation also showed that the proposed LB scheduling approach was better than the
LS method in various situations. Although the simulations are simplified, they reflect the
real situation we have met in the factory.
The advantage of the proposed RSEM framework is that we can easily apply various
policies to the scheduling system by simple calculation on a two-dimensional matrix. The
matrix architecture is easy for practicing other semiconductor manufacturing problems in
the area with a similar constraint. We also want to apply other scheduling rules to the
Resource Allocation module in the RSEM framework. Our intended future work is to develop
a knowledge-based scheduling system for the Resource Allocation module or to model it as
distributed constraint satisfaction scheduling project.
Multiprocessor Scheduling: Theory and Applications
432
Max-Min & STD of Machine Buffers - LS Method with 6 Machines
0
10
20
30
40
50
60
S
t
ep
=
0
Step=200
Step=40
0
Step=600
Step=80
0
Step
=
1
0
00
Step
=
1
20
0
Step
=
1
4
00
Step
=
1
600
Step
=
1
8
00
Step
=
2
000
Step
=
2
200
Step
=
2
4
00
Ste
p=2600
Step
=
2
8
00
Ste
p=3000
Step
=
3
2
00
Ste
p=3400
Step
=
3
6
00
Ste
p=3800
Step
=
4
0
00
Step
=
4
20
0
S
t
ep=4400
Step
=
4
60
0
S
t
ep=4800
Step
=
5
00
0
Step=5200
Step
=
5
40
0
Step=5600
Step
=
5
80
0
STD
Max-Min
Max STD = 19.93
Max-Min & STD of Machine Buffers - LB Approach with 6 Machines
0
10
20
30
40
50
60
Step
=
0
Step
=
180
Step=3
6
0
Step=5
4
0
S
tep=7
20
Step
=
900
Step
=10
8
0
S
te
p=1260
Step
=1
44
0
Step=
1
62
0
Step
=18
0
0
Step=1980
S
tep
=2160
Step=
2
34
0
Step
=25
2
0
Step
=27
0
0
S
te
p=2880
Step=
3
06
0
Step=
3
24
0
Step
=34
2
0
Step=3600
S
tep
=3780
Step=
3
96
0
Step
=41
4
0
Step
=43
2
0
S
te
p=4500
Step=
4
68
0
Step=
4
860
Step
=50
4
0
Step=5220
STD
Max-Min
Max STD = 2.19
Figure 5(a). Thrashing phenomenon—6 machines
Scheduling for Dedicated Machine Constraint
433
Max-Min & STD of Machine Buffers - LS Method with 10 Machines
0
10
20
30
40
50
60
St
ep
=
0
Step=130
Step
=
260
St
ep
=
3
9
0
St
ep
=
5
2
0
Step=650
Step=780
S
tep
=
9
1
0
St
ep
=
1
0
4
0
Step=1170
Step=130
0
S
tep
=
1
4
3
0
St
ep
=
1
5
6
0
Ste
p
=1690
Step=1820
S
tep
=
1
9
5
0
St
ep
=
2
0
8
0
St
ep
=
2
210
Step=2340
Step
=
2
4
7
0
St
ep
=
2
6
0
0
St
ep
=
2
730
Step=2860
Step
=
299
0
St
ep
=
3
1
2
0
St
ep
=
3
2
5
0
Step=3380
Step=351
0
S
tep
=
3
6
4
0
St
ep
=
3
7
7
0
STD
Max-Min
Max STD = 13.99
Max-Min & STD of Machine Buffers - LB Approach with 10 Machines
0
10
20
30
40
50
60
Step
=
0
Step
=
1
1
0
Step
=
2
2
0
Step
=
3
3
0
Step
=
4
4
0
Step
=
5
5
0
Step
=
6
6
0
Step=77
0
Step=88
0
Step=99
0
Ste
p
=1
10
0
Ste
p
=1
21
0
Ste
p
=13
2
0
Ste
p
=14
3
0
Ste
p
=1540
Ste
p
=1650
Step=1760
Step=1870
Step=1980
Step=2090
Ste
p
=22
0
0
Ste
p
=23
1
0
Ste
p
=24
2
0
Ste
p
=25
3
0
Ste
p
=26
4
0
Ste
p
=27
5
0
Ste
p=
2
86
0
Ste
p=
2
97
0
Ste
p=
3
08
0
Ste
p=
3
19
0
STD
Max-Min
Max STD = 1.96
Figure 5(b). Thrashing phenomenon—10 machines
Multiprocessor Scheduling: Theory and Applications
434
Max-Min & STD of Machine Buffers - LS Method with 13 Machines
0
10
20
30
40
50
60
S
t
ep=0
Step=100
Step
=2
00
Step=300
S
t
e
p
=4
00
S
t
e
p
=5
0
0
Step=
6
00
S
t
ep=7
0
0
Step=800
S
t
e
p
=9
0
0
St
e
p=1000
S
tep=1100
St
e
p
=1
20
0
S
te
p
=13
0
0
St
e
p=1400
S
tep=1500
St
e
p
=1
60
0
S
tep=17
0
0
S
te
p
=18
0
0
Step=1900
St
e
p
=2
00
0
St
e
p
=2
10
0
S
te
p
=22
0
0
St
e
p=2300
S
tep=2400
St
e
p
=2
50
0
S
te
p
=26
0
0
S
te
p
=27
0
0
S
tep=2800
STD
Max-Min
Max STD = 11.03
Max-Min &STD of Machine Buffers - LB Approach with 13 Machines
0
10
20
30
40
50
60
Step
=
0
Step
=
9
0
Step
=
180
Step
=
270
Step
=
360
Step
=
450
Step
=
540
Step=630
Step=720
Step=8
10
Step=9
00
Step=9
90
Step=10
8
0
Step=11
7
0
Step=12
6
0
Step=13
5
0
Step=14
4
0
Ste
p
=1530
Ste
p
=1620
Ste
p
=1710
S
te
p
=1800
S
te
p
=1890
S
te
p
=1980
S
te
p
=2070
Step
=
2
16
0
Step=22
5
0
Step=23
4
0
Step=24
3
0
STD
Max-Min
Max STD = 1.85
Figure 5(c). Thrashing phenomenon—13 machines