Báo cáo hóa học: "Research Article Securing Collaborative Spectrum Sensing against Untrustworthy Secondary Users in Cognitive Radio Networks" potx
Bạn đang xem bản rút gọn của tài liệu. Xem và tải ngay bản đầy đủ của tài liệu tại đây (1.22 MB, 15 trang )
Hindawi Publishing Corporation
EURASIP Journal on Advances in Signal Processing
Volume 2010, Article ID 695750, 15 pages
doi:10.1155/2010/695750
Research Article
Securing Collaborative Spectrum Sensing against Untrustworthy
Secondary Users in Cognit ive Radio Networks
Wenkai Wang,
1
Husheng Li,
2
Yan (Lindsay) Sun,
1
and Zhu Han
3
1
Department of Electrical, Computer and Biomedical Engineering, University of Rhode Island, Kingston, RI 02881, USA
2
Department of Electrical Engineering and Computer Science, University of Tennessee, Knoxville, TN 37996, USA
3
Department of Electrical and Computer Engineering, University of Houston, Houston, TX 77004, USA
Correspondence should be addressed to Wenkai Wang,
Received 14 May 2009; Revised 14 September 2009; Accepted 1 October 2009
Academic Editor: Jinho Choi
Copyright © 2010 Wenkai Wang et al. This is an open access article distributed under the Creative Commons Attribution License,
which permits unrestricted use, distribution, and reproduction in any medium, provided the original work is properly cited.
Cognitive radio is a revolutionary paradigm to migrate the spectrum scarcity problem in wireless networks. In cognitive radio
networks, collaborative spectrum sensing is considered as an effective method to improve the performance of primary user
detection. For current collaborative spectrum sensing schemes, secondary users are usually assumed to report their sensing
information honestly. However, compromised nodes can send false sensing information to mislead the system. In this paper,
we study the detection of untrustworthy secondary users in cognitive radio networks. We first analyze the case when there is
only one compromised node in collaborative spectrum sensing schemes. Then we investigate the scenario that there are multiple
compromised nodes. Defense schemes are proposed to detect malicious nodes according to their reporting histories. We calculate
the suspicious level of all nodes based on their reports. The reports from nodes with high suspicious levels will be excluded in
decision-making. Compared with existing defense methods, the proposed scheme can effectively differentiate malicious nodes and
honest nodes. As a result, it can significantly improve the performance of collaborative sensing. For example, when there are 10
secondary users, with the primary user detection rate being equal to 0.99, one malicious user can make the false alarm rate (P
f
)
increase to 72%. The proposed scheme can reduce it to 5%. Two malicious users can make P
f
increase to 85% and the proposed
scheme reduces it to 8%.
1. Introduction
Nowadays the available wireless spectrum becomes more and
more scarce due to increasing spectrum demand for new
wireless applications. It is obvious that current static fre-
quency allocation policy cannot meet the needs of emerging
applications. Cognitive radio networks [1–3], which have
been widely studied recently, are considered as a promising
technology to migrate the spectrum shortage problem. In
cognitive radio networks, secondary users are allowed to
opportunistically access spectrums which have already been
allocated to primary users, given that they do not cause
harmful interference to the operation of primary users. In
order to access available spectrums, secondary users have to
detect the vacant spectrum resources by themselves without
changing the operations of primary users. Existing detection
schemes include matched filter, energy detection, cyclosta-
tionary detection, and wavelet detection [2–6]. Among these
schemes, energy detection is commonly adopted because it
does not require a priori information of primary users.
It is known that wireless channels are subject to fading
and shadowing. When secondary users experience multipath
fading or happen to be shadowed, they may fail to detect
the existence of primary signal. As a result, it will cause
interference to primary users if they try to access this
occupied spectrum. To cope with this problem, collaborative
spectrum sensing [7–12] is proposed. It combines sensing
results of multiple secondary users to improve the probability
of primary user detection. There are many works that address
the cooperative spectrum sensing schemes and challenges.
The performance of hard-decision combining scheme and
soft-decision combining scheme is investigated in [7, 8].
In these schemes, all secondary users send sensing reports
to a common decision center. Cooperative sensing can
also be done in a distributed way, where secondary users
collect reports from their neighbors and make the decision
2 EURASIP Journal on Advances in Signal Processing
individually [13–15]. Optimized cooperative sensing is stud-
ied in [16, 17]. When the channel that forwards sensing
observations experiences fading, the sensing performance
degrades significantly. This issue is investigated in [18, 19].
Furthermore, energy efficiency in collaborative spectrum
sensing is addressed in [20].
There are some works that address the security issues of
cognitive radio networks. Primary user emulation attack is
analyzed in [21, 22]. In this attack, malicious users transmit
fake signals which have similar feature of primary signal.
In this way attacker can mislead legitimate secondary users
to believe that primary user is present. The defense scheme
in [21] is to identify malicious user by estimating location
information and observing received signal strength (RSS).
In [22], it uses signal classification algorithms to distinguish
primary signal and secondary signal. Primary user emulation
attack is an outsider attack, targeting both collaborative
and noncollaborative spectrum sensing. Another type of
attack is insider attack that targets collaborative spectrum
sensing. In current collaborative sensing schemes, secondary
users are often assumed to report their sensing information
honestly. However, it is quite possible that wireless devices
are compromised by malicious parties. Compromised nodes
can send false sensing information to mislead the system.
A natural defense scheme [23] is to change the decision
rule. The revised rule is, when there are k
− 1 malicious
nodes, the decision result is on only if there are at least k
nodes reporting on. However, this defense scheme has three
disadvantages. First, the scheme does not specify how to
estimate the number of malicious users, which is difficult to
measure in practice. Second, the scheme will not work in
soft-decision case, in which secondary users report sensed
energy level instead of binary hard decisions. Third, the
scheme has very high false alarm rate when there are multiple
attackers. This will be shown by the simulation results in
Section 4. The problem of dishonest users in distributed
spectrum sensing is discussed in [24]. The defense scheme in
this work requires secondary users to collect sensing reports
from their neighbors when confirmative decision cannot
be made. The scheme is also only applied to hard-decision
reporting case. Finally, current security issues in cognitive
radio networks, including attacks and corresponding defense
schemes, are concluded in [25].
In this paper, we develop defense solutions against
one or multiple malicious secondary users in soft-decision
reporting collaborative spectrum sensing. We first analyze
the single malicious user case. The suspicious level of each
node is estimated by their reporting histories. When the
suspicious level of a node goes beyond certain threshold,
it will be considered as malicious and its report will be
excluded in decision-making. Then, we extend this defense
method to handle multiple attackers by using an “onion-
peeling approach.” The idea is to detect malicious users in
a batch-by-batch way. The nodes are classified into two sets,
honest set and malicious set. Initially all users are assumed
tobehonest.Whenonenodeisdetectedtobemalicious
according to its accumulated suspicious level, it will be
moved into malicious set. The way to calculate suspicious
level will be updated when the malicious node set is updated.
Thisprocedurecontinuesuntilnonewmaliciousnodecan
be found.
Extensive simulations are conducted. We simulate the
collaborative sensing scheme without defense, the straight-
forward defense scheme in [23], and the proposed scheme
with different parameter settings. We observe that even a sin-
gle malicious node can significantly degrade the performance
of spectrum sensing when no defense scheme is employed.
And multiple malicious nodes can make the performance
even much worse. Compared with existing defense methods,
the proposed scheme can effectively differentiate honest
nodes from malicious nodes and significantly improve the
performance of collaborative spectrum sensing. For example,
when there are 10 secondary users, with the primary user
detection rate being equal to 0.99, one malicious user can
make the false alarm rate (P
f
) increase to 72%. While a
simple defense scheme can reduce P
f
to 13%, the proposed
scheme reduces it to 5%. Two malicious users can make P
f
increase to 85%, the simple defense scheme can reduce P
f
to 23%, the proposed scheme reduces it to 8%. We study
the scenario that malicious nodes dynamically change their
attack behavior. Results show that the scheme can effectively
capture the dynamic change of nodes. For example, if a node
behaves well for a long time and suddenly turns bad, the
proposed scheme rapidly increases the suspicious level of this
node. If it only behaves badly for a few times, the proposed
scheme allows slow recovery of its suspicious level.
The rest of paper is organized as follows. Section 2
describes the system model. Attack models and the proposed
scheme are presented in Section 3.InSection 4, simulation
results are demonstrated. Conclusion is drawn in Section 5.
2. System Model
Studies show that collaborative spectrum sensing can signif-
icantly improve the performance of primary user detection
[7, 8]. While most collaborative spectrum sensing schemes
assume that secondary users are trustworthy, it is possible
that attackers compromise cognitive radio nodes and make
them send false sensing information. In this section, we
describe the scenario of collaborative spectrum sensing and
present two attack models.
2.1. Collaborative Spectrum Sensing. In cognitive radio
networks, secondary users are allowed to opportunisti-
cally access available spectrum resources. Spectrum sensing
should be performed constantly to check vacant frequency
bands. For the detection based on energy level, spectrum
sensing performs the hypothesis test
y
i
=
⎧
⎨
⎩
n
i
, H
0
(
channelisidle
)
,
h
i
s + n
i
, H
1
channelisbusy
,
(1)
where y
i
is the sensed energy level at the ith secondary user, s
is the signal transmitted by the primary user, n
i
is the additive
white Gaussian noise (AWGN), and h
i
is the channel gain
from the primary transmitter to the ith secondary user.
We d en ot e by Y
i
the sensed energy for the ith cognitive
user in T time slots, γ
i
the received signal-to-noise ratio
EURASIP Journal on Advances in Signal Processing 3
(SNR), and TW the time-bandwidth product. According
to [7], Y
i
follows centralized χ
2
distribution under H
0
and
noncentralized χ
2
distribution under H
1
:
Y
i
∼
⎧
⎨
⎩
χ
2
2TW
, H
0
,
χ
2
2TW
2γ
i
, H
1
.
(2)
From (2), we can see that under H
0
the probability P(Y
i
=
y
i
| H
0
) depends on TW only. Under H
1
, P(Y
i
= y
i
| H
1
)
depends on TW and γ
i
. Recall that γ
i
is the received SNR of
secondary user i, which can be estimated according to path
loss model and location information.
By comparing y
i
with a threshold λ
i
, secondary user
makes a decision about whether the primary user is present.
As a result, the detection probability P
i
d
and false alarm
probability P
i
f
are given by
P
i
d
= P
y
i
>λ
i
| H
1
,(3)
P
i
f
= P
y
i
>λ
i
| H
0
,(4)
respectively.
Notice that (3)and(4) are detection rate and false rate
for single secondary user. In practice it is known that wireless
channels are subject to multipath fading or shadowing.
The performance of spectrum sensing degrades significantly
when secondary users experience fading or happen to
be shadowed [7, 8]. Collaborative sensing is proposed to
alleviate this problem. It combines sensing information of
several secondary users to make more accurate detection. For
example, considering collaborative spectrum sensing with N
secondary users. When OR-rule, that is, the detection result
of primary user is on if any secondary user reports on,is
the decision rule, the detection probability and false-alarm
probability for collaborative sensing are [7, 8]
Q
d
= 1 −
N
i=1
1 −P
i
d
,(5)
Q
f
= 1 −
N
i=1
1 −P
i
f
,(6)
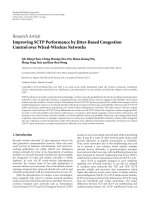
respectively. A scenario of collaborative spectrum sensing is
demonstrated in Figure 1. We can see that with OR rule,
decision center will miss detect the existence of primary user
only when all secondary users miss detect it.
2.2. Attack Model. The compromised secondary users can
report false sensing information to the decision center.
According to the way they send false sensing reports,
attackers can be classified into two categories: selfish users
and malicious users. The selfish users report yes or high
energy level when their sensed energy level is low. In this
way they intentionally cause false alarm such that they can
use the available spectrum and prevent others from using it.
The malicious users report no or low signal level when their
sensed energy is high. They will reduce the detection rate,
which yields more interference to the primary user. When
the primary user is not detected, the secondary users may
transmit in the occupied spectrum and interfere with the
transmission of the primary user. In this paper, we investigate
two attack models, False Alarm (FA) Attack and False Alarm
& Miss Detection (FAMD) Attack, as presented in [26, 27].
In energy spectrum sensing, secondary users send reports
to decision center in each round. Let X
n
(t) denote the
observation of node n about the existence of the primary user
at time slot t. The attacks are modeled by three parameters:
the attack threshold (η), attack strength (Δ), and attack
probability (P
a
). The two attack models are the following.
(i) False Alarm (FA) Attack: for time slot t, if sensed
energy X
n
(t) is higher than η, it will not attack in this round,
and just report X
n
(t); otherwise it will attack with probability
P
a
by reporting X
n
(t)+Δ. This type of attack intends to cause
false alarm.
(ii) False Alarm & Miss Detection (FAMD) Attack: for
time slot t, attacker will attack with probability P
a
.Ifitdoes
not choose to attack this round, it will just report X
n
(t);
otherwise it will compare X
n
(t)withη.IfX
n
(t) is higher
than η, the attacker reports X
n
(t) − Δ; Otherwise, it reports
X
n
(t)+Δ. This type of attack causes both false alarm and miss
detection.
3. Secure Collaborative Sensing
In this paper, we adopt the centralized collaborative sensing
scheme in which N cognitive radio nodes report to a
common decision center. Among these N cognitive radio
nodes, one or more secondary users might be compromised
by attackers. We first study the case when only one secondary
node is malicious. By calculating the suspicious level, we
propose a scheme to detect malicious user according to
their report histories. Then we extend the scheme to handle
multiple attackers. As we will discuss later, malicious users
can change their attack parameters to avoid being detected,
so the optimal attack strategy is also analyzed.
3.1. Single Malicious User Detection. In this section, we
assume that there is at most one malicious user. Define
π
n
(
t
)
P
(
T
n
= M | F
t
)
(7)
as the suspicious level of node n at time slot t,whereT
n
is the
type of node, which could be H(Honest) or M(Malicious),
and F
t
is observations collected from time slot 1 to time slot
t. By applying Bayesian criterion, we have
π
n
(
t
)
=
P
(
F
t
| T
n
= M
)
P
(
T
n
= M
)
N
j
=1
P
F
t
| T
j
= M
P
T
j
= M
.
(8)
Suppose that P(T
n
= M) = ρ for all nodes. Then, we have
π
n
(
t
)
=
P
(
F
t
| T
n
= M
)
N
j=1
P
F
t
| T
j
= M
.
(9)
4 EURASIP Journal on Advances in Signal Processing
It is easy to verify
P
(
F
t
| T
n
= M
)
=
t
τ=1
P
(
X
(
τ
)
| T
n
= M, F
τ−1
)
=
t
τ=1
⎡
⎣
N
j=1, j
/
=n
P
X
j
(
τ
)
| T
j
= H
⎤
⎦
P
(
X
n
(
τ
)
| F
τ−1
)
=
t
τ=1
ρ
n
(
τ
)
,
(10)
where
ρ
n
(
t
)
= P
(
X
n
(
t
)
| F
τ−1
)
N
j=1, j
/
=n
P
X
j
(
t
)
| T
j
= H
,
(11)
which represents the probability of reports at time slot t
conditioned that node n is malicious. Note that the first
equation in (10) is obtained by repeatedly applying the
following equation:
P
(
F
t
| T
n
= M
)
= P
(
X
(
t
)
| T
n
= M, F
t−1
)
P
(
F
t−1
| T
n
= M
)
.
(12)
Let p
B
and p
I
denote the observation probabilities under
busy and idle states, respectively, that is,
p
I
X
j
(
t
)
=
P
X
j
(
t
)
| S
(
t
)
= I
,
p
B
X
j
(
t
)
=
P
X
j
(
t
)
| S
(
t
)
= B
.
(13)
Note that calculation in (13) is based on the fact that the
sensed energy level follows centralized χ
2
distribution under
H
0
and noncentralized χ
2
distribution under H
1
[7]. The χ
2
distribution is stated in (2), in which the channel gain γ
i
should be estimated based on (i) the distance between the
primary transmitter and secondary users and (ii) the path
loss model. We assume that the primary transmitter (TV
tower, etc.) is stationary and the position of secondary users
can be estimated by existing positioning algorithms [28–32].
Of course, the estimated distance may not be accurate. In
Section 4.5, the impact of distance estimation error on the
proposed scheme will be investigated.
Therefore, the honest user report probability is given by
P
X
j
(
t
)
| T
j
= H
=
P
X
j
(
t
)
, S
(
t
)
B
| T
j
= H
+ P
X
j
(
t
)
, S
(
t
)
I
| T
j
= H
=
p
B
X
j
(
t
)
q
B
(
t
)
+ p
I
X
j
(
t
)
q
I
(
t
)
.
(14)
The malicious user report probability, P(X
n
(t) | F
t−1
),
depends on the attack model. When FA attack is adopted,
Primary user
Secondary user
Secondary user
Secondary user
Decision center
Task 1: Malicious secondary user?
Task 2: Primary user existing?
Figure 1: Collaborative spectrum sensing.
there are two cases that malicious user will report X
n
(t)in
round t. In the first case, X
n
(t) is the actual sensed result,
which means that X
n
(t) is greater than η. In the second case,
X
n
(t) is the actual sensed result plus Δ. So the actual sensed
energy is X
n
(t) − Δ and is less than η. In conclusion, the
malicious user report probability under FA is,
P
(
X
n
(
t
)
| F
t−1
)
= P
(
X
n
(
t
)
, S
(
t
)
B
| F
t−1
)
+ P
X
j
(
t
)
, S
(
t
)
I
| F
t−1
=
p
B
(
X
n
(
t
))
P
X
n
(
t
)
≥ η
q
B
(
t
)
+ p
B
(
X
n
(
t
)
−Δ
)
P
X
n
(
t
)
<η+ Δ
q
B
(
t
)
+ p
I
(
X
n
(
t
))
P
X
n
(
t
)
≥ η
q
I
(
t
)
+ p
I
(
X
n
(
t
)
−Δ
)
P
X
n
(
t
)
<η+ Δ
q
I
(
t
)
.
(15)
Similarly, when FAMD attack is adopted,
P
(
X
n
(
t
)
| F
t−1
)
= P
(
X
n
(
t
)
, S
(
t
)
B
| F
t−1
)
+ P
X
j
(
t
)
, S
(
t
)
I
| F
t−1
=
p
B
(
X
n
(
t
)
+ Δ
)
P
X
n
(
t
)
≥ η −Δ
q
B
(
t
)
+ p
B
(
X
n
(
t
)
−Δ
)
P
X
n
(
t
)
<η+ Δ
q
B
(
t
)
+ p
I
(
X
n
(
t
)
+ Δ
)
P
X
n
(
t
)
≥ η −Δ
q
I
(
t
)
+ p
I
(
X
n
(
t
)
−Δ
)
P
X
n
(
t
)
<η+ Δ
q
I
(
t
)
.
(16)
In (14)–(16), q
B
(t)andq
I
(t) are the priori probabilities
of whether the primary user is present or not, which can be
obtained through a two-state Markov chain channel model
[33]. The observation probabilities, p
B
(X
j
(t)), p
B
(X
n
(t) −
Δ), and other similar terms can be calculated by (13).
P(X
n
(t) ≥ η), P(X
n
(t) <η+ Δ), and similar terms, are
detection probabilities or false alarm probabilities, which can
be evaluated under specific path loss model [7, 8]. Therefore,
we can calculate the value of ρ
n
(t)in(11)aslongasΔ, η,
EURASIP Journal on Advances in Signal Processing 5
q
B
(t), q
I
(t), TW,andγ
i
are known or can be estimated.
In this derivation, we assume that the common receiver
has the knowledge of the attacker’s policy. This assumption
allows us to obtain the performance upper bound of the
proposed scheme and reveal insights of the attack/defense
strategies. In practice, the knowledge about the attacker’s
policy can be obtained by analyzing previous attacking
behaviors. For example, if attackers were detected previously,
one can analyze the reports from these attackers and identify
their attack behavior and parameters. Investigation on the
unknown attack strategies will be investigated in the future
work.
The computation of π
n
(t)isgivenby
π
n
(
t
)
=
t
τ
=1
ρ
n
(
τ
)
N
j=1
t
τ=1
ρ
j
(
τ
)
.
(17)
We convert suspicious level π
n
(t) into trust value φ
n
(t)as
φ
n
(
t
)
= 1 −π
n
(
t
)
.
(18)
Trust value is the measurement for honesty of secondary
users. But this value alone is not sufficient to determine
whether a node is malicious or not. In fact, we find that
trust values become unstable if there is no malicious user
at all. The reason is that above deduction is based on the
assumption that there is one and only one malicious user.
When there is no attacker, the trust values of honest users
become unstable. To solve this problem, we define trust
consistency value of user n (i.e., ψ
n
(t)) as
μ
n
(
t
)
=
⎧
⎪
⎪
⎪
⎪
⎨
⎪
⎪
⎪
⎪
⎩
t
τ=1
φ
n
(
t
)
t
, t<L
t
τ
=t−L+1
φ
n
(
t
)
L
, t
≥ L,
(19)
ψ
n
(
t
)
=
⎧
⎪
⎪
⎪
⎪
⎪
⎨
⎪
⎪
⎪
⎪
⎪
⎩
t
τ=1
φ
n
(
t
)
−μ
n
(
t
)
2
, t<L
t
τ=t−L+1
φ
n
(
t
)
−μ
n
(
t
)
2
, t ≥ L,
(20)
where L is the size of the window in which the variation
ofrecenttrustvaluesiscomparedwithoveralltrustvalue
variation.
Procedure 1 shows the process of by applying the trust
value φ
n
(t) and the consistency value ψ
n
(t)inprimaryuser
detection algorithm. The basic idea is to eliminate the reports
from users who have consistent low trust values. The value of
threshold
1
and threshold
2
can be chosen dynamically. This
procedure can be used together with many existing primary
user detection algorithms such as hard decision combing and
soft decision combing. The study in [23] has shown that
hard decision performs almost the same as soft decision in
terms of achieving performance gain when the cooperative
users (10–20) face independent fading. For simplicity, in this
paper, we will use the hard decision combining algorithm
in [7, 8] to demonstrate the performance of the proposed
scheme and other defense schemes.
(1) receive reports from N secondary users.
(2) calculate trust values and consistency values for all users.
(3) for each user n do
(4) if φ
n
(t) < threshold
1
and ψ
n
(t) < threshold
2
then
(5) the report from user n is removed
(6) end if
(7) end for
(8) perform primary user detection algorithm based on the
remaining reports.
Procedure 1: Primary user detection.
3.2. Multiple Malicious Users Detection. The detection of
single attacker is to find the node that has the largest
probability to be malicious. We can extend this method to
multiple attackers case. The idea is enumerating all possible
malicious nodes set and trying to identify the set with the
largest suspicious level. We call this method “ideal malicious
node detection.” However, as we will discuss later, this
method faces the curse of dimensionality when the number
of secondary users N is large. As a result, we propose a
heuristic scheme named “Onion-peeling approach” which is
applicable in practice.
3.2.1. Ideal Malicious Node Detection. For any Ω
⊂
{
1, , N} (note that Ω could be an empty set, i.e., there is
no attacker), we define
π
Ω
(
t
)
P
(
T
n
= M, ∀n ∈ Ω, T
m
= H, ∀m
/
∈Ω | F
t
)
,
(21)
as the belief that all nodes in Ω are malicious nodes while all
other nodes are honest.
Given any particular set of malicious nodes Θ,by
applying Bayesian criterion, we have
π
Ω
(
t
)
=
P
(
F
t
| Ω
)
P
(
Ω
)
Θ
P
(
F
t
| Θ
)
P
(
Θ
)
.
(22)
Suppose that P(T
n
= M) = ρ for all nodes. Then, we have
P
(
Ω
)
= ρ
|Ω|
1 −ρ
N−|Ω|
,
(23)
where
|Ω| is the cardinality of Ω.
Next, we can calculate
P
(
F
t
| Ω
)
=
t
τ=1
j
/
∈Ω
P
X
j
(
τ
)
| T
j
= H
j∈Ω
P
X
j
(
τ
)
| F, F
τ−1
=
t
τ=1
ρ
n
(
τ
)
,
(24)
where
ρ
n
(
t
)
=
j
/
∈Ω
P
X
j
(
τ
)
| T
j
= H
j∈Ω
P
X
j
(
τ
)
| F, F
τ−1
.
(25)
For each possible malicious node set Ω, using (22)–(25),
we can calculate the probability that this Ω contains only
6 EURASIP Journal on Advances in Signal Processing
malicious users and no honest users. And we can find the
Ω(t) with the largest π
Ω
(t) value. Then compare this π
Ω
(t)
with certain threshold, if it is beyond this threshold, the
nodes in Ω are considered to be malicious.
However, for a cognitive radio network with N secondary
users, there are 2
N
different choices of set Ω. Thus, the com-
plexity grows exponentially with N. So this ideal detection of
attackers faces the curse of dimensionality. When N is large,
we have to use approximation.
3.2.2. Onion-Peeling Approach. To make the detection of
multiple malicious nodes feasible in practice, we propose
a heuristic “onion-peeling approach” that detects the mali-
cious user set in a batch-by-batch way. Initially all nodes are
assumed to be honest. We calculate suspicious level of all
users according to their reports. When the suspicious level
of a node is beyond certain threshold, it will be considered
as malicious and moved into the malicious user set. Reports
from nodes in malicious user set are excluded in primary
user detection. And the way to calculate suspicious level is
updated once the malicious node set is updated. We continue
to calculate the suspicious level of remaining nodes until no
malicious node can be found.
In the beginning, we initialize the set of malicious nodes,
Ω, as an empty set. In the first stage, compute the a posteriori
probability of attacker for any node n, which is given by
π
n
(
t
)
= P
(
T
n
= M | F
t
)
=
P
(
F
t
| T
n
= M
)
P
(
T
n
= M
)
P
(
F
t
| T
n
= M
)
P
(
T
n
= M
)
+ P
(
F
t
| T
n
= H
)
P
(
T
n
= H
)
,
(26)
where we assume that all other nodes are honest when
computing P(F
t
| T
n
= M)andP(F
t
| T
n
= H). In (26)we
only calculate the suspicious level for each node rather than
that of a malicious nodes set, the computation complexity is
reduced from O(2
N
)toO(N).
Recall that X(t) denote the collection of X
n
(t), that is,
reports from all secondary nodes at time slot t.Itiseasyto
verify
P
(
F
t
| T
n
= M
)
=
t
τ=1
P
(
X
(
τ
)
| T
n
= M, F
τ−1
)
=
t
τ=1
⎡
⎣
N
j=1,j
/
=n
P
X
j
(
τ
)
| T
j
= H
⎤
⎦
P
(
X
n
(
τ
)
| F
τ−1
)
=
t
τ=1
ρ
n
(
τ
)
,
(27)
where
ρ
n
(
t
)
= P
(
X
n
(
t
)
| F
τ−1
)
N
j=1, j
/
=n
P
X
j
(
t
)
| T
j
= H
.
(28)
Here, P(F
t
| T
n
= M) means the probability of reports at
time slot t conditioned that node n is malicious. Note that
the first equation in (27) is obtained by repeatedly applying
(12).
Similarly, we can calculate P(F
t
| T
n
= H)by
P
(
F
t
| T
n
= H
)
=
t
τ=1
P
(
X
(
τ
)
| T
n
= H, F
τ−1
)
=
t
τ=1
⎡
⎣
N
j=1
P
X
j
(
τ
)
| T
j
= H
⎤
⎦
=
t
τ=1
θ
n
(
τ
)
,
(29)
where
θ
n
(
t
)
=
N
j=1
P
X
j
(
t
)
| T
j
= H
.
(30)
As mentioned before, q
B
(t)andq
I
(t) are the priori
probabilities of whether the primary user exists or not,
p
B
(X
j
(t)) and p
I
(X
j
(t)) are the observation probabilities of
X
j
(t) under busy and idle states. An honest user’s report
probability can be calculated by (14).
Then for each reporting round, we can update each
node’s suspicious level based on above equations. We set a
threshold ξ and consider n
1
as a malicious node when n
1
is
the first node such that
P
T
n
1
= M | F
t
≥
threshold
3
.
(31)
Then, add n
1
into Ω.
Through (26)–(31), we have shown how to detect the
first malicious node. In the kth stage, we compute the a
posteriori probability of attacker in the same manner of (26).
The only difference is that when computing P(F
t
| T
n
= M)
and P(F
t
| T
n
= H), we assume that all nodes in Ω are
malicious. Equations (28)and(30)nowbecome(32)and
(33), respectively, and they can be seen as the special cases
of (32)and(33) when Ω is empty.
ρ
n
(
t
)
= P
(
X
n
(
t
)
| F
τ−1
)
×
⎛
⎝
N
j=1,j
/
=n,j
/
∈Ω
P
X
j
(
t
)
| T
j
= H
·
N
j=1,j
/
=n,j∈Ω
P
X
j
(
t
)
| T
j
= M
⎞
⎠
,
(32)
θ
n
(
t
)
=
⎛
⎝
N
j=1,j
/
∈Ω
P
X
j
(
t
)
| T
j
= H
·
N
j=1,j∈Ω
P
X
j
(
t
)
| T
j
= M
⎞
⎠
(33)
EURASIP Journal on Advances in Signal Processing 7
(1) initialize the set of malicious nodes.
(2) collect reports from N secondary users.
(3) calculate suspicious level for all users.
(4) for each user n do
(5) if π
n
(t) >= threshold
3
then
(6) move node n to malicious nodes set, the report
from user n is removed
(7) exit loop
(8 ) end if
(9) end for
(10) perform primary user detection algorithm based
nodes that are currently assumed to be honest.
(11) go to step 2 and repeat the procedure
Procedure 2: Primary user detection.
Add n
k
to Ω when n
k
is the first node (not in Ω) such that
P
T
n
k
= M | F
t
≥
threshold
3
.
(34)
Repeat the procedure until no new malicious node can be
found.
Based on the above discussion, the primary user detec-
tion process is shown in Procedure 2. The basic idea is to
exclude the reports from users who have suspicious level
higher than threshold. In this procedure, threshold
3
can be
chosen dynamically. This procedure can be used together
with many existing primary user detection algorithms. As
discussed in Section 3.1, hard decision performs almost the
same as soft decision in terms of achieving performance gain
when the cooperative users (10–20) face independent fading.
So for simplicity, we still use the hard decision combining
algorithm in [7, 8] to demonstrate the performance of the
proposed scheme.
3.3. Optimal Attack. As presented in Section 2.2, the attack
model in this paper has three parameters: the attack thresh-
old (η), attack strength (Δ), and attack probability (P
a
).
These parameters determine the power and covertness of the
attack. Here, the power of attack can be described by the
probability that the attack is successful (i.e., causing false
alarm and/or miss detection). The covertness of the attack
can be roughly described by the likelihood that the attack will
not be detected.
Briefly speaking, when η or P
a
increases, the attack
happens more frequently. When Δ increases, the attack goal
is easier to achieve. Thus, the power of attack increases with
η, P
a
,andΔ. On the other hand, when the attack power
increases, the covertness reduces. Therefore, there is the
tradeoff between attack power and covertness.
The attacker surely prefers maximum attack power and
maximum covertness. Of course, these two goals cannot
be achieve simultaneously. Then, what is the “best” way
to choose attack parameters from the attacker’s point of
view? In this section, we define a metric called damage that
considers the tradeoff between attack power and covertness,
and find the attack parameters that maximize the damage. To
simplify the problem, we only consider one attacker case in
this study.
We first make the following arguments.
(i) The attacker can damage the system if it achieves
the attack goal and is not detected by the defense
scheme. Thus, the total damage can be described by
the number of successful attacks before the attacker is
detected.
(ii) Through experiments, we found that the defense
scheme cannot detect some conservative attackers,
who use very small η, Δ,andP
a
values. It can be
proved that all possible values of
{η, Δ, P
a
} that will
not trigger the detector form a continuous 3D region,
referred to as the undetectable region.
(iii) Thus, maximizing the total damage is equivalent to
finding attack parameters in the undetectable region
that maximize the probability of successful attack.
Based on the above arguments, we define damage D as
the probability that the attacker achieves the attack goal (i.e.,
causing false alarm) in one round of collaborative sensing.
Without loss of generality, we only consider FA attack in this
section. In FA attack, when sensed energy y is below attack
threshold η, the attacker will report Δ+ y with probability P
a
.
When Δ + y is greater than the decision threshold λ and the
primary user does not present, the attacker causes false alarm
and the attack is successful. Thus, the damage D is calculated
as:
D
= P
a
P
y<η
P
y + Δ ≥ λ | y<η
=
P
a
P
I
P
y<η| H
0
P
y + Δ ≥ λ | H
0
, y<η
+
P
B
P
y<η| H
1
P
y + Δ ≥ λ | H
1
, y<η
,
(35)
where
P
I
is the priori probability that channel is idle and
P
B
is the priori probability that channel is busy.
From the definition of P
d
and P
f
in (3)and(4), we have,
P
y<η| H
0
=
1 −P
f
η
,
(36)
P
y<η| H
1
= 1 −P
d
η
.
(37)
Similarly,
P
y + Δ ≥ λ | H
0
, y<η
= P
λ −Δ ≤ y<η| H
0
=
P
f
(
λ
−Δ
)
−P
f
η
,
(38)
P
y + Δ ≥ λ | H
1
, y<η
= P
λ −Δ ≤ y<η| H
1
=
P
d
(
λ
−Δ
)
−P
d
η
,
(39)
Substitute (36)–(39)to(35), then we have
D
= P
a
P
I
1 −P
f
η
P
f
(
λ
−Δ
)
−P
f
η
+
P
B
1 −P
d
η
P
d
(
λ
−Δ
)
−P
d
η
.
(40)
8 EURASIP Journal on Advances in Signal Processing
Table 1: False Alarm Rate (when detection rate = 0.99).
OR Ki Proposed Proposed
Rule Rule (t
= 250) (t = 500)
FA, P
a
= 1 0.72 0.13 0.07 0.05
FA, P
a
= 0.5 0.36 0.07 0.06 0.04
FAMD, P
a
= 1 0.74 0.20 0.08 0.05
FAMD, P
a
= 0.5 0.37 0.10 0.06 0.04
Under the attack models presented in this paper, the attacker
should choose the attack parameters that maximize D and
are in the undetectable region.
Finding optimal attack has two purposes. First, with the
strongest attack (in our framework), we can evaluate the
worst-case performance of the proposed scheme. Second, it
reveals insights of the attack strategies. Since it is extremely
difficult to obtain the close form solution of the undetectable
region, we will find undetectable region through simulations
and search for optimal attack parameters using numerical
methods. Details will be presented in Section 4.4.
4. Simulation Results
We simulate a cognitive radio network with N(=10) sec-
ondary users. Cognitive radio nodes are randomly located
around the primary user. The minimum distance from them
to primary transmitter is 1000 m and maximum distance
is 2000 m. The time-bandwidth product [7, 8]ism
= 5.
Primary transmission power and noise level are 200 mw and
−110 dBm, respectively. The path loss factor is 3 and Rayleigh
fading is assumed. Channel gains are updated based on
node’s location for each sensing report. The attack threshold
is η
= 15, the attack strength is Δ = 15, and the attack
probability P
a
is 100% or 50%. We conduct simulations
for different choices of thresholds. Briefly speaking, if trust
value threshold threshold
1
is set too high or suspicious level
threshold threshold
3
is set too low, it is possible that honest
nodes will be regarded as malicious. If trust consistency value
threshold
2
is set too low, it will take more rounds to detect
malicious users. In simulation, for single malicious node
detection, we choose the trust value threshold threshold
1
=
0.01, the consistency value threshold threshold
2
= 0.1, and
the window size for calculating consistency value is L
= 10.
For multiple malicious users detection, the suspicious level
threshold threshold
3
is set to 0.99.
4.1. Single Attacker. Three schemes of primary user detection
are compared.
(i) OR Rule: the presence of primary user is detected
if one or more secondary users’ reported value is
greater than certain threshold. This is the most
commonhardfusionscheme.
(ii) Ki Rule: the presence of primary user is detected if i or
more secondary users’ reported value is greater than
certain threshold. This is the straightforward defense
scheme proposed in [23].
(iii) Proposed Scheme: Use OR rule after removing
reports from malicious nodes.
P
a
= 100%, FA attack
0.975
0.98
0.985
0.99
0.995
1
Prob. of detection
00.10.20.30.40.50.60.70.80.9
Prob. of false alarm
No attacker, N
= 10, OR
No attacker, N
= 9, OR
One attacker, N
= 10, OR
One attacker, N
= 10, K2
Proposed scheme, t
= 250
Proposed scheme, t
= 500
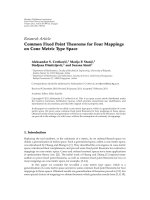
Figure 2: ROC curves for different collaborative sensing schemes
(P
a
= 100%, False Alarm Attack).
Performance of these schemes are shown by Receiver
Operating Characteristic (ROC) curves, which is a plot of
the true positive rate versus the false positive rates as its
discrimination threshold is varied. Figures 2–5 show ROC
curves for primary user detection in 6 cases when only one
secondary user is malicious. Case 1 is for OR rule with N
honest users. Case 2 is for OR rule with N
− 1 honest users.
In Case 3–6, there are N
−1 honest users and one malicious
user. Case 3 is for OR rule. Case 4 is for K2 rule. Case 5 is
for the proposed scheme with t
= 250, where t is the index
of detection rounds. Case 6 is for the proposed scheme with
t
= 500.
When the attack strategy is the FA Attack, Figures 2
and 3 show the ROC curves when the attack probability is
100% and 50%, respectively. The following observations are
made.
(i) By comparing the ROC for Case 1 and Case 3, we
see that the performance of primary user detection degrades
significantly even when there is only one malicious user.
This demonstrates the vulnerability of collaborative sensing,
which leads inefficient usage of available spectrum resource.
(ii) The proposed scheme demonstrates significant per-
formance gain over the scheme without defense (i.e., OR
rule) and the straightforward defense scheme (i.e., K2 rule).
For example, Ta bl e 1 shows the false alarm rate (P
f
)for
two given detection rate (P
d
), when attack probability (P
a
)
is 1. When the attack probability is 0.5, the performance
advantage is smaller but still large.
(iii) In addition, as t increases, the performance of the
proposed scheme gets close to the performance of Case 2,
which represents perfect detection of the malicious nodes.
EURASIP Journal on Advances in Signal Processing 9
P
a
= 50%, FA attack
0.975
0.98
0.985
0.99
0.995
1
Prob. of detection
00.10.20.30.40.50.60.70.80.9
Prob. of false alarm
No attacker, N
= 10, OR
No attacker, N
= 9, OR
One attacker, N
= 10, OR
One attacker, N
= 10, K2
Proposed scheme, t
= 250
Proposed scheme, t
= 500
Figure 3: ROC curves for different collaborative sensing schemes
(P
a
= 50%, False Alarm Attack).
4.2. Multiple Attackers. Figures 6–9 are the ROC curves for
six cases when there are multiple attackers. Similarly, Case 1
is N honest users, no malicious node, and OR rule. Case 2
is N
− 2(orN −3) honest users, no attacker, and OR rule.
Case 3–6 are N
− 2(orN − 3) honest users and 2 (or 3)
malicious users. OR rule is used in Case 3 and Ki rule is used
in case 4. Case 5 and Case 6 are with the proposed scheme
with different detection rounds. Case 5 is the performance
evaluated at round t
= 500 and Case 6 is at round t = 1000.
When the attack strategy is the FA Attack, Figures 6 and
7 show the ROC curves when the attacker number is 2 and 3,
respectively. We still compare the three schemes described in
Section 4.1. Similarly, following observations are made.
(i) By comparing the ROC curves for Case 1 and Case 3,
we see that the performance of primary user detec-
tion degrades significantly when there are multiple
malicious users. And the degradation is much more
severe than single malicious user case.
(ii) The proposed scheme demonstrates significant per-
formance gain over the scheme without defense (i.e.,
OR rule) and the straightforward defense scheme
(i.e., Ki rule). Ta b le 2 shows the false alarm rate (P
f
)
when detection rate is P
d
= 99%.
(iii) When there are three attackers, false alarm rates
for all these schemes become larger, but the perfor-
mance advantage of the proposed scheme over other
schemes is still large.
(iv) In addition, as t increases, the performance of the
proposed scheme becomes close to the performance
of Case 2, which is the performance upper bound.
P
a
= 100%, FAMD attack
0.975
0.98
0.985
0.99
0.995
1
Prob. of detection
00.10.20.30.40.50.60.70.80.9
Prob. of false alarm
No attacker, N
= 10, OR
No attacker, N
= 9, OR
One attacker, N
= 10, OR
One attacker, N
= 10, K2
Proposed scheme, t
= 250
Proposed scheme, t
= 500
Figure 4: ROC curves for different collaborative sensing schemes
(P
a
= 100%, False Alarm & Miss Detection Attack).
Table 2: False Alarm Rate (when detection rate
= 0.99).
OR Ki Proposed Proposed
Rule Rule (t
= 500) (t = 1000)
FA, 2 Attackers 0.85 0.23 0.10 0.08
FA, 3 Attackers 0.88 0.41 0.22 0.16
FAMD, 2 Attackers 0.88 0.31 0.15 0.09
FAMD, 3 Attackers 0.89 0.50 0.26 0.16
Figures 4 and 5 show the ROC performance when the
malicious user adopts the FAMD attack. We observe that the
FAMD attack is stronger than FA. In other words, the OR rule
and K2 rule have worse performance when facing the FAMD
attack. However, the performance of the proposed scheme is
almost the same under both attacks. That is, the proposed
scheme is highly effective under both attacks, and much
better than the traditional OR rule and the simple defense
K2 rule. The example false alarm rates are listed as follows.
Figures 8 and 9 shows the ROC performance when the
schemes face the FAMD attack for multiple malicious users.
We observe that the FAMD attack is stronger than FA.
Compared to the cases with FA attack, performance of the
OR rule and Ki rule is worse when facing the FAMD attack.
However, the performance of the proposed scheme is almost
the same under both attacks. That is, the proposed scheme
is highly effective under both attacks, and much better than
the traditional OR rule and the simple defense Ki rule. The
examples of false alarm rate are listed in Tab le 1 .
4.3. Dynamic Behaviors. We also analyze the dynamic
change in behavior of malicious nodes for FAMD attack.
10 EURASIP Journal on Advances in Signal Processing
P
a
= 50%, FAMD attack
0.975
0.98
0.985
0.99
0.995
1
Prob. of detection
00.10.20.30.40.50.60.70.80.9
Prob. of false alarm
No attacker, N
= 10, OR
No attacker, N
= 9, OR
One attacker, N
= 10, OR
One attacker, N
= 10, K2
Proposed scheme, t
= 250
Proposed scheme, t
= 500
Figure 5: ROC curves for different collaborative sensing schemes
(P
a
= 50%, False Alarm & Miss Detection Attack).
Two attackers, FA attack
0.97
0.975
0.98
0.985
0.99
0.995
1
Prob. of detection
0.10.20.30.40.50.60.70.80.91
Prob. of false alarm
No attacker, N
= 10, OR
No attacker, N
= 8, OR
Two attackers, N
= 10, OR
Two attackers, N
= 10, K3
Proposed scheme, t
= 500
Proposed scheme, t
= 1000
Figure 6: ROC curves (False Alarm Attack, Two Attackers).
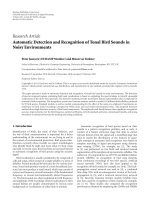
Figures 10 and 11 are for single malicious user. In Figure 10,
the malicious user changes the attack probability from 0 to 1
at t
= 50andfrom1to0attimet = 90. The dynamic change
of trust value can be divided into three intervals. In Interval
1, t
∈ [0, 50], malicious user does not attack. The trust value
of malicious user and honest user are not stable since there
Three attackers, FA attack
0.97
0.975
0.98
0.985
0.99
0.995
1
Prob. of detection
0.10.20.30.40.50.60.70.80.91
Prob. of false alarm
No attacker, N
= 10, OR
No attacker, N
= 7, OR
Three attackers, N
= 10, OR
Three attackers, N
= 10, K4
Proposed scheme, t
= 500
Proposed scheme, t
= 1000
Figure 7: ROC curves (False Alarm Attack, Three Attackers).
Two attackers, FAMD attack
0.97
0.975
0.98
0.985
0.99
0.995
1
Prob. of detection
0.10.20.30.40.50.60.70.80.91
Prob. of false alarm
No attacker, N
= 10, OR
No attacker, N
= 8, OR
Two attackers, N
= 10, OR
Two attackers, N
= 10, K3
Proposed scheme, t
= 500
Proposed scheme, t
= 1000
Figure 8: ROC curves (False Alarm & Miss Detection Attack, Two
Attackers).
is no attacker. Note that the algorithm will not declare any
malicious nodes because the trust consistency levels are high.
In Interval 2, t
∈ [50, 65], malicious user starts to attack, and
its trust value quickly drops when it turns from good to bad.
In Interval 3, where t>60, the trust value of malicious user is
consistently low. In Figure 11, one user behaves badly in only
EURASIP Journal on Advances in Signal Processing 11
Three attackers, FAMD attack
0.97
0.975
0.98
0.985
0.99
0.995
1
Prob. of detection
0.10.20.30.40.50.60.70.80.91
Prob. of false alarm
No attacker, N
= 10, OR
No attacker, N
= 7, OR
Three attackers, N
= 10, OR
Three attackers, N
= 10, K4
Proposed scheme, t
= 500
Proposed scheme, t
= 1000
Figure 9: ROC curves (False Alarm & Miss Detection Attack, Three
Attackers).
0
0.1
0.2
0.3
0.4
0.5
0.6
0.7
0.8
0.9
1
Trust value
0 50 100 150 200
Detection round
Interval 3Interval 2Interval 1
Malicious node
Figure 10: Dynamic trust value in proposed scheme (a user attacks
during time [50, 90], P
a
= 1).
5 rounds starting at t = 50. We can have similar observations.
In Interval 1, malicious user does not attack. It has high trust
value. Please note that these dynamic figures are just snap
shots of trust values. In Figure 11, the trust value in Region
1 does not fluctuate as frequently as that in Figure 10. This
is also normal. The reason for unstable trust value may due
to channel variation or unintentional errors. In Interval 2,
t
∈ [50, 55], malicious user starts to attack, its trust value
drops quickly. In Interval 3, where t>55, trust value of
malicious user recovers very slowly.
Similarly, we also make observations for dynamic change
in behaviors for multiple attackers. Suspicious level of honest
0.6
0.65
0.7
0.75
0.8
0.85
0.9
0.95
1
Trust value
50 100 150 200 250 300
Detection round
Interval 3Interval 2Interval 1
Malicious node
Honest nodes
Figure 11:Dynamictrustvalueinproposedscheme(auserattacks
during time [50, 55], P
a
= 1).
0
0.1
0.2
0.3
0.4
0.5
0.6
0.7
0.8
0.9
1
Suspicious level
0 20 40 60 80 100
Detection round
Malicious node 1
Malicious node 2
Honest node
Figure 12: Dynamic suspicious level in proposed scheme (two
malicious nodes perform FA attack during time [20, 100]).
users and malicious users are shown in Figures 12 and 13.
Please note that we only demonstrate suspicious level curve
for one honest node. The malicious user adopts the FA attack
and dynamically chooses which round to start attack and
which round to stop attack. In Figure 12, the malicious users
start to attack at t
= 20andstoptoattackattimet =
100. In Figure 13, one user behaves badly in only 10 rounds
starting at t
= 5. Similar observations can be made. We
can see that the suspicious level of malicious nodes increases
steadily when nodes turn from good to bad. And the scheme
allows slow recovery of suspicious level for occasional bad
behavior.
12 EURASIP Journal on Advances in Signal Processing
0
0.1
0.2
0.3
0.4
0.5
0.6
0.7
0.8
0.9
1
Suspicious level
0 20 40 60 80 100
Detection round
Malicious node 1
Malicious node 2
Honest node
Figure 13: Dynamic suspicious level in proposed scheme (two
malicious nodes perform FA attack during time [5, 15]).
4.4. Optimal Attack. As discussed in Section 3.3, given the
defense scheme, the attacker can find the optimal attack
parameters that maximize the damage. In this set of exper-
iments, we find the optimal attack parameters and evaluate
the worst performance of the proposed scheme.
We assume that there are N
= 10 cognitive radio
nodes performing collaborative sensing. We set the decision
threshold λ so that the overall detection rate P
d
is 99% when
all users are honest. When OR rule is used, λ
= 28 leads to P
d
= 99%.
Obviously, the practical values of η and Δ cannot be over
certain range. Within the range, for each pair of (η, Δ), we
run simulations to identify the maximum attack probability
P
a
that the attacker can use and avoid being detected. In
particular, binary search is used to find the maximum P
a
.
We first try an initial P
a
, which is usually the P
a
value of
a neighbor pair. For example, if we already obtain the P
a
for pair (η − 1, Δ) through simulation, then normally the
maximum P
a
for pair (η, Δ) is a little bit smaller than that
of pair (η
− 1, Δ). Then, we run the simulation for 2000
rounds. If the attacker is not detected within 2000 rounds,
we will search the middle value of range (P
a
, 1), otherwise we
search the middle value of range (0, P
a
).Thesearchcontinues
until the maximum P
a
is found. Then, the boundary of
undetectable region is determined. We would like to point
out that there exists more computational efficient ways to
search for the undetectable region, which can be exploited
in the future work.
Figure 14 shows the undetectable region when N
=
10 and other simulation parameters are the same as these
in Section 4.TheX-axis and Y-axis are attack threshold
η and attack strength Δ,respectively,andZ-axis is attack
probability P
a
. The following observations are made. When
η and Δ are small, P
a
can be as large as 100%. This is easy to
understand. If η is small, the probability that sensed energy
25
20
15
10
5
0
Attack threshold
00
5
10
15
20
25
Attack strength
1
0.5
Attack probability
Figure 14: Region that detection is impossible.
is below η is small. If Δ is small, the reporting values are just
a little higher than true sensed values. Thus, when both η
and Δ are small, the behavior of malicious node is not very
different from that of honest nodes. Each attack is very weak
and the attacker can do more attacks (i.e., larger P
a
) without
triggering the detector. As η or Δ increases, the maximum
allowed attack probability P
a
decreases. When both η and Δ
are large, P
a
should be very small (0–5%).
According to (40), we know that the maximum damage
will occur at the boundary of the undetectable region. Using
(40), we can find the point (i.e., attack parameters) that
maximizes the damage in the undetectable region. In this
experiment, the optimal attack parameters are η
= 16, Δ =
23, and P
a
= 0.05, the maximum damage is 0.02.
We also plot the damage in Figure 15.TheX-axis and
Y-axis are η and Δ,respectively,andZ-axisisdamageD.
The damage value is calculated for the boundary points
of the undetectable region. We do not show the P
a
value
because each (η, Δ) pair corresponds to one P
a
value on the
boundary. From this figure, we can see that when η and Δ are
low, the damage is 0. The attacker can cause larger damage by
choosing relatively large η and Δ values and small P
a
values.
With the optimal attack parameters, for decision thresh-
old λ
= 28, the overall false alarm rate will increase
from 1% to 3%. Recall that the decision threshold was
determined to ensure 99% detection rate. This is the worst-
case performance of the proposed scheme. Please note that
this is the worst case when the attackers are undetectable.
When malicious users can be detected, as discussed in
Section 4.1, the performance will get close to upper bound
(the performance of N
−1 honest nodes) as detection round
t increases.
ForK2rulewithN
= 10 secondary users, to maintain
overall detection rate P
d
being 99%, the decision threshold
λ should be decreased to 22. Because K2 rule does not
try to detect malicious users, attacker has no risk of being
detected even they launch the strongest attack. For our
attack model, they can set attack probability P
a
to 1, and
set attack threshold η and attack strength Δ as large as
possible. For K2 rule, when two or more secondary users
report on, the decision result is on. The attacker can launch
EURASIP Journal on Advances in Signal Processing 13
0.02
0.01
0
Attack threshold
25
20
15
10
5
0
Attack strength
0
5
10
15
20
25
Attack probability
Figure 15: Damage in region.
0
50
100
150
200
250
Average number of rounds to
detect malicious node
012345
Normalised position estimation error
FA attack
FAMD attack
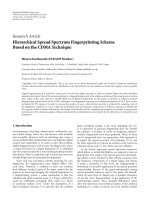
Figure 16: Impact of Position Estimation Error.
the strongest attack which is similar to report on in hard-
decision reporting case. But only when another one or more
honest nodes also make false alarm, the attacker can mislead
the decision center. So the overall false alarm rate is not 1.
In the simulation, we set P
a
to 1, η and Δ both to 1000.
The overall false alarm rate is 17.5% for K2 rule under these
settings, which is much larger than the worst case of the
proposed scheme. For OR rule, the overall false alarm rate is
1. This result is summarized in Table 3 . In this table, the ideal
case means all N secondary users are honest, and other three
columnsaretheworseperformancefordifferent schemes
when one of the N cognitive radio nodes is malicious.
Finally, we would like to point out that the optimal
attack is only optimal under certain attack model and certain
defense scheme. The method of finding the optimal attack
can be extended to study other attack models. We believe
the proposed scheme will still work very well under many
other attack models, since the attacker’s basic philosophies
are similar.
Table 3: False Alarm Rate (when detection rate = 0.99).
Ideal Case Proposed Scheme Ki Rule OR Rule
0.01 0.03 0.175 1
4.5. Impact of Position Estimation Error upon Performance.
Recall that the proposed scheme needs to know the channel
gains that are estimated based on the position of secondary
nodes. There are many existing schemes that estimate the
location of wireless devices in sensor networks [27–31].
These schemes can be classified into two categories: range
based and range free. The range based methods first estimate
the distances between pairs of wireless nodes and then
calculate the position of individual nodes. Examples of range
based schemes are Angle of Arrival (AoA) [28], Received
Signal Strength Indicator (RSSI) [29], Time of Arrival (ToA)
[30], and Time Difference of Arrival (TDoA) [31]. The range
free methods usually use connectivity information to identify
the beacon nodes within radio range and then estimate the
absolute position of non-beacon nodes [32].
The performance of these schemes are measured by the
location estimate error, which is usually normalized to the
units of node radio transmission range (R). Most current
algorithms can achieve the accuracy that the estimation error
is less than one unit of radio transmission range [28–32].
In this section, we study the impact of position estima-
tion error on the proposed scheme. The simulation settings
are mostly the same as the settings in previous experiments.
We choose the decision threshold λ
= 28 to ensure the overall
detection rate P
d
be 99% when there are no malicious nodes.
The radio transmission range is set to 50m, which is a typical
value for wireless sensor nodes. Both FA attack and FAMD
attack with single attacker are simulated.
The proposed scheme needs a certain number of rounds
to detect the malicious users. When the positions of sec-
ondary users are not accurate, it can be envisioned that the
number of rounds needed to detect the malicious user will
increase. In Figure 16, the horizontal axis is the normalized
position estimation error, and the veridical axis is the
averaged number of rounds needed to detect the malicious
node. In particular, when the normalized position estimation
error value is e and the actual distance between primary
transmitter and secondary user i is r
i
, we simulate the case
that the estimated distance between the secondary users
and the primary transmitter is Gaussian distributed with
mean being r
i
and variance being (eR)
2
.FromFigure 16, the
following observations are made.
(i) The average number of rounds to detect malicious
node is very stable when the position estimation error
is within 4 units of radio range. Recall that most
positioning estimate algorithms have the estimation
error around 1 unit of radio range. Thus, the
performance of the proposed scheme is stable given
realistic positioning estimation errors.
(ii) When estimation error goes beyond 4 units of radio
range, it would take much more rounds to detect the
malicious node.
14 EURASIP Journal on Advances in Signal Processing
(iii) The position estimation error has similar impact on
the FA attack and the FAMD attack.
In conclusion, the performance of the proposed scheme
is not sensitive to the position estimate error as long as it
is within a reasonable range. This reasonable range can be
achieved by existing positioning algorithms.
5. Conclusions
Untrustworthy secondary users can significantly degrade the
performance of collaborative spectrum sensing. We propose
two attack models, FA attack and FAMD attack. The first
attack intends to cause false alarm and the second attack
causes both false alarm and miss detection. To deal with these
attacks, we first propose a defense scheme to detect single
malicious user. The basic idea is to calculate the trust value
of all secondary nodes based on their reports. Only reports
from nodes that have consistent high trust value will be used
in primary user detection. Then we extend the method for
single attacker to multiple attacker case. This defense scheme
uses an onion-peeling approach and does not need prior
knowledge about the attacker number. Finally, we define the
damage metric and investigate the attack parameters that
maximize the damage.
Comprehensive simulations are conducted to study the
ROC curves and suspicious level dynamics for different
attack models, attacker numbers and different collaborative
sensing schemes. The proposed schemes demonstrate sig-
nificant performance advantage. For example, when there
are 10 secondary users, with the primary user detection rate
equals to 0.99, one malicious user can make the false alarm
rate (P
f
) increases to 72%. Whereas the K2 rule defense
scheme can reduce P
f
to 13%, the proposed scheme reduces
P
f
to 5%. Two malicious users can make the false alarm
rate (P
f
) increases to 85%. Whereas the K3 defense scheme
can reduce P
f
to 23%, the proposed scheme reduces P
f
to
8%. Furthermore, when a good user suddenly turns bad,
the proposed scheme can quickly increase the suspicious
level of this user. If this user only behaves badly for a few
times, its suspicious level can recover after a large number
of good behaviors. For single attacker case, we find optimal
attack parameters for the proposed scheme. When facing the
optimal attack, the proposed scheme yield 3% false alarm
rate, with 99% detection rate. On the other hand, when the
K2 rule scheme faces the strongest attack against the K2 rule,
the false alarm rate can be 17.5% with 99% detection rate.
With the proposed scheme, the impact from malicious users
is greatly reduced even if the attacker adopts optimal attack
parameters and remains undetected.
Acknowledgment
This work is supported by CNS-0905556, NSF Award no.
0910461, no. 0831315, no. 0831451 and no. 0901425.
References
[1] J. Mitola III and G. Q. Maguire Jr., “Cognitive radio: making
software radios more personal,” IEEE Personal Communica-
tions, vol. 6, no. 4, pp. 13–18, 1999.
[2] S. Haykin, “Cognitive radio: brain-empowered wireless com-
munications,” IEEE Journal on Selected Areas in Communica-
tions, vol. 23, no. 2, pp. 201–220, 2005.
[3] E. Hossain, D. Niyato, and Z. Han, Dynamic Spectrum Access
in Cognitive Radio Networks, Cambridge University Press,
Cambridge, UK, 2008.
[4] D. Cabric, S. M. Mishra, and R. W. Brodersen, “Implemen-
tation issues in spectrum sensing for cognitive radios,” in
Proceedings of the 38th Asilomar Conference on Signals, Systems
and Computers (ACSSC ’04), pp. 772–776, Pacific Grove, Calif,
USA, November 2004.
[5] H. Urkowitz, “Energy detection of unknown deterministic
signals,” Proceedings of the IEEE, vol. 55, no. 4, pp. 523–531,
1967.
[6] D. Cabric, A. Tkachenko, and R. W. Brodersen, “Experimental
study of spectrum sensing based on energy detection and net-
work cooperation,” in Proceedings of the 1st ACM International
Workshop on Technolog y and Policy for Accessing Spectrum
(TAPAS ’06), Pacific Grove, Calif, USA, August 2006.
[7] A.GhasemiandE.S.Sousa,“Collaborativespectrumsensing
for opportunistic access in fading environments,” in Proceed-
ings of the 1st IEEE International Symposium on New Frontiers
in Dynamic Spectrum Access Networks (DySPAN ’05), pp. 131–
136, November 2005.
[8] A. Ghasemi and E. S. Sousa, “Opportunistic spectrum access
in fading channels through collaborative sensing,” Journal of
Communications, vol. 2, no. 2, pp. 71–82, 2007.
[9] A. Ghasemi and E. S. Sousa, “Spectrum sensing in cognitive
radio networks: the cooperation-processing tradeoff,” Wireless
Communications and Mobile Computing, vol. 7, no. 9, pp.
1049–1060, 2007.
[10] K. B. Letaief and W. Zhang, “Cooperative spectrum sensing,”
in Cognitive Wireless Communication Networks, Springer, New
York, NY, USA, 2007.
[11] Z. Han and K. J. R. Liu, Resource Allocation for Wireless
Networks: Basics, Techniques, and Applications, Cambridge
University Press, Cambridge, UK, 2008.
[12]E.Visotsky,S.Kuffher, and R. Peterson, “On collaborative
detection of TV transmissions in support of dynamic spec-
trum sharing,” in Proceedings of the 1st IEEE International
Symposium on New Frontiers in Dynamic Spectrum Access
Networks (DySPAN ’05), pp. 338–345, Baltimore, Md, USA,
November 2005.
[13] G. Ganesan and Y. Li, “Agility improvement through cooper-
ative diversity in cognitive radio,” in Proceedings of the IEEE
Global Communications Conference (GLOBECOM ’05),pp.
2505–2509, St. Louis, Mo, USA, November 2005.
[14] G. Ganesan and Y. Li, “Cooperative spectrum sensing in
cognitive radio, part I: two user networks,” IEEE Transactions
on Wireless Communications, vol. 6, no. 6, pp. 2204–2212,
2007.
[15] G. Ganesan and Y. Li, “Cooperative spectrum sensing in cog-
nitive radio, part II: multiuser networks,” IEEE Transactions on
Wireless Communications, vol. 6, no. 6, pp. 2214–2222, 2007.
[16] Z. Quan, S. Cui, and A. H. Sayed, “Optimal linear cooperation
for spectrum sensing in cognitive radio networks,” IEEE
Journal on Selected Topics in Signal Processing,vol.2,no.1,pp.
28–40, 2008.
[17] J. Unnikrishnan and V. V. Veeravalli, “Cooperative sensing for
primary detection in cognitive radio,” IEEE Journal on Selected
Topics in Sig nal Processing, vol. 2, no. 1, pp. 18–27, 2008.
[18] C. Sun, W. Zhang, and K. B. Letaief, “Cooperative spectrum
sensing for cognitive radios under bandwidth constraints,”
in Proceedings of the IEEE Wireless Communications and
EURASIP Journal on Advances in Signal Processing 15
Networking Conference (WCNC ’07), pp. 1–5, Hong Kong,
March 2007.
[19] C. Sun, W. Zhang, and K. B. Letaief, “Cluster-based coopera-
tive spectrum sensing in cognitive radio systems,” in Proceed-
ings of IEEE International Conference on Communications (ICC
’07), pp. 2511–2515, Glasgow, UK, June 2007.
[20] C H.LeeandW.Wolf,“Energyefficient techniques for coop-
erative spectrum sensing in cognitive radios,” in Proceedings
of the 5th IEEE Consumer Communications and Networking
Conference (CCNC ’08), pp. 968–972, Las Vegas, Nev, USA,
January 2008.
[21] R. Chen, J M. Park, and J. H. Reed, “Defense against primary
user emulation attacks in cognitive radio networks,” IEEE
Journal on Selected Areas in Communications,vol.26,no.1,pp.
25–37, 2008.
[22] T. Newman and T. Clancy, “Security threats to cognitive radio
signal classifiers,” in Proceedings of the Virginia Tech Wireless
Personal Communications Sy mposium , Blacksburg, Va, USA,
June 2009.
[23] S. M. Mishra, A. Sahai, and R. W. Brodersen, “Cooperative
sensing among cognitive radios,” in Proceedings of the IEEE
International Conference on Communications (ICC ’06), vol. 4,
pp. 1658–1663, Istanbul, Turkey, June 2006.
[24] R. Chen, J M. Park, and K. Bian, “Robust distributed spec-
trum sensing in cognitive radio networks,” in Proceedings of
IEEE International Conference on Computer Communications
(INFOCOM ’08), pp. 31–35, Phoenix, Ariz, USA, April 2008.
[25] T. Clancy and N. Goergen, “Security in cognitive radio
networks: threats and mitigation,” in Proceedings of the 3rd
International Conference on Cognitive Radio Oriented Wireless
Networks and Communications (CrownCom ’08), Singapore,
May 2008.
[26] W. Wang, H. Li, Y. Sun, and Z. Han, “Attack-proof collab-
orative spectrum sensing in cognitive radio networks,” in
Proceedings of the 43rd Annual Conference on Information
Sciences and Systems (CISS ’09), pp. 130–134, March 2009.
[27] W. Wang, H. Li, Y. Sun, and Z. Han, “CatchIt: detect malicious
nodes in collaborative spectrum sensing,” in Proceedings of the
IEEE Global Communications Conference (GLOBECOM ’09),
Honolulu, Hawaii, USA, November 2009.
[28] R. Peng and M. L. Sichitiu, “Angle of arrival localization
forwirelesssensornetworks,”inProceedings of the 3rd
Annual IEEE Communications Society on Sensor and Ad Hoc
Communications and Networks (Secon ’06), vol. 1, pp. 374–382,
September 2006.
[29] P. Bahl and V. N. Padmanabhan, “RADAR: an in-building RF-
based user location and tracking system,” in Proceedings of
IEEE International Conference on Computer Communications
(INFOCOM ’00), pp. 775–784, Tel Aviv, Israel, March 2000.
[30] B. H. Wellenhoff, H. Lichtenegger, and J. Collins, Global Posi-
tions System: Theory and Practice, Springer, Berlin, Germany,
4th edition, 1997.
[31] A. Savvides, C C. Han, and M. B. Strivastava, “Dynamic
fine-grained localization in ad-hoc networks of sensors,” in
Proceedings of the 7th Annual International Conference on
Mobile Computing and Networking (MOBICOM ’01), pp. 166–
179, Rome, Italy, July 2001.
[32] T.He,C.Huang,B.M.Blum,J.A.Stankovic,andT.Abdelza-
her, “Rangefree localization schemes for large scale sensor
networks,” in Proceedings of the 9th Annual International
Conference on Mobile Computing and Ne tworking (MOBICOM
’03), San Diego, Calif, USA, 2003.
[33] Q. Zhao, L. Tong, A. Swami, and Y. Chen, “Decentralized
cognitive MAC for opportunistic spectrum access in ad hoc
networks: a POMDP framework,” IEEE Journal on Selected
Areas in Communications, vol. 25, no. 3, pp. 589–599, 2007.