Supply Chain, The Way to Flat Organisation Part 9 doc
Bạn đang xem bản rút gọn của tài liệu. Xem và tải ngay bản đầy đủ của tài liệu tại đây (1.71 MB, 30 trang )
A Framework and Key Techniques for Supply Chain Integration
231
A company must measure and then enhance its capability of planning, sourcing, making
and delivering illustrated in level 2 and level 3 (shown as Table 6), to meet the needs of
customers. The degree of these metrics reach will determine its operational competency.
Order and order fulfillment by XX, JIT delivery, inventory turnover, and cash-to-cash
cycle time are the most important metrics of operational measurement. Some activities are
linked to the metrics, e.g. the inventory management will affects the fulfillments of order
and order by XX highly. So the company should collect and evaluate all the four processes
operational information to make decisions. If it was found that the operations have some
biases with the targeted performance, the company should investigate the relative
businesses processes from the three types attributes shown as level 3, which are also
called level 3 consultant metrics. Table 6 shows that the consultant metrics can be used
not only to analyze the complexity and structure of supply chain, but to investigate the
concrete business operations. By effective data collection and performance evaluation, the
companies can find its weakness and then make plans to improve their performance and
competency gradually.
Level 2 Level 3
Performance metrics Complexity metrics
Structure
metrics
Practices matrix
Plan Planning cost
Financial cost
Inventory days of supply
Rate of order change
Number of SKUs held
Throughput
Inventory holding
cost
Products amount
of different
channels
Number of
channels
Number of
supply chain
location
Planning period
Forecast accuracy
Obsolete stock on-hand
Source Material acquisition cost
Source cycle time
Material acquisition time
Number of Suppliers
Rate of source from
long distance
Materials from
long distance
Rate of source
from long
distance
Supplier delivery
performance
Payment period
Percentage of each
purchased items by lead
time
Make Product defects or
number of customer
complaints
Make cycle time
Order fulfillment
Product quality
Number of SKUs
Flexibility with the
increasing demand
Make process
steps by area
Utilization
Rate of value-added
Rate of order fulfillment
Inventory turnover
Rate of change order by
internal problems
WIP
Deliver Order fill rates
Order management cost
Order fulfillment lead
times
Rate of product return
Order numbers by
channels
Items and shipments
by channel
Rate of items return
Distribution
location by area
Number of
Channels
Delivery lead time
Percentage of invoices
with wrong bill
Methods of order entry
Table 6. Supply chain performance metrics and diagnosis metrics
Supply Chain, The Way to Flat Organisation
232
5. Critical contents in strategic management level
5.1 Partnership maintaining
5.1.1 The types of enterprises relationship
The key to supply chain success is good relationship with partners and excellent
collaboration in product design, manufacture and competitive strategy between them. What
type relationship that the supply chain selected finally relies on the degree of knowledge
reliance and information sharing between all the members of supply chain (General
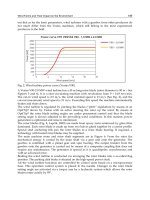
Administration of Quality Supervision, Inspection and Quarantine of PRC, 2001). Figure 7
shows the main five types of supply chain relationship. According to Figure7, contract and
outsourcing is the basic types of collaboration. In these two types, the reliance is just
accepted to a certain extent, and only a little information (of operations) is shared.
Moreover, the relationships can exist just in a certain period.
Fig. 7. The types of supply chain relationship
While with the management relationship, the focal firm usually takes the role of leadership
and is in charge of looking for better collaboration with trade partners and service
providers. Not only the operational information is shared, but some strategic information is
shared as well. The relationships can last for a comparatively long time.
Strategic alliance and enterprise extension are two types of partnership, with which the
firms require collaboration and are willing to cooperate rationally in an integrated way.
They reach consistency automatically to integrate human, finance, operations and
techniques to provide greater customer value with higher efficiency. And an extended
collaboration planning aiming at maintaining this relationship is included as well.
Enterprise extension, which is across the border of single firm, is the end of knowledge
reliance and information sharing. By total information and planning share, enterprise
extension can increase the operational efficiency and enhance the relationship. Moreover, it
presents a more simple way of CPFR which we have discussed in section 4.1.
5.1.2 Strategic partnership and the key to partnership maintaining
There is no doubt that Strategic partnership based collaboration can increase the cooperation
and communication between functions and firms so as to balance production, synchronize
logistics, at the same time, shorten the time to market of new product remarkably.
A Framework and Key Techniques for Supply Chain Integration
233
Furthermore, the partnership strengthens the flexibility and agility in the fierce market by a
production mode of modularization, simplification and standardization oriented to high
customization. Virtual manufacturing and dynamic alliance are typical forms of strategic
partnership, which enhance the effect of outsourcing.
However, it is not easy to establish and maintain the relationship. The main reason is that all
firms are always concern with their own benefits. So the depth and scope usually limited,
even for the strategic partners. When the internal or external environments change, the firms
may be suffer great disasters because their partners’ mistakes or abandonment. Ericsson
Corp. lost its competitive advantage in mobile phone market and declined generally from
March 2000, when the Philip Co., a supplier of Ericsson, fired unexpected in a plant which
resulted in a downtime in Ericsson for the lack of key components.
What firms can be chosen as the partners? In order to seamlessly cooperate, the partners
should have consistent cultures, uniform strategic insights and inter-supported operational
philosophy, which can ensure their core competencies are complementary to each other.
Then, how to maintain a long-term partnership? It relies on three aspects: common strategy
and operational vision; bi-directional performance evaluation metrics, and the formal and
informal feedback mechanism.
First, define the strategy and operational goals all together, and then trace, evaluate and
update the goals often to achieve long-term improvements. For example, if the focal firm
develops a new product, it should decide the common goals with its customers about the
product market orientation. Also, the goals should take the retailers’ key role in the process
into consideration.
Second, transfer the strategic and operational goals into detailed traceable performance
measurements. The focal firm and their partners should decide the metrics and measure
frequency together. Meanwhile, the metrics should be bidirectional. Generally, the metrics
between manufacture and their suppliers focus more on the suppliers’ performance, for
example, JIT delivery and quality. A research on strategic alliance developed a successful
united metrics - total systematical inventory. The research point out that it is the inventory
decrease of two sides that is really important to improve the whole supply chain
performance, not only the inventory decrease of manufacturers.
Third, evaluate performance, feedback and improve formally and informally. Annually assessment
is the most popular formal method, which is usually done by top managers aiming at
checking and updating strategy goals. While quarterly check or monthly check are two
kinds of informal method focusing more on tracing and evaluating the operational
performance, which is usually top manager excluded. When informal checks implement, the
alliance can change their operational practice to create good conditions for improve the
planning and reach strategic goals. Weekly/daily checks are also informal activities, which
are carried out by coordinators to solve routine problems and find the opportunities to
improve. Although they are informal, they have a detailed mechanism to solve problems. In
a word, they are vital for collision avoidance and are good for establishing close relationship
between coordinators.
5.2 Cultural integration and cultural adaptation
Organizational culture is the common cultural values growing up with the development of
an enterprise, which has been accepted by all the staff and workers, including the vision, the
management philosophy, the tradition, the behavior regulation, the management system,
Supply Chain, The Way to Flat Organisation
234
the relevant enterprise spirit, and so on. Generally, the culture will affect the behavior of
firms and the culture consistency of supply chain, and then enhance the cohesion and
competence of supply chain.
Cultural integration and adaptation is on the top of supply chain integration, which can be
divided into integration within focal firm and adaptation between focal firm and their
partners. Within the focal firm, the cultural integration should more strength the firm
features, e.g. the values, the spirits, and the philosophy. And for the whole supply chain, the
cultures should be adapted from the following three aspects.
Strategies consistency, the integration on the macro-level. The focal firm should confirm and
enhance its core competence, while outsource the non-core competitive business by
establishing strategic partnership with its supplier; on the basis, integrate the visions,
competitive strategies and development tacit to reach their common goals.
Philosophies or values adaptation, the kernel and difficulty of cultural adaptation. The
organizational philosophies and values, comprised of vision, philosophy, spirit, concepts of
benefit, service, quality, etc., are the special standards on operational behaviors selection
and evaluation shaping from its long-time operational process and the essential part of
organizational culture. Values adaptation along the supply chain needs to separate the good
from the bad, and then strengthen the good while delete the bad. Meanwhile, promote the
values of focal firm and then form the common values accepted by all members generally.
Management models integration. In this operations level, different management models in
supply chain should be analyzed to find, integrate and develop suitable spirits and souls for
supply chain integration. By integrating management models, the improvement of
employees’ quality is linked with the improvement of supply chain competency, and a new
incentive mechanism and supply chain culture that employees’ fate is connected closely
with the status of supply chain will be formed finally.
6. Conclusion
It is the good choice for a firm try to enter the global operation system to enlarge its market
share and raise efficiency while its business develops strong enough. Generally, the process
can be divided into three stages: international trade, branches establishment abroad and
globalization. At the third stage, the firm can develop its business across the boundary in the
international market. Therefore, it can improve the operational efficiency from three aspects
at least: implement strategic supply of raw material and components; gain profit from low
price labor by making and delivering in developing country; gain more profits from the tax
preferential policy which makes the value-added model more attractive.
Up-to-date, most Chinese firms are still at the first stage. They are still relying on the low
manufacturing cost from low price labor. However, just like the book Supply chain
management: the practices in Hong Kong Li & Fung Group said: The production cost of a 4-yuan
product in American market is only 1 Yuan. More important, it has almost reached the
lowest and is difficult to decrease. So the firms must turn to the other 3 Yuan to make
profits, i.e., make money by cost reduction in the whole supply chain processes, including
product design, material supply, transportation, wholesaler and retailer, information and
management. From the supply chain perspective, there are still lots of opportunities to
decrease cost (Li & Fung Research Centre, 2003). ZARA and H&M have made good
examples. Although no plant is established in China, they have entered Chinese market
successfully with low cost and high profit through global supply chain integration. Chinese
A Framework and Key Techniques for Supply Chain Integration
235
firms should pay more attention on this trend and try to enhance the competitive advantage
from supply chain advantage.
The paper explores a framework for supply chain integration, and explained the relative
methods from three aspects- operational management, planning and controlling, and
strategic management. By effective supply chain integration, Chinese firms will find a more
competitive way to increase the capability of soft 3-Yuan and compete in world market.
7. References
Burnett, K. (Translated by Liu, R. et al). (2002). The Handbook of Key Customer Relationship
Management, Publishing House of Electronics Industry, Beijing
Chen, J. & Ma, S. (2006). Implementable Mechanisms and Technical Solution for Supply
Chain Integration Management, Industrial Engineering and Management. Vol.8 No.1,
23~31
Chien T. W. (1993). Determining profit-maximizing production/shipping policies in a one-
to-one direct shipping, stochastic environment. European Journal of Operational
Research, No.64: 83~100
Christopher, M. & Gattorna, J. (2005). Supply chain cost management and value-based
pricing. Industrial Marketing Management, (34): 115~121
Christopher, M. (2000). Marketing Logistics. Simon & Schuster (Asia) Pte Ltd.
Cohen M.A. & Lee H.L. (1988). Strategic analysis of integrated production-distribution
systems: models and methods. Operational Research, 36(2): 216~228
Erengue S. S., Simpson N. C., Vakharia A. J. (1999). Integrated production distribution
planning in supply chain: an invited review. European Journal of Operational
Research, No.115, 219~236
Fisher M. L. (1997). What is the right supply chain for your product? Harvard Business
Review, No.2, 105~116
General Administration of Quality Supervision, Inspection and Quarantine of the People’s
Republic of China. (2001). National Standards of the People’s Republic of China: terms of
logistics, Standards Press of China, Beijing
Gimenez, C. (2006) . Logistics integration process in the food industrial. International Journal
of Physical Distribution and Logistics Management, Vol. 36, No.3, 231-45.
Gimenez, C. & Ventura, E. (2005). Logistics-production, logistics marketing and external
integration: their impact on performance. International Journal of Operations &
Production Management, Vol. 25 No. 1, 20-38.
Hammer M. (1990). Reengineering Work: Don’t Automate, Obliterate. Harvard Business
Review, July-Auguste, 104~120
Hammel T.D. & Kopczak L.R. (1993). Tighting the Supply Chain, Production and Inventory
Management. Second Quarter, 63~69
Harrison, A. &van Hoek, R (2008). Logistics Management and Strategy: Competing through the
supply chain (3rd edition). Prentice Hall Press.
Ireland, R. & Bruce R. (2000). CPFR only the beginning of collaboration. Supply Chain
Management Review. No.5, 80~88
Lalwani, C. & Mason, R. (2004). Transport integration tools for supply chain management
Proceedings of the 9th Annual Logistics Research Network Conference, pp. 346-355,
University College Dublin, Quinn School of Business,
Supply Chain, The Way to Flat Organisation
236
Li & Fung Research Centre. (2003). Supply Chain Management: the practices in Hong Kong Li &
Fung Group, China People's University Press, Beijing
Mason, R. & Lalwani, C. (2006). Transport integration tools for supply chain management,
International Journal of Logistics: Research and Applications, Vol. 9 No. 1, 57-74.
Mortensen, O. & Lemoine l. (2008). Integration between Manufacturers and third party
logistics providers. International Journal of Operations & Production Management, Vol.
28 No. 4, 331-359
Muekstadt, J.A. & Roundy, R.O. (1993). Logistics of production and inventory. NortHolland
Press
Narus, J. & Anderson, J. (1986). Turn Your Industrial Distributors into Partners. Harvard
Business Review, No.2: 66~71
Nissen, M.E. (2001). Agent-Based supply chain integration. Information Technology and
Management, No.2, 289~312
Yilmaz, P. & Catay B. (2005). Strategic level three-stage production distribution Planning.
Computers and Industrial Engineering, Vol. 48 No. 4, 799~809
Pyke, D.E. & Cohen M.A. (1993). Performance characteristics of stochastic integrated
production-distribution systems. European Journal of Operational Research, No. 68,
23~48
Pyke, D.E. & Cohen M.A. (1994). Multiproduct integrated production-distribution systems.
European Joumal of Operational Research, No. 74, 18~49
Simchi-Levi, D., Kaminsky, P., et al. (2003). Designing and Managing the Supply Chain (2
nd
Ed).
McGraw-Hill, New York
Stank, T.P., Keller, S.B. and Daugherty, P.J. (2001). Supply chain collaboration and logistical
service performance, Journal of Business Logistics, Vol. 22 No. 1, 29-48
Supply Chain Council (SCC). (2008). SCOR 9.0 Overview. www.supply-chain.org
Tang, D. & Qian, X. (2008). Product lifecycle management for automotive development
focusing on supplier integration. Computers in Industry, No.59, 288–295.
Thorn, J. (2002). Taktisches Supply Chain Planning, 22, Frankfurt am Main: Peter Lang
van Hoek, R. & Mitchell, A. (2006). Why supply chain efforts fail: the crisis of misalignment,
International Journal of Logistics, Research and Applications, Vol. 9, No.3, pp269-281
Zhang, L., Pan, R. et al. (2003). The Bullwhip Effect and the Visibility in Supply Chain.
Commercial Research, No.24, 179-181.
Zhou, W. (2006). Strategy of key account loyalty: Partnership-based marketing, Hunan People’s
Press: Changsha
13
New Approaches for Modeling and Evaluating
Agility in Integrated Supply Chains
Vipul Jain and Lyes Benyoucef
INRIA Nancy Grand Est, COSTEAM Project,
ISGMP, Bat. A, Ile du Saulcy 570000, Metz,
France
1. Introduction
In the exisiting hotly competitive environment, companies/enterprises/organizations are
interesting by the following question: How to provide the desired products and/or
services to customers faster, cheaper, and better than the competitors?. Managers have
come to realize that they cannot do it alone; rather, they must work on a cooperative basis
with the best organizations in their supply chains in order to succeed. Moreover, the
emerging global economy and the advent of IC technologies have significantly modified the
business organisation of enterprises and the way of doing business. New forms of
organisations such as extended enterprises, virtual enterprises, long supply chains etc.
appeared and are quickly adopted by most leading enterprises. It is more and more noticed
that "Competition in the future will not be between individual organizations but between
competing supply chains" (Christopher, 2004). More and more business opportunities are
captured by groups of enterprises in the same supply chains. The main reason for this
change is the global competition that force enterprises to focus on their core competences
(i.e. to be what you do the best and let others do the rest). According to the visionary report
of Manufacturing Challenges 2020 conducted in USA, this trend will continue and one of
the six grand challenges of this visionary report is to ability to reconfigure manufacturing
enterprises rapidly in response to changing needs and opportunities.
While alliances like supply chains represent tremendous business opportunities, they also
make related enterprises face greater uncertainties and risks. First supply chains are subject
to market volatility and will have to be modified or dissolved once the business
opportunities evolve or disappear. Changes or major perturbations at one enterprise will
propagate through the supply chains to other enterprises and hence adversely influence
the overall performance of the supply chains/networks. These issues are particularly
important for SMEs. SMEs have to be part of some supply chains for business opportunities
but they are not strong enough to face high uncertainties and risks, which are very common
in today’s dynamic and volatile markets. The capabilities to evaluate agility, benefits,
performances, risks, etc. of supply chains are crucial for the long term efficiency and thus
need serious research attentions.
Existing in both service and manufacturing activity sectors, generally speaking, a supply
chain includes the transition and transportation of material from raw form through several
Supply Chain, The Way to Flat Organisation
238
stages of manufacturing, assembly and distribution to a finished product delivered to the
retailers and/or the end customers (Jain et al., 2006). In addition to the material flows, it also
includes the flows of information and finance. Each stage of material transformation or
distribution may involve inputs coming from several suppliers and outputs going to several
intermediate customers. Each stage will also involve information and material flows
coming from immediate and distant preceding and succeeding stages.
Supply chains in general and integrated supply chains in particular are complex systems
and their modeling, analysis and optimization requires carefully defined approaches
/methodologies. Also, the complexities may vary greatly from industry to industry and
from enterprise to enterprise. Since technological complexity has increased, supply chains
have become more dynamic and complex to manage. Consequently, it is easy to get lost in
details and spend a large amount of efforts for analyzing the supply chain. On the other hand, it is
also possible to execute too simplistic analysis and miss critical issues, particularly using tools that
do not take into account agility, uncertainties, risks, etc.
It is important to recognize that supply chain power has shifted from manufacturer to
retailer, and finally to consumer (Blackwell & Blackwell, 2001). Most of the supply chain
researchers and practitioners have agreed that there is a real need to develop integrated
supply chains significantly more flexible, responsive and agile than existing traditional
supply chains. It is essential that supply chains continually re-examine how they can
compete and agility is one of the underlying paradigms to enable them to re-invent the
content and processes of their competitive strategies. The main objectives of this chapter is
to discuss two new approaches for modeling and evaluating agility in dynamic integrated
supply chains. The rest of the chapter is organized is as follows: Section 2 deals with the
complexities of integrated supply chains. Section 3 discusses the need for agile integrated
supply chains. Section 4 presents the two novel approaches. Finally, section 5 concludes the
chapter with some perspectives.
2. Integrated supply chains complexities
The key to genuine business growth is to emphasize the creation of an effective supply chain
with trading partners, while at the same time maintaining a focus on the customer. Today,
instead of simply focusing on reducing cost and improving operational efficiency, more
efforts are put on customer satisfaction and the enhancement of relationships between
supply chain partners. Traditional supply chain management (structural and operational
strategies) are more incompetent and integration between all supply chain partners is
essential for the reliability and durability of the chain. Therefore, more and more companies
in different sectors like automotive, textile, grocery, petrochemical etc. are giving much
more emphasizes on the integration of all their supply chain partners.
Integrated supply chains are dynamic complex processes, which involves the continuous
flow of information, materials, and funds across multiple functional areas both within and
between chain members. Each member of the integrated supply chain is connected to other
parts of the integrated chain by the flow of materials in one direction, the flow of
information and money in the other direction. Changes in any one of these integrated chain
members usually creates waves of influence that propogate throughout the integrated
supply chains. These waves of influence are reflected in prices (both for raw materials, labor,
New Approaches for Modeling and Evaluating Agility in Integrated Supply Chains
239
parts, and finished product), flow of materials and product (within a single facility or
between facilities within the supply chain), and inventories (of parts, labor capacity, and
finished product). Besides its effectiveness, integrated supply chain management is a
difficult process because of the stochastic and dynamic nature, multi-criterion and ever-
increasing complexity of integrated supply chains. Due to highly complex nature of
integrated supply chains, designing, analyzing and re-engineering of integrated supply
chain processes using formal and quantitative approaches seems to be very difficult (Jain et
al., 2006, Ding et al., 2006).
Several researchers, such as Evans et al., 1995, Vander Aalst, 1998, Lin and Shaw 1998, etc.
have developed some frameworks and models to design and analyze the supply chain
processes. These models are either oversimplified or just qualitatively described (some of
them are based on simulation study (Bhaskaran, 1998) and are difficult to apply for
evaluating real supply chains with quantitative analysis and decisions. Because today’s
manufacturing enterprises are more strongly coupled in terms of material, information and
service flows, there exists a strong urge for a process-oriented approach to address the
issues of integrated modeling and analysis (Ding et al., 2006, Jain et al. 2006, 2007a). Many of
the past studies neglected significant impacts of such integration issues because of dramatic
increase in modeling complexity. Therefore, models from past studies are confined in their
capability and applicability to analyze real supply chain processes. An integrated formal
and quantitative model, addressing the above mentioned issues that allows supply chain
managers to quickly evaluate various design and operation alternatives with satisfactory
accuracy, has become imperative (Jain et al., 2007b).
Moreover, the need for agility for competitiveness has traditionally been associated with the
integrated supply chains that provide and manufacture innovative products, such as high-
technology industry products characterized by shortened life-cycles, a high degree of
market volatility, uncertainty in demand, and unreliability in supply. Similarly, traditional,
more slow moving industries face such challenges in terms of requirements for speed,
flexibility, increased product diversity and customization. The next section discusses more
in detail why the need for agile integrated supply chain?
3. Why agile integrated supply chain?
Agility – namely, the ability of a supply chain to rapidly respond to changes in market and
customer demands – is regarded as the bearer of competitive advantage in today's business
world (Yusuf et al., 2004, Christopher & Towill, 2001, Gunasekaran, 1999). Based on a survey
of past decade management literature, van Hoek (2001) identify the two most significant
lessons for achieving competitive advantage in the modern business environment. The first
lesson is that companies have to be aligned with suppliers, the suppliers’ of the suppliers,
customers and the customers' of the customers, even with the competitors, so as to
streamline operations (Simchi-Levi et al., 2003). As a result, individual companies no longer
compete solely as autonomous entities; rather, the competition is between rival supply
chains, or more like closely coordinated, cooperative business networks (Christopher, 1998,
Lambert et al., 1998). The second lesson is that within the supply chain, companies should
work together to achieve a level of agility beyond the reach of individual companies. All
Supply Chain, The Way to Flat Organisation
240
companies, suppliers, manufacturers, distributors, and even customers, may have to be involved in
the process of achieving an agile supply chain (Christopher, 2000, Christopher and Towill, 2001).
Furthermore, “Agility" includes "Leanness" because a high stock or spare capacity method
of providing flexibility to changing customer demands or adversity is not a viable
financial option. Since, agile manufacturing incorporates all the elements of lean manufacturing
and thus lean and agile supply chains have commonality of characteristics except that the latter
ascribes to additional principles and practices, which enhances its capability to balance both
predictable and unpredictable changes in market demands (Yusuf et al., 2004). In a changing
competitive environment, there is a need to develop supply chains and facilities
significantly more flexible and responsive than existing ones. It is essential that supply
chains continually re-examine how they can compete and agility is one of the underlying
paradigms to enable them to re-invent the content and processes of their competitive
strategy. In agility, therefore, lies the capability to survive and prosper by reacting quickly
and effectively to changing markets. As a result, more recently, the agile manufacturing
paradigm has been highlighted as an alternative to, and possibly an improvement on,
leannessAn agile supply chain is seen as a dominant competitive advantage in today’s
business; however, the ability to build an agile supply chain has developed more slowly
than anticipated (Lin et al., 2006).
Based on a survey of past decade management literature, van Hoek (2001) identify the two
most significant lessons for achieving competitive advantage in the modern business
environment. One lesson is that companies have to be aligned with suppliers, the suppliers’
of the suppliers, customers and the customers' of the customers, even with the competitors,
so as to streamline operations (Simchi-Levi et al., 2003). As a result, individual companies no
longer compete solely as autonomous entities; rather, the competition is between rival
supply chains, or more like closely coordinated, cooperative business networks (Christopher
1998, Lambert et al. 1998). Another lesson is that within the supply chain, companies should
work together to achieve a level of agility beyond the reach of individual companies (van
Hoek, 2001). All companies, suppliers, manufacturers, distributors, and even customers,
may have to be involved in the process of achieving an integrated agile supply chain
(Christopher, 2000, Christopher & Towill, 2001).
The need for agility for competitiveness has traditionally been associated with the supply
chains that provide and manufacture innovative products, such as high-technology
industry products characterized by shortened life-cycles, a high degree of market
volatility, uncertainty in demand, and unreliability in supply. Similarly, traditional, more
slow moving industries face such challenges in terms of requirements for speed,
flexibility, increased product diversity and customization. Consequently, the need for
agility is becoming more prevalent. These demands come, typically, from further down
the supply chain in the finishing sector, or from end customers (Gunasekaran & Ngai,
2004). Some traditional companies have already elements of agility because the realities of
a competitive environment dictate these changes (e.g. in sectors such as automobiles,
food, textiles, chemicals, precision engineering and general engineering) (Christian et al.,
2001). According to Christian et al. (2001), this is, however, usually outside any strategic
vision and is approached in an ad-hoc fashion. The lack of a systematic approach to agility
does not allow companies to develop the necessary proficiency in change, a prerequisite for agility (
Lin et al., 2006).
New Approaches for Modeling and Evaluating Agility in Integrated Supply Chains
241
Kidd (1994) stated that Supply Chain Management (SCM) is a fairly well defined topic, but
agility is not so well defined. Agility can be something that companies achieve without
realizing it, or it can relate to issues that are difficult to quantify. The nature of the
competencies implied by agility is such that they would be better considered as intangibles,
similar to intellectual property, company specific knowledge, skills, expertise, etc. In
summary, SCM and agility combined are significant sources of competitiveness in the business
world. Thus, it is no surprise that they are favored research areas in the academic research world
(Yusuf et al., 2004, Swafford et al., 2006).
The fact that agile attributes are necessary but not sufficient conditions for agility points to a major
research issue to be addressed (Yusuf and Burns, 1999). It is essential that the attributes are
transformed into strategic competitive bases of speed, flexibility, proactivity, innovation, cost, quality,
profitability and robustness. More importantly, these attributes are of very little significance to
practitioners unless there is a way of deploying them. In addition, the changing nature of
the market requirements suggests the need for a dynamic deployment tool for evaluating
agility. Integrated supply chains have realized that agility is essential for their survival and
competitiveness. Consequently, there is no generally accepted method by researchers and
practitioners for designing, operating and evaluating agile supply chains. Moreover, the
ability to build agile supply chain has developed more slowly than anticipated, because technology for
managing agile supply chain is still being developed.
Based on a synthesis of the literature (Sharp et al., 1999, Yusuf et al., 1999, Jharkaria and
Shankar, 2005) and interviews of several industrial partners in the EU-I*Proms project
(www.Iproms.org), the following critical questions and extracted motivations form the basis
of this research work:
Some critical questions
Question 1: What precisely is agility/leanness and how it can be measured?
Question 2: How to develop an integrated agile/lean supply chain?
Question 3: How will lean and agile supply chains know what they have it, as there are no
simple metrics or indexes available?
Question 4: How and to what degree does the integrated lean and agile supply chain
attributes affect supply chains business performance?
Question 5: How to compare agility/leanness with competitiveness?
Question 6: How can the integrated supply chains identify the principal obstacles to
improvement, if a supply chain wants to improve agility and leanness?
Question 7: How to assist in achieving agility/leanness effectively?
Some extracted motivations
Motivation 1: All companies, suppliers, manufacturers, distributors, and even customers,
may have to be involved in the process of achieving an agile supply chain (Christopher,
2000, Christopher & Towill, 2001).
Motivation 2: The lack of a systematic approach to agility does not allow companies to
develop the necessary proficiency in change, a prerequisite for agility ( Lin et al., 2006).
Motivation 3: SCM and agility combined are significant sources of competitiveness in the
business world. Thus, it is no surprise that they are favored research areas in the academic
research world (Yusuf et al., 2004, Swafford et al., 2006).
Motivation 4: Most agility measurements are described subjectively by linguistic terms,
which are characterized by ambiguity and multi-possibility. Thus, the scoring of the existing
Supply Chain, The Way to Flat Organisation
242
techniques can always be criticized, because the scale used to score the agility capabilities
has limitations ( Lin et al., 2006).
Motivation 5: The fact that agile attributes are necessary but not sufficient conditions for
agility points to a major research issue to be addressed (Yusuf & Burns, 1999). It is essential
that the attributes are transformed into strategic competitive bases of speed, flexibility,
proactivity, innovation, cost, quality, profitability and robustness.
Motivation 6: There is no methodology and tools for introducing and implementing such a
complex and dynamic interactive system which incorporate both quantitative and
qualitative attributes as agile supply chains (Lin et al., 2006).
Motivation 7: Recently, the use of intelligent agents for supply chain management has
received great attention as agent technology is the preferable technology for enabling a
flexible and dynamic coordination of spatially distributed entities in integrated supply
chains (Swaminathan et al., 1998).
Motivation 8: Fuzzy logic provides a useful tool to deal with problems in which the
attributes and phenomena are imprecise and vague (Zadeh, 1965).
Motivation 9: Relational databases have been widely used in support of business
operations, and there the size of database has grown rapidly, for the agility of decision
making and market prediction for varying degree of importance for agility evaluation,
knowledge discovery from a database is very important for sustaining essential information
to a business (Berry & Linoff, 1997).
Motivation 10: Association rules are one of the ways of representing knowledge, having
been applied to scrutinize market baskets to help managers and decision makers understand
which item/ratings are likely to be preferred at the same time (Han et al., 2000).
4. New approaches
Motivated by the above extracted motivations and to find the answers to the
aforementioned questions, which are critical to the practitioners and to the theory of
integrated agile supply chains design, in this section, we will discuss two novel approaches
for modeling and evaluating agility in dynamic integrated supply chains (Jain et al.,
2008a,b).
4.1 Fuzzy intelligent based approach
In this section, we discuss a novel approach to model agility (which includes leanness) and
introduce Dynamic Agility Index through fuzzy intelligent agents. Generally, it is difficult to
emulate human decision making if the recommendations of the agents are provided as crisp,
numerical values. The multiple intelligent agents used in this study communicate their
recommendation as fuzzy numbers to accommodate ambiguity in the opinion and the data
used for modeling agility attributes for integrated supply chains. Moreover, when agents
operate based on different criteria pertaining to agility like flexibility, profitability, quality,
innovativeness, pro-activity, speed of response, cost, robustness etc for integrated supply
chains, the ranking and aggregation of these fuzzy opinions to arrive at a consensus is
complex. The proposed fuzzy intelligent agents approach provides a unique and
unprecedented attempt to determine consensus in these fuzzy opinions and effectively
model dynamic agility.
New Approaches for Modeling and Evaluating Agility in Integrated Supply Chains
243
As producers, wholesalers and retailers seek more effective ways of marketing their
products, they increasingly examine their supply chains for ways to reduce costs. Strategic
planning of performance improvement is gaining attention in all areas of manufacturing.
The reason for that is that it takes into account the long-term interest of the company in
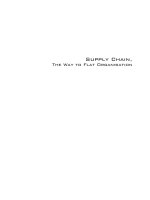
determining suitable business and operational policies. The agility in supply chains is
determined by certain time variables, which we refer to here as ‘agility characteristics’.
These characteristics evolve in time and determine the entire behavior of the supply chains,
refer Figure 1. The rate of change of these characteristics is a function of the current values of
all the attributes as well as some suitable ‘input’ variables, like the size and numbers of
teams, refereed as team formation, the level of integration of the database.
Leverage people and
Information technology
(foundation)
Master Change and
uncertainty (control)
Collaborative relationships
(strategy)
Agility enablers/pillars
Agile capability
•
Responsiveness
•
Competency
•
Flexibility
•
Quickness
Agile drivers (changing in business
environments)
•
Customer requirement
•
Competition criteria
•
Market
•
Technological innovation
Need for determination
of required agility level
Sourcing Flexibilit
y
and speed
Manufacturing
Flexibility and speed
Delivery Flexibility
and Speed
Process
Integration
Agile
Supply
Chain
Market
Sensitive
N
etwork
b
ased
Virtual
Complexity of
sourcing and delivery
Demand and forecast
uncertainty
External Vulnerability
of Supply chain
Fig. 1. The conceptual model for agile supply chains
The proposed dynamic agility index (DA
Li
) of an integrated supply chain can be given a
numerical value calculated as the sum of the products of suitable ‘economical bases’, i.e.
Li12345678
DA
X
T LVRRT B
WF WPWQWI WPWS WC WR
=
×+×+×+×+×+×+×+×
Where:
• F
X
is a measure of Flexibility, and W
1
is a weight assumed constant but time varying in
general,
• P
T
is a measure of Profitability, and W
2
is a weight assumed constant but time varying
in general,
• Q
L
is a measure of Quality, and W
3
is a weight assumed constant but time varying in
general,
• I
V
is a measure of Innovation, and W
4
is a weight assumed constant but time varying in
general,
Supply Chain, The Way to Flat Organisation
244
• P
R
is a measure of Profitability, and W
5
is a weight assumed constant but time varying
in general,
• S
R
is a measure of Speed of response, and W
6
is a weight assumed constant but time
varying in general,
• C
T
is a measure of Cost, and W
7
is a weight assumed constant but time varying in
general,
• R
B
is a measure of Robustness, and W
8
is a weight assumed constant but time varying in
general,
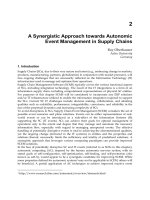
The dynamic agility index model considered in this research is shown in Figure 2.
Flexibility
F
X
Profitability
P
T
Quality
Q
L
Innovation
I
V
Pro-activity
P
A
Speed of
response S
R
Cost
C
T
Dynamic model of Agility
Robustness
R
B
Fig. 2. The proposed dynamic model for agile supply chains
Agility
enablers
Dimensions Related attributes Dimensions Related attributes
Integration Concurrent execution of
activities
Enterprise information
Information accessible to
employees
Team
building
De-centralized decision making
Empowered individuals working in teams
Cross-functional team
Teams across company borders
Change Culture of change
Continuous improvement
Education Response to changing market requirements
New product introduction
Customer driven innovations
Customer satisfaction
Competence Business practice and
structure are difficult to
replicate
Multi-venturing
capabilities
Technology Technology awareness
Leadership in the use of current technology
Skill and knowledge enhancing
technologies
Flexible production technology
Partnership Trust-based relationship
with customers/suppliers
Rapid partnership
formation
Strategic relationships
with customers
Close relationship with
suppliers
Market Response to changing market
requirements
New product introduction
Customer-driven innovations
Customer satisfaction
Welfare Employee satisfaction Quality Quality over product life
Products with substantial added value
First-time right design
Short development cycle times
New Approaches for Modeling and Evaluating Agility in Integrated Supply Chains
245
The mathematical model developed is based on dynamical systems theory and recognizes
that the integrated supply chains attributes have evolutionary approaches. Therefore, a new
generation tools should be developed and the existing tools significantly enhanced to
support decision-making processes and to deliver required solutions to extended
businesses.
Now, we present the various steps of the proposed Fuzzy Intelligent agent based approach
to study and model agility for integrated supply chains. More details of the proposed
approach can be found in (Jain et al., 2008a).
Step 1: Select criteria for evaluation. We have listed several important criteria including:
Flexibility (F
X
), Profitability (P
T
), Quality (Q
L
), Innovation (I
V
), Pro-activity (P
R
), Speed of
response (S
R
), Cost (C
T
), Robustness (R
B
).
“These selected eight criteria’s and their possible combinations abbreviated as (C
0
, C
1
, C
2
, C
3
,
C
4
, C
5
, C
6
, C
7
, C
8
) are listed in Table 1. The agility of integrated supply chains can be given a
numerical value calculated as the sum of the products of the aforementioned criteria and
their possible combinations as given in Table 1. The eight criteria’s listed above are by no
means exhaustive and therefore new factors may be added depending on the product,
industry and market characteristics.”
Step 2: Determine the appropriate linguistic scale to assess the performance ratings and
importance weights of the agility capabilities.
“Noteworthy, many popular linguistic terms and corresponding membership functions
have been proposed for linguistic assessment. In addition, the linguistic variables selected to
assess the importance weights of the agility capabilities are {Very High (VH), High (HG),
Fairly High (FH), Medium (M), Fairly Low (FL), Low (L), Very Low (VL)}.”
Step 3: Measure the importance and the performance of agility capabilities using linguistic
terms.
“Once the linguistic variables for evaluating the performance ratings and the importance
weights of the agility capabilities are defined, according to the supply chains policy and
strategy, profile, characteristics, business changes and practices, marketing competition
information, the agents can directly use the linguistic terms above to assess the rating which
characterizes the degree of the performance of various agility capabilities. The results,
integrated performance ratings and integrated importance weights of agility capabilities
measured by linguistics variables, are shown in Table 2.”
Step 4: Approximate the linguistic terms by fuzzy numbers.
“We perform trapezoidal approximations of fuzzy numbers. Tapping the properties of
trapezoidal fuzzy numbers, a set of fuzzy numbers for approximating linguistic variable
values was developed as shown in Table 3.”
Step 5: Cumulate fuzzy opinions with fuzzy weights.
“Several aggregation techniques require that the fuzzy opinions have some intersection so
that they are not entirely out of agreement. In case, the opinions do not have some
agreement, the agents negotiate until they can arrive at a consensus. However, these
methods will not be considered, as agents assumed in this research may intentionally have
disparate recommendations due to their diverge viewpoints for supply chain management.
Weighted linear interpolation is used to aggregate the opinions for every alternative, incase,
there is no common interaction between agent opinions.”
Supply Chain, The Way to Flat Organisation
246
New Approaches for Modeling and Evaluating Agility in Integrated Supply Chains
247
Performance rating Importance weighting
Linguistic variable Fuzzy number Linguistic variable Fuzzy number
Worst (WT)
Very Poor (VP)
Poor (PR)
Fair (FR)
Good (GD)
Very Good (VG)
Exceptional (EP)
(0, 0.05, 0.25, 1.25)
(1, 2, 3, 4)
(1.5, 2.5, 3.5, 4.5)
(2.5, 3.5, 4.5, 5.5)
(3.5, 4.5, 5.5, 6.5)
(5, 6, 7, 8)
(7, 8, 9, 10)
Very Low (VL)
Low (LW)
Fairly Low (FL)
Medium (MD)
Fairly High (FH)
High (HG)
Very High (VH)
(0, 0.005, 0.025, 0.125)
(0.1, 0.2, 0.3, 0.4)
(0.15, 0.25, 0.35, 0.45)
(0.25, 0.35, 0.45, 0.55)
(0.35, 0.45, 0.55, 0.65)
(0.5, 0.6, 0.7, 0.8)
(0.7, 0.8, 0.9, 1.0)
Table 3. Fuzzy numbers for approximating linguistic variables for selected agility criteria
Each agent,
ξ
, is assigned a rating,
ξ
ψ
. The most crucial agent is specified a rating of 1 and
the others are given ratings less than 1, in relation to their significance. To the ratings the
following properties holds:
Maximum (
1
ψ
,
2
ψ
,
3
ψ
…,
δ
ψ
) = 1
Minimum (
1
ψ
,
2
ψ
,
3
ψ
…,
δ
ψ
) < 1
The degree of significance (DOS) is defined as:
1
DOS 1, 2,3, ,
ξ
ξ
δ
ξ
ξ
ψ
ξ
δ
ψ
=
=Π = =
∑
(1)
The cumulated fuzzy opinion for alternative
η
is formed as a Trapezoidal fuzzy number
(TFN) tuple (
1
,
2
,
3
,
4
) using formulas:
112 2
11
3344
11
,,
,
δδ
ξξ ξ ξ
ξξ
δδ
ξξ ξξ
ξξ
λλ
λλ
==
==
⎧
=Π =Π
⎪
⎪
⎨
⎪
=Π =Π
⎪
⎩
∑∑
∑∑
(2)
where:
δ
is the number of agents with opinions on alternatives
η
,
ξ
Π
corresponds to the
degree of significance of agent
ξ
and (
1
ξ
λ
,
2
ξ
λ
,
3
ξ
λ
,
4
ξ
λ
) symbolizes TFN opinion of agent
ξ
for alternative
η
. The resulting inferred aggregated opinion (
1
,
2
,
3
,
4
) can be
represented as:
()
*
1
*
)( RRI
A
D
∑
=
Π=
δ
ξ
ξ
(3)
where
*
R
= (
1
ξ
λ
,
2
ξ
λ
,
3
ξ
λ
,
4
ξ
λ
) and ()D is the fuzzy multiplication operator.
Thus, the trapezoidal fuzzy membership function is used to determine the agility level and
the required fuzzy index of the selected criteria can be calculated using equation (3).
Supply Chain, The Way to Flat Organisation
248
0
(7,8,9,10) (0.7,0.8,0.9,1.0) (7,8,9,10) (0.7,0.8,0.9,1.0)
(7,8,9,10) (0.7,0.8,0.9,1.0) (7,8,9,10) (0.35,0.45, 0.55,0.65)
(7,8,9,10) (0.5,0.6,0.7,0.8) (7,8,9,10) (0.7,0.8,0.9,1.0)
(7,8,9,10) (0.35,0.
R
⊗⊕⊗
⊕⊗ ⊕⊗
⊕⊗ ⊕⊗
⊕⊗
=
45,0.55,0.65) (7,8,9,10) (0.5,0.6, 0.7,0.8)
(0.7,0.8,0.9,1.0) (0.7,0.8, 0.9,1.0) (0.7,0.8,0.9,1.0)
(0.35,0.45, 0.55,0.65) (0.5,0.6,0.7, 0.8) (0.7, 0.8,0.9,1.0)
(0.35,0.45, 0.55,0.65) (0.5,0.6,0.7
⎡⎤
⎢⎥
⎢⎥
⎢⎥
⎢⎥
⊕⊗
⎣⎦
⊕⊕
⊕⊕⊕
⊕⊕
(7,8,9,10)
,0.8)
=
⎡⎤
⎢⎥
⎢⎥
⎢⎥
⎣⎦
Applying the same equation the other fuzzy indexes of agility criteria are obtained as listed
in Table 4. Finally, applying the same equation again, we calculate the proposed Dynamic
Agility level index (DA
Li
) for modeling agility for integrated supply chains with the taken 8
criteria and their all possible combinations is evaluated as:
(7,8,9,10) (0.7,0.8, 0.9,1.0)
(5,6.04,7,8) (0.5,0.6,0.7,0.8)
(3.49, 4.51,5.5,6.52) (0.7,0.8, 0.9,1.0)
(2.52,3.5, 4.5,5.56) (0.5, 0.6,0.7,0.8)
(3.5,4.5,5.5,6.5) (0.35,0.45,0.55,0.65)
(5, 6,7,8) (0.5,0.6
Li
DA
⊗
⊕⊗
⊕⊗
⊕⊗
⊕⊗
⊕⊗
=
,0.7,0.8)
(3.52,4.5,5.48,6.25) (0.7,0.8,0.9,1.0)
(5, 6, 7,8) (0.35,0.45,0.55,0.65)
(0.7, 0.8,0.9,1.0) (0.5,0.6,0.7,0.8)
(0.7, 0.8,0.9,1.0) (0.5,0.6,0.7,0.8)
(0.35,0.45,0.55,0.65)
⎡⎤
⎢⎥
⎢⎥
⎢⎥
⎢⎥
⎢⎥
⎢⎥
⎢⎥
⎢⎥
⎢⎥
⊕⊗
⎢⎥
⊕⊗
⎢⎥
⎣⎦
⊕
⊕⊕
⊕⊕
(4.544,5.486,6.352,6.982)
(0.5,0.6,0.7,0.8)
(0.7,0.8,0.9,1.0) (0.35,0.45,0.55,0.65)
=
⎡⎤
⎢⎥
⎢⎥
⎢⎥
⎢⎥
⊕⊕
⎣⎦
Step 6: Rank the fuzzy opinions.
“The superior alternative must be chosen, once the opinions of the agents have been
aggregated to produce a consensus opinion for each alternative. The findings of Nakamura
(1986) emphasize a fuzzy preference function that outline a comparison index, which
compares opinions k
i
and k
j
that accounts for the hamming distance of every fuzzy number
to the fuzzy minimum and the fuzzified best and worst states.”
The FFCF is defined as:
(
)
()
()
** *
** *
,
1
0
1,
(, )
1
0
2
ii j
ii j
pi j
KK K
if
KK K
KK
if
β
β
β
βχ
ϖ
ϖ
βχ
μ
ϖ
⎧
⎡⎤
∧
⎪
⎢⎥
≠
⎪
⎢⎥
+− ∧
=
⎣⎦
⎨
⎪
⎪
=
⎩
(4)
where :
()
(
)
(
)
(
)
** * ** *
** * ** *
,,(1),,
ii j ji j ii j ji j
KK K K K K KK K K K K
β
ϖβχ χ βχ χ
⎡
⎤
⎡⎤
=∧+∧+− ∧+∧
⎣⎦
⎣
⎦
New Approaches for Modeling and Evaluating Agility in Integrated Supply Chains
249
{}
VSup
K
K
∈
∀
=
≥
φ
θ
μ
φ
μ
φθθ
)()(
*
(5)
Further,
*
K
is the highest upper set of K defined by:
{}
*
() ()
KK
Sup V
θθ φ
μ
φμθφ
≤
=
∀∈
(6)
ij
KK∧
is the extended minimum defined by:
{}
,
() [ () ()]
ij i j
KK K K
Sup V
θφθ φ σ
μ
σμθμφσ
∧
∧=
=
∧∀=
(7)
and the Hamming distance between
i
K
and
j
K
is given by (, )
ij
K
K
χ
, which is
(, ) () ()
ij
ij K K
KK d
ε
χ
μθ μθ θ
=−
∫
(8)
Theoretically,
(
)
** *
,
ii j
KK K
χ
∧
and
(
)
** *
,
ii j
KK K
χ
∧
signifies the advantages of
i
K
over
j
K
with respect to the fuzzified worst states and the fuzzified best states. The fraction of the
weighted combination of the advantages of
i
K
and
j
K
over the worst states and the above
the best states, to the sum of such weighted combinations of
i
K
’s and s’s is represented by
the fuzzy first choice function (FFCF),
),(
jip
KK
μ
.
In this chapter, the fuzzy first choice function compares every fuzzy opinion to a “Standard”
fuzzy number, which demonstrates the case where the opinion is “Most Likely”. Hence, the
difficulty with existing methods suffers when comparing fuzzy numbers with identical
modes and symmetric spreads is eliminated. Also, in this chapter, the fuzzy opinions are not
only judge against “Most Likely” fuzzy numbers but also are already ranked in contrast to
this value, thus eliminating the procedure of determining the ranking based on pairwise
comparison. The result of every fuzzy first choice calculation for every node presents its
ranking. The FFCF evaluating opinion K
i
and the most likely mode, M, substitutes the
second fuzzy opinion with M and is defined as:
(
)
()
()
** *
** *
,
1
0
1,
(,)
1
0
2
ii j
ii
pi
KK K
if
KK M
KM
if
β
β
β
βχ
ϖ
ϖ
βχ
μ
ϖ
⎧
⎡⎤
∧
⎪
⎢⎥
≠
⎪
⎢⎥
+− ∧
=
⎣⎦
⎨
⎪
=
⎪
⎩
(9)
The FFCF can be simplified by showing that
(
)
** *
, 0
ii
KK M
χ
∧
=
, when M is a TFN defined
as
12
(, ,1,1)
λ
λ
. Thus, if M is signified by
12
(, ,1,1)
λ
λ
, the modified fuzzy first choice
function used to evaluate opinion
i
K
with the most likely mode, M, is defined as:
()
*
**
1
,0
(, )
1
0
2
ii
pi
KK M if
KM
if
β
β
β
βχ ϖ
ϖ
μ
ϖ
⎧
∧
≠
⎪
⎪
=
⎨
⎪
=
⎪
⎩
(10)
Supply Chain, The Way to Flat Organisation
250
where
** * *
** *
**
(, ) (, )(1 )(, )
ii i i
KK M MK M MK M
β
ϖβχ χ βχ
⎡⎤
=∧+∧+−∧
⎣⎦
This fuzzy first choice function is able to distinguish between fuzzy numbers with identical
modes and symmetric spreads while reducing the computational complexity.
Step 7: Match the fuzzy opinions with an appropriate agility level.
“In this case the natural language expression set selected is given as: Exceedingly Agile
(EA), Very Agile (VA), Agile (AG), Fairly Agile (FA), Most Likely Agile (MLA), Slowly
Agile (SA), No Agile (NA). “
The Euclidean distance ED is calculated by using the Euclidean distance formula as given in
Equation (11) below:
()
1
2
2
(,) () ()
LL
LN AG F
xP
ED AG F f x f x
∈
⎛⎞
=−
⎜⎟
⎝⎠
∑
(11)
Where
{
}
[
]
01
, , , 0, 10
m
Pxx x=⊂
so that
01
0 10
m
xx x
=
<<< =.
The ED for the selected set of natural expression set is given as: ED (EA)= 1.2364, ED(VA)=
0.0424, ED(AG)= 1.0241, ED(FA)= 1.1462, ED(MLA)= 1.5321, ED(SA)= 1.6422 and ED(NA)=
1.8041.Thus, by matching a linguistic label with the minimum ED, dynamic agility can be
modeled with the given criteria’s. From the numerical example given in (Jain et al., 2008a), it
can be seen that the selected eight criteria (F
X
, P
T
, Q
L
, I
V
, P
R
, S
R
, C
T
, R
B
), the supply chain falls
under the Very Agile (VA) category. Depending on the selected criteria, for any supply
chains, the proposed approach will help the decision makers and analysts in quantifying
agility.
Step 8: Analyze and classify the main obstacles to improvement.
“Modeling agility not only measures how agile is integrated supply chain, but also most
importantly helps supply chain decision makers and practitioners to assess distinctive
competencies and identify the principal obstacles for implementing appropriate
improvement measures. In supply chain network, the factual environment of the problem
engrosses statistics, which is repeatedly fuzzy and indefinite. This is primarily owing to its
imprecise interfaces and its real-world character, where uncertainties in activities starting
raw material procurement to the end consumer make the supply chain unfocused. As
customer’s demands are always uncertain, manufacturers tend to manage their suppliers in
different ways leading to a supplier-supplier development, supplier evaluation, supplier
selection, supplier association, supplier coordination etc.”
However, it is difficult to emulate human decision making if the recommendations of the
agents are provided as crisp, numerical values. Intelligent agents must express their opinions
in similar terms to emulate human experts. Moreover at times, the agents make their
recommendations based upon incomplete or unreliable data. A second problem arises when
intelligent agents base their opinions on different viewpoints. The proposed approach
provides an overall picture about the possibly agility of an integrated supply chain. Although,
the dynamic agility index is conveyed in a range of values, the proposed approach ensures
that the decision made in the selection using the fuzzy intelligent agents will not be biased.
4.2 Fuzzy association rules mining based approach
As a second approach, we present a Fuzzy Association Rule Mining based approach to
support the decision makers by enhancing the flexibility in making decisions for evaluating
New Approaches for Modeling and Evaluating Agility in Integrated Supply Chains
251
agility with both tangibles and intangibles attributes/criteria such as Flexibility,
Profitability, Quality, Innovativeness, Pro-activity, Speed of response, Cost and Robustness.
Also, by checking the fuzzy classification rules, the goal of knowledge acquisition can be
achieved in a framework in which evaluation of agility could be established without
constraints, and consequently checked and compared in several details. More details of the
proposed approach can be found in (Jain et al., 2008b).
Mining association rules is one of the most important research problems in data mining.
Many organizations have devoted a tremendous amount of resources to the construction
and maintenance of large information databases over recent decades, including the
development of large scale data warehouses. Frequently the data cannot be analyzed by
standard statistical methods, either because there are numerous missing records, or because
the data are in the form of qualitative rather than quantitative measures.
In many cases, the information contained in these databases is undervalued and
underutilized because the data cannot be easily accessed or analyzed. Some databases have
grown so large that even the system administrators do not always know what information
might be represented or how relevant it might be to the questions at hand. Data sets
commonly contain some an uncertain, particularly incompleteness and inconsistency. One
example is a distributed information environment, where data sets are generated and
collected from different sources, and each source may have different constraints. This can
lead to different interrelationships among the items, thus imposing vagueness on the data
set. Recent years have witnessed many efforts on discovering fuzzy associations, aimed at
coping with fuzziness in knowledge representation and decision support process. Therefore,
the necessity of applying Fuzzy Logic in data mining is due to the following:
• One is that fuzziness is inherent in many problems of knowledge representation, and
the other is that high-level managers or complex decision processes often deal with
generalized concepts and linguistic expressions, which are generally fuzzy in nature.
• Moreover fuzziness may prevail in many other association cases in which impression,
matching, similarity, implication, partial truth or the like is present.
• The modeling of imprecise and qualitative knowledge, as well as the transmission and
handling of uncertainty at various stages are possible through the use of fuzzy sets.
• Fuzzy logic is capable of supporting to a reasonable extent, human type reasoning in
natural form.
A method to find the large itemsets and also an apriori algorithm is proposed in the
literature (Agarwal et al., 1996). However, to find the large itemsets, these algorithms should
scan the database several times. Also, while they generated a candidate itemset, the apriori-
gen function must have exhausted a good deal of time to confirm, if its subsets are large or
not. Further, the well known methods viz. Partial completeness (Srikant and Agarwal 1996),
Optimized association rules (Fukuda et al., 1996) and CLIQUE (Agarwal et al., 1998), divided
the qualitative attributes into many crisps partitions. There were no interactions between the
partitions. However, crisp partitions may be unreasonable for some situations. For example,
if we tried to partition the range (70, 80 $) of the attribute “COST” for a supplier, into two
partitions, then separable point was not different between 75.01 and 74.99$. Hence,
interaction of any of the neighborhood partitions can be promised. Moreover, we considered
that the fuzzy association rules described by the natural language as well as suited for the
thinking of human subjects and will help to increase the flexibility for users in making
decisions or designing the fuzzy systems for evaluating agility. Hence, we use fuzzy
partition method to find the fuzzy association rules.
Supply Chain, The Way to Flat Organisation
252
Fuzzy partitioning in quantitative attributes
A quantitative attribute can be partitioned into ‘L’ various linguistic values (L=2, 3, 4….).
For example, for the attribute ‘cost’ (range from 0 to 100), we describe L=2, L=3 in Figures 3
and 4 respectively.
Also,
COST
L
V
φ
ψ
, can be used to represent a candidate 1-dim fuzzy framework.
Then
COST
L
V
φ
μ
, can be represented as follows:
,() 1 ,0
V
V
L
COST
L
L
y
yMax
φ
φ
ξ
μ
λ
⎧
⎫
−
⎪
⎪
=−
⎨
⎬
⎪
⎪
⎩⎭
Where
(
)
(
)
()
1
1
V
LADADV
AD
Max Min
Min
L
φ
φ
ξ
−
−
=+
−
and
(
)
()
1
L
AD AD
Max Min
L
λ
−
=
−
.
Min
AD
and
Max
AD
are the maximum and minimum of the attribute domain.
Fig. 3. L=2 for quantitative attribute cost for agility
Fig. 4. L=3 for quantitative attribute cost for agility
Fuzzy partitioning in qualitative attributes
Qualitative attributes of a relational database have a finite number of possible values, with
no ordering among several values. For example Flexibility (F
X
), Profitability (P
T
), Quality
(Q
L
), Innovation (I
V
), Pro-activity (P
R
), Speed of Response (S
R
) and Robustness (R
B
)). If the
distinct attribute values are η’ (η’ is finite), then this attribute can only be partitioned by η’
linguistic values. In the agility evaluation considered in this second approach, the linguistic
sentences of each linguistic value defined by the attributed dependability can be stated as
follows:
2,1
FX
L
ow
ψ
=
and
2,2
FX
H
igh
ψ
=
.
0
100
1.0
2,1
CT
ψ
2,2
CT
ψ
Cost
Cost
0
100
1.0
3,1
CT
ψ
3,2
CT
ψ
3,3
CT
ψ
50
New Approaches for Modeling and Evaluating Agility in Integrated Supply Chains
253
Each linguistic value distributed in either quantitative attribute (Cost) or qualitative
attributes (Flexibility, Quality, Innovation, etc.) is considered as a potential candidate 1-dim
fuzzy framework. The succeeding task is how to use these candidate 1-dim fuzzy
frameworks to generate the other large fuzzy frameworks and fuzzy association rules.
Determine large fuzzy frameworks
Once all candidate 1-dim fuzzy frameworks have been generated, we need to determine
how to find the other large fuzzy frameworks and fuzzy association rules. Figure 5 describes
the proposed model for generating fuzzy association rules.
From figure 5, we can see that large fuzzy frameworks and fuzzy association rules are
generated by stages 1 and 2 respectively. To evaluate the agility using fuzzy association
rules, the algorithm is given as:
Algorithm
Given by the decision maker, the input comprises of the following specification:
1. A database containing several quantitative and qualitative attributes for evaluating
agility.
2. The minimum F
Z
S
P
3. The minimum F
Z
C
F
The main algorithm operations comprises of 2 stages:
1. Stage 1: Generate large fuzzy frameworks
2. Stage 2: Generate effective fuzzy association rules and evaluate the agility
Fig. 5. Two-stage model for generating fuzzy association rules
These two stages are described in detail as following:
Stage 1 (comprises of three different steps)
Begin Step 1:
Step1.1: Generate large fuzzy frameworks
Supply Chain, The Way to Flat Organisation
254
Step1.2: Perform fuzzy partition
Step1.3: Scan the database and construct the table comprising of F
Z
F
T
, O
P
T and F
Z
S
P
Step1.4: Generate large 1-dim fuzzy frameworks
Step1.5: Set
1
=
A and eliminate the rows of initials (F
Z
F
T
, O
P
T and F
Z
S
P
)
corresponding to the candidate 1-dim fuzzy frameworks which are not large
Step 1.6: Reconstruct (F
Z
F
T
, O
P
T and F
Z
S
P
)
Step 2: Generate large
A
-dim fuzzy frameworks. Set
A
+1 to
A
. If there is only one (
A
-1)-
dim fuzzy framework, then go to Step 3 within the same stage.
For any two unpaired rows F
Z
F
T
O
P
T F
Z
S
P
[
Δ
] and F
Z
F
T
O
P
T F
Z
S
P
[
σ
], where (
Δ
≠
σ
),
corresponding to large (
A -1)-dim fuzzy frameworks do
Step 2.1: If any two linguistic values are defined in the same linguistic variable
from (F
Z
F
T
[
Δ
] OR F
Z
F
T
[
σ
]) that corresponds to a candidate A -dim fuzzy
framework
∏
, then Discard
∏
, and skip steps 2.2, 2.3 and 2.4. That is, ∏ is not
valid.
Step 2.2: If F
Z
F
T
[
Δ
] and F
Z
F
T
[
σ
] do not share ( 2
−
A ) linguistic terms, then
discard
∏
and skip steps 2.3 and 2.4. That is,
∏
is invalid.
Step 2.3: If there exists integers 1
≤
A
int intint
21
<
<
such that (F
Z
F
T
[ Δ ] OR
F
Z
F
T
[
σ
]) (int
1
)= (F
Z
F
T
[
Δ
] OR F
Z
F
T
[
σ
]) (int
2
)=…= (F
Z
F
T
[
Δ
] OR F
Z
F
T
[
σ
])
(int
A
-1
) = (F
Z
F
T
[
Δ
] OR F
Z
F
T
[
σ
]) (int
A
)=1, then compute [O
P
T (int
1
). O
P
T
(int
2
)… O
P
T (int
A
)] and the fuzzy support F
Z
S
P
of
∏
.
Step 2.4: Add (F
Z
F
T
[
Δ
] OR F
Z
F
T
[
σ
]) to table F
Z
F
T
(O
P
T [int
1
]. O
P
T [int
2
]… O
P
T
[int
A
] to O
P
T and F
Z
S
P
when F
Z
S
P
is ≥ Min F
Z
S
P,
otherwise discard
∏
.
Step 3: Check whether or not any large
A -
dim fuzzy framework is generated.
If any large
A
-dim fuzzy framework is generated,
then go to Step 2 (of stage 1)
else go to Stage 2.
It is noted that the final F
Z
F
T
O
P
T F
Z
S
P
only stores large fuzzy frameworks.
End
Stage 2 (comprises of one step)
Begin Step 1:
Step 1.1: Generate effective fuzzy association rules
Step 1.2: For two unpaired rows, F
Z
F
T
[
Δ
] and F
Z
F
T
[
σ
] (
Δ
<
σ
), corresponding
to a large fuzzy frameworks LAR
Δ
and LAR
σ
respectively do
Step 1.2.1: Produce the antecedent part of the rule. Let
= be the number of nonzero
elements in F
Z
F
T
[
Δ
] AND F
Z
F
T
[
σ
]
Step 1.2.2: If the number of nonzero elements in F
Z
F
T
[
Δ
]
=
= , then LAR
Δ
⊂
LAR
σ
is hold, and the antecedent part of one rule, say R, is generated as LAR
σ
;
otherwise skip Steps 1.3 and 1.4
Step 1.3: Generate the consequence of the rule. Use (F
Z
F
T
[
Δ
] XOR F
Z
F
T
[
σ
]) to
obtain the consequent part of R
L
.
New Approaches for Modeling and Evaluating Agility in Integrated Supply Chains
255
Step 1.4: Check or not whether rule R
L
can be generated F
Z
C
P
(R
L
) ≥ Min F
Z
C
P,
then
R
L
is effective.
End
The efficacy of the presented approach was demonstrated using an illustrative numerical
example in (Jain et al., 2008b).
5. Conclusion and perspectives
The ability to build lean and agile supply chains has not developed as rapidly as anticipated,
because the development of technologies/techniques/approaches to manage such concepts
of lean/agile for integrated supply chains is still under way. Also, due to ill-defined and
vague indicators, which exist within leanness/agility assessment, many measures are
described subjectively by linguistic terms, which are characterized by vagueness and multi-
possibility, and the conventional assessment approaches cannot suitably nor effectively
handle such dynamic situations.
In this chapter, firstly, we present a novel approach to model agility and introduce Dynamic
Agility Index through fuzzy intelligent agents The proposed approach concentrates on the
application of linguistic approximating, fuzzy arithmetic and agent technology is developed
to address the issue of agility measuring, stressing the multi-possibility and ambiguity of
agility capability measurement. Secondly, we discuss a novel approach based on Fuzzy
Association Rule Mining incorporating fuzzy framework coupled with rules mining
algorithm to support the decision makers by enhancing the flexibility in making decisions
for evaluating agility with both tangibles and intangibles characteristics. Also, by checking
the fuzzy classification rules, the goal of knowledge acquisition can be achieved for users.
As a scope for future work, empirical research is required to study the application of the
proposed approaches and to characterize agility in integrated supply chains. Multi-
functional workforce and their performance evaluation should also be studied as a scope for
further research.
6. References
Agarwal, R., Gehrke, J., Gunopulos, D. and Raghavan, P., 1998. Automatic subspace
clustering of high dimensional data for data mining applications, Proceedings of
the ACM SIGMOD International Conference on Management of Data, 94–105.
Agarwal, R., Mannila, H., Srikant, R., Toivonen, H. and Verkamo, A.I., 1996. Fast discovery
of association rules, in: U.M. Fayyad, G. Piatetsky-Shapiro, P. Smyth, R.
Uthurusamy (Eds.), Advances in Knowledge Discovery and Data Mining, AAAI
Press, Menlo Park, 307–328.
Berry, M. and Linoff, G., 1997. Data Mining Techniques: For Marketing, Sales, and Customer
Support, Wiley, New York.
Bhaskaran, S., 1998. Simulation analysis of a manufacturing supply chain, Decision Sciences,
29(3), 633-657.
Blackwell, R. D. and Blackwell, K., 2001. The Century of The Consumer: Converting Supply
Chains Into Demand Chains, Supply Chain Yearbook, McGraw-Hill.