báo cáo hóa học:" Research Article Human Motion Analysis via Statistical Motion Processing and Sequential Change Detection" potx
Bạn đang xem bản rút gọn của tài liệu. Xem và tải ngay bản đầy đủ của tài liệu tại đây (5.18 MB, 16 trang )
Hindawi Publishing Corporation
EURASIP Journal on Image and Video Processing
Volume 2009, Article ID 652050, 16 pages
doi:10.1155/2009/652050
Research Article
Human Motion Analysis via Statistical Motion Processing and
Sequential Change Detection
Alexia Briassouli, Vagia Tsiminaki, and Ioannis Kompatsiaris
Centre for Research and Technology Hellas, Informatics and Telematics Institute, Thermi-Thessaloniki, 57001, Greece
Correspondence should be addressed to Alexia Briassouli,
Received 31 January 2009; Revised 29 May 2009; Accepted 15 July 2009
Recommended by Yoichi Sato
The widespread use of digital multimedia in applications, such as security, surveillance, and the semantic web, has made the
automated characterization of human activity necessary. In this work, a method for the characterization of multiple human
activities based on statistical processing of the video data is presented. First the active pixels of the video are detected, resulting
in a binary mask called the Activity Area. Sequential change detection is then applied to the data examined in order to detect at
which time instants there are changes in the activity taking place. This leads to the separation of the video sequence into segments
with different activities. The change times are examined for periodicity or repetitiveness in the human actions. The Activity Areas
and their temporal weighted versions, the Activity History Areas, for the extracted subsequences are used for activity recognition.
Experiments with a wide range of indoors and outdoors videos of various human motions, including challenging videos with
dynamic backgrounds, demonstrate the proposed system’s good performance.
Copyright © 2009 Alexia Briassouli et al. This is an open access article distributed under the Creative Commons Attribution
License, which permits unrestricted use, distribution, and reproduction in any medium, provided the original work is properly
cited.
1. Introduction
The area of human motion analysis is one of the most
active research areas in computer vision, with applications in
numerous fields such as surveillance, content-based retrieval,
storage, and virtual reality. A wide range of methods has been
developedovertheyearstodealwithproblemslikehuman
detection, tracking, recognition, the analysis of activity in
video, and the characterization of human motions [1].
One large category of approaches for the analysis of
human motions is structure-based, using cues from the
human body for tracking and action recognition [2]. The
human body can be modeled in 2D or 3D, with or without
explicit shape models [3]. Model-based methods include
the representation of humans as stick figures [4], cardboard
models [5], volumetric models [6], as well as hybrid methods
that track both edges and regions [7]. Structure-based
approaches that do not use explicit models detect features
[8], objects [9], or silhouettes [10], which are then tracked
and their motion is classified. Feature-based methods are
sensitive to local noise and occlusions, and the number of
features is not always sufficient for tracking or recognition.
Statistical shape models such as Active Contours have also
been examined for human motion analysis [11], but they are
sensitive to occlusions and require good initialization.
Another large category of approaches extracts cues about
the activity taking place from motion information [12].
One such approach examines the global shape of motion
features, which are found to provide enough information
for recognition [13]. The periodicity of human motions is
used in [14] to derive templates for each action class, but at
a high computational cost, as it is based on the correlation
of successive video frames. In [15], actions are modeled
by temporal templates, that is, binary and grayscale masks
that characterize the area of activity. Motion Energy Images
(MEIs) are binary masks indicating which pixels are active
throughout the video, while Motion History Images (MHIs)
are grayscale, as they incorporate history information, that
is, which pixels moved most recently. This approach is
computationally efficient, but cannot deal with repetitive
actions, as their signatures overwrite each other in the MHI.
In [16], spatiotemporal information from the video is used
to create “space-time shapes” which characterize human
activities in space and time. However, these spatio-temporal
2 EURASIP Journal on Image and Video Processing
Change
point
detection
Kurtosis
for AA
Illumination
changes
Activity area
AA, AHA of
subactivities for
recognition
20 60 100 140
20
40
60
80
100
120
20 60 100 140
20
40
60
80
100
120
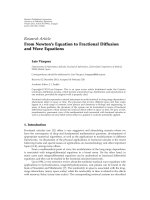
Figure 1: Proposed system: initially, kurtosis-based processing provides the binary Activity Area. Sequential change detection then finds
change points in the video. The subsequences between the change points are processed to find their Activity Areas (AA) and Activity History
Areas (AHA) that are used for activity recognition.
characteristics are specific to human actions, limiting the
method to this domain only. Additionally, the translational
component of motions cannot be dealt with in [16].
Both structure and motion information can be taken into
account for human action analysis using Hidden Markov
Models (HMMs), which model the temporal evolution of
events [17, 18]. However, the HMM approach requires
significant training to perform well [19] and, like all model-
based methods, its performance depends on how well the
chosen model parameters represent the human action.
In this work, a novel, motion-based nonparametric
approach to the problem of human motion analysis is
presented. Since it is not model-based, it does not suffer
from sensitivity to the correct choice of model, nor is it
constrained by it. Additionally, it is based on generally
applicable statistical techniques, so it can be extended to a
wide range of videos, in various domains. Finally, it does
not require extensive training for recognition, so it is not
computationally intensive, nor dependent on the training
data available.
1.1. Proposed Framework. Theproposedsystemisbasedon
statistical processing of video data in order to detect times
and locations of activity changes (Figure 1). The first stage
of the system involves the extraction of the Activity Area,
a binary mask of pixels which are active throughout the
sequence. Only these pixels are processed in the subsequent
stages, leading to a lower computational cost, and also a
reduction in the possibility of errors in the motion analysis.
The extraction of the Activity Area can be considered as
a preprocessing step, which can be omitted for real-time
processing.
The second stage of the system is one of the main novel
points of this framework, as it leads to the detection of
changes in activity in a non ad-hoc manner. In the current
literature, temporal changes in video are only found in the
context of shot detection, where the video is separated into
subsequences that have been filmed in different manners.
However, this separation is not always useful, as a shot may
contain several activities. The proposed approach separates
the video in a meaningful manner, into subsequences
corresponding to different activities by applying sequential
change detection methods. The input, that is, interframe
illumination variations, is processed sequentially as it arrives,
to decide if a change has occurred at each frame. Thus,
changes in activity can be detected in the real time, and the
video sequence can then be separated into segments that
contain different actions. The times of change are further
examined to see if periodicity or repetitiveness is present in
the actions.
After the change detection step, the data in each sub-
sequence between the detected change points is processed
for more detailed analysis of the activity in it. Activity
Areas and a temporally weighted version of them called
the Activity History Areas are extracted for the resulting
subsequences. The shape of the Activity Areas is used
for recognition of the activities taking place: the outline
of each Activity Area is described by the Fourier Shape
Descriptors (see Section 5), which are compared to each
other using the Euclidean distance, for recognition. When
different activities have a similar Activity Area (e.g., a person
walking and running), the Activity History Areas (AHAs)
are used to discriminate between them, as they contain
information about the temporal evolution of these actions.
This is achieved by estimating the Mahalanobis distance
between appropriate features of the AHAs, like their slope
and magnitude (see Section 5 for details). It is important
to note that Activity History Areas would have the same
limitations as MHIs [15] if they were applied on the entire
video sequence: the repetitions of an activity would overwrite
the previous activity history information, so the Activity
History Area would not provide any new information. This
issue is overcome in the proposed system, as the video is
already divided into segments containing different activities,
so that Activity History Areas are extracted for each repeating
component of the motion separately, and no overwriting
takes place.
2. Motion Analysis: Activity Area
In the proposed system, the interframe illumination varia-
tions are initially processed statistically in order to find the
Activity Area, a binary mask similar to the MEIs of [15],
which can be used for activity recognition. Unlike the MEI,
the Activity Areas are extracted via higher-order statistical
processing, which makes them more robust to additive noise
EURASIP Journal on Image and Video Processing 3
0
0.5
1
1.5
2
2.5
3
3.5
4
4.5
×10
7
0 200 400 600 800 1000 1200 1400
(a)
0
1
2
3
4
5
6
7
8
9
10
×10
5
0 2000 4000 6000 8000 10000 12000 14000 16000 18000
(b)
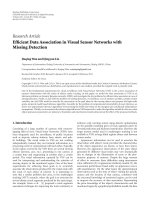
Figure 2: Kurtosis estimates from a real video of a person boxing for (a) active and (b) static pixels.
and small background motions. Interframe illumination
variations, resulting from frame differences or optical flow
estimates (both referred to as “illumination variations” in the
sequel), can be mapped to the following two hypotheses:
H
0
: v
0
k
(
r
)
= z
k
(
r
)
,
H
1
: v
1
k
(
r
)
= u
k
(
r
)
+ z
k
(
r
)
,
(1)
where v
i
k
(r), i = 0, 1 are the illumination variations for a
static/active pixel, respectively, at frame k and pixel
r.The
term z
k
(r) corresponds to measurement noise and u
k
(r)is
caused by pixel motion. The background is considered to
be static, so only the pixels of moving objects correspond to
H
1
. The distribution of the measurement noise is unknown,
however, it can be sufficiently well modeled by a Gaussian
distribution, as in [20, 21]. In literature, the background is
often modeled by mixtures of Gaussian distributions [22],
but this modeling is computationally costly and not reliable
in the presence of significant background changes (e.g., a
change in lighting), as it does not always adapt to them
quickly enough. The method used here is actually robust
to deviations of the data from the simple Gaussian model
[23, 24], so even in such cases, it provides accurate, reliable
results at a much lower computational cost.
The illumination variations of static pixels are caused by
measurement noise, so their values over time should follow
a Gaussian distribution. A classical test of data Gaussianity is
the kurtosis [24], which is equal to zero for Gaussian data,
anddefinedas
kurt
y
= E
y
4
− 3
E[y
2
]
2
.
(2)
In order to find the active pixels, that is, Activity Areas, the
illumination variations at each pixel are accumulated over
the entire video and their kurtosis is estimated from (2). Even
if in practice the static pixels do not follow a strictly Gaussian
distribution, their kurtosis is still significantly lower (by
orders of magnitude) than that of active pixels. This is
clearly obvious in the experimental results, where the regions
of activity are indeed correctly localized, as well as in the
simulations that follow.
As a practical example with a real sequence, we estimate
the kurtosis of all active pixels and that of all static pixels,
taken from the real video of a person boxing (Section 6.2),
where the ground truth for the active and static pixels is
extracted manually. The kurtosis values of active and static
pixels are plotted in Figure 2, where it can be seen that the
active pixels’ kurtosis is significantly higher than that of the
static pixels; note that the y-axis on Figure 2(a) is from 0 to
4.5
×10
7
, while on Figure 2(b),itsrangeisfrom0to10
6
(for
clarity of presentation). In the static pixels of Figure 2(b),
the kurtosis is almost zero in almost all of them. It obtains
higher values in pixels 8000–10000, most likely due to the
presence of local noise, but even these values are much lower
than those of the active pixels. Indeed, the mean value of
the kurtosis for the active pixels is found to be 1.34
× 10
6
and for the static ones it is equal to 669.54. Results like this
motivate us to compare the relative values of pixels’ kurtosis
in practice, in order to determine if a pixel is active or static,
rather than their absolute value.
A very common model for the background is the Mixture
of Gaussians (MoG) [25], so we compare the kurtosis of
data following a Gaussian, an MoG, and an Exponential
distribution. The exponential data is chosen as it is clearly
non-Gaussian and will provide a measure of comparison for
the other data. Monte Carlo simulations take place with 500
sample sets of data from each distribution, of length 5000
each. The kurtosis estimated for each sample set and for each
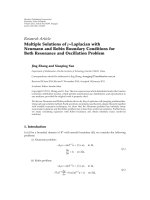
distribution is shown in Figure 3 where it can be seen that
the Gaussian and MoG data have significantly lower kurtosis
values than the Exponential (non-Gaussian) data. Indeed,
the average kurtosis for the Gaussian data is
−0.004, for
the MoG it is
−0.0034, and for the Exponential it is 5.76.
Consequently, the kurtosis can reliably discriminate between
active and static pixels even for background data that is
modeled by an MoG instead of by a simple Gaussian.
4 EURASIP Journal on Image and Video Processing
0
5
10
15
20
25
0 100 200 300 400 500
(a)
0
5
10
15
20
25
0 100 200 300 400 500
(b)
5
10
15
20
25
0 100 200 300 400 500
(c)
Figure 3: Kurtosis estimates for data following a Gaussian, an MoG, and an Exponential distribution.
(a) (b)
120
100
80
60
40
20
20 60 100 140
(c)
120
100
80
60
40
20
20 60 100 140
(d)
Figure 4: Person running: (a) Frame 10, (b) AA. AHA for motion: (c) to the right, (d) to the left. The AHA has higher values in the regions
of the Activity Area that were active most recently, represented by warm colors, and lower values in pixels that were active in the past,
corresponding to cooler colors.
3. Motion Analysis: Activity History Area
As mentioned in Section 1.1, the Activity Area is not always
sufficient for recognizing activities, as some actions can lead
to Activity Areas with very similar shapes. For example,
different translational motions like jogging, running, and
walking have similar Activity Areas, although they evolve
differently in time. Thus, information about their temporal
evolution should be used to discriminate amongst them.
The temporal evolution of activities is captured by the
Activity History Area (AHA), which is similar to the Motion
History Area of [15], but extracted using the kurtosis, as in
Section 2, rather than straightforward frame differencing. If
the Activity Area value (binarized kurtosis value) on pixel
r
is AA(
r)atframet, the AHA is defined as
AHA
(
r, t
)
=
⎧
⎨
⎩
τ,ifAA
(
r
)
= 1;
max
(
0, AHA
(
r, t −1
)
− 1
)
, else.
(3)
Essentially, the AHA is a time-weighted version of the
Activity Area, with higher weights given to the pixels which
were active more recently. This introduces information about
an activity’s evolution with time, which can be particularly
helpful for the classification of different actions. As an
example, Figure 4 shows the Activity Area and AHA of a
person running to the right and the same person running
to the left. It is obvious that the direction of motion is
captured by the AHA, which obtains higher values in the
most recently activated pixels, but not by the Activity Area,
which is a binary mask, and, therefore, can only provide
spatial localization. In Figure 4, the AHA values have warmer
colors (darker in grayscale) for the most recently activated
pixels, while cooler colors (lighter in grayscale) represent
pixels that were active in the past.
4. Sequential Change Detection
One of the main novel points of the proposed system is
the detection of the times at which the activity taking
place changes. The input data for the change detection is
a sequence of illumination variations from frame k
0
to k,
that is, v
k
0
,k
= [v
k
0
, v
k
0
+1
, ,v
k
]. If only the pixels inside the
Activity Area are being examined, the data from each frame
k
∗
contains the illumination variations of that frame’s pixels,
for the pixels inside the Activity Area. Thus, if the activity
area contains N
a
pixels, we have v
k
∗
= [v
k
∗
(1), , v
k
∗
(N
a
)].
In this work we examine the case where only the pixels inside
the Activity Area are processed. It is considered that the data
follows a distribution f
0
before a change occurs, and f
1
after
the change, at an unknown time instant k
ch
. This is expressed
by the following two hypotheses:
H
0
: v
k
0
,k
∼ f
0
,
H
1
: v
k
0
,k
∼ f
1
.
(4)
At each frame k, v
k
0
,k
is an input into a test statistic to
determine whether or not a change has occurred until then,
EURASIP Journal on Image and Video Processing 5
as detailed in Section 4.1. If a change is detected, only the data
after frame k is processed to detect new changes, and this is
repeated until the entire video has been examined.
4.1. Cumulative Sum (CUSUM) for Change Detection. The
sequential change detection algorithm [26] uses the log-
likelihood ratio (LLRT) of the input data as a test statistic.
For the detection of a change between frames k
0
and k,we
estimate
T
k
= LLRT
k
f
1
||f
0
=
ln
f
1
v
k
0
,k
f
0
v
k
0
,k
=
ln
k
i=k
0
f
1
(
v
i
)
f
0
(
v
i
)
=
k
i=k
0
ln
f
1
(
v
i
)
f
0
(
v
i
)
,
(5)
where it has been assumed that the frame samples
v
i
are identically independently distributed (i.i.d.) under each
hypothesis, so that f
H
(v
k
0
,k
) =
k
i
=k
0
f
H
(v
i
), H = 0, 1.
Similarly, it is assumed that the illumination variations of
the pixels inside the Activity Area are i.i.d., so f
H
(v
i
) =
Na
n
=1
f
H
(v
i
(n)), H = 0, 1, i = k
0
, ,k.
Pixels in highly textured areas can be considered to have
i.i.d. values of illumination variations, as they correspond
to areas of the moving object with a different appearance,
which may be subject to local sources of noise, shadow,
or occlusion. In homogeneous image regions that move
in the same manner this assumption does not necessarily
hold, however, even these pixels can be subject to local
sources of noise, which remove correlations between them.
The approximation of the data distribution for data that
is not considered i.i.d. is very cumbersome, making this
assumption necessary for practical purposes as well. Such
assumptions are often made in the change detection litera-
ture to ensure tractability of the likelihood test.
Under the i.i.d. assumption, the test statistic of (5)
obtains the recursive form [26]:
T
k
= max
0, T
k−1
+ln
f
1
(
v
k
)
f
0
(
v
k
)
,(6)
where
v
k
= [v
k
(1), , v
k
(N
a
)] is the data from the active
pixels in the current frame k. Then, (5) can also be written as
T
k
=
k
i=k
0
N
a
n=1
ln
f
1
(
v
i
(
n
))
f
0
(
v
i
(
n
))
,
(7)
and(6)becomes
T
k
= max
⎛
⎝
0, T
k−1
+
N
a
n=1
ln
f
1
(
v
k
(
n
))
f
0
(
v
k
(
n
))
⎞
⎠
. (8)
A change is detected at this frame when the test statistic
becomes higher than a predefined threshold. Unlike the
threshold for sequential probability likelihood ratio testing
[27, 28], the threshold for the CUSUM testing procedure
cannot be determined in a closed form manner. It has been
proven in [29] that the optimal threshold for the CUSUM
test for a predefined false alarm γ is the threshold that
leads to an average number of changes equal to γ under
H
0
, that is, when there are no real changes. In the general
case examined here, the optimal threshold needs to be
estimated empirically from the data being analyzed [30]. In
Section 6 we provide more details about how we determine
the threshold experimentally.
In practice, illumination variations of only one pixel
over time do not provide enough samples to detect changes
effectively, so the illumination variations of all active pixels
in each frame are used. If an Activity Area contains N
a
pixels,
this gives N
a
×(k −k
0
+1) samples from frame k
0
to k,which
leads to improved approximations of the data distributions,
as well as better change detection performance.
4.2. Data Modeling. As (6) shows, in order to implement the
CUSUM test, knowledge about the family of distributions
before and after the change is needed, even if the time of
change itself is not known. For the case where only the
pixels in the Activity Area are being examined, it is known
that they are active, and hence do not follow a Gaussian
distribution (see Section 2). The distribution of active pixels
over time contains outliers introduced by a pixel’s change in
motion, which lead to a more heavy-tailed distribution than
the Gaussian, such as the Laplacian or generalized Gaussian
[31]. The Laplacian distribution is given by
f
(
x
)
=
1
2b
exp
−
x −μ
b
,(9)
where μ is the data mean and b
= σ/
√
2 is its scale, for
variance σ
2
. The tails of this distribution decay more slowly
than those of the Gaussian, since its exponent contains an
absolute difference instead of the difference squared. Its
tails are consequently heavier, indicating that data following
the Laplace distribution contains more outlier values than
Gaussian data. The test statistic of (7)forN data samples
can then be written as
T
k
=
k
i=k
0
N
a
n=1
ln
b
0
b
1
exp
−
v
i
(
n
)
− μ
1
b
1
+
v
i
(
n
)
− μ
0
b
0
=
NN
a
ln
b
0
b
1
+
k
i=k
0
N
a
n=1
−
v
i
(
n
)
− μ
1
b
1
+
v
i
(
n
)
− μ
0
b
0
.
(10)
In order to verify the validity of the Laplacian approxi-
mation of the data, the illumination variations are modeled
by the Gaussian and Laplacian distributions, and their
accuracy is compared. The generalized Gaussian model
is not examined, as its approximation is computationally
costly and hence impractical. Figure 5 contains plots showing
the distribution of the actual data in comparison with its
approximation by a Gaussian and Laplacian distribution.
The Root Mean Square error (RMS) between the actual
empirical data distribution and the corresponding Gaussian
and Laplacian model is presented in Ta bl e 1 for several
videos, where it can be seen that the Laplacian distribution
6 EURASIP Journal on Image and Video Processing
provides a better fit. Modeling experiments are conducted
on all the videos used in the experiments, but have not
been included in Ta bl e 1 for reasons of space and readability.
The mean RMS estimated from all the video sequences
examined is 0.0915 for the Gaussian and 0.0270 for the
Laplacian model, justifying the choice of the latter as a better
fit for our data. The data could be modeled even more
accurately by heavier tailed distributions, such as alpha-
stable distributions [32]. However, these do not exist in
closed form, so they cannot be used in the likelihood ratio
test. A closed form distribution from the alpha-stable family,
namely, the Cauchy, describes the data well in the DCT
domain [33], but the Laplacian has been shown to better
describe quantized image data [34].
5. Recognition
The proposed system detects when activities change in a
video, based on sequential processing of the interframe
illumination variations. After change points are detected, the
subsequences resulting inbetween them are further processed
in order to characterize and recognize the activities taking
place in them. We focus on the case where there is a
preprocessing stage that extracts the active pixels, as this
reduces the system’s overall computational cost and increases
its reliability, since it does not look for activity changes in
static pixels. The complete system consists of the following
stages.
(1) Activity areas are extracted to find the active pixels.
(2) The illumination variations of the pixels inside the
activity area over time are estimated.
(3) Sequential change detection is applied to the illumi-
nation variations, to detect changes.
(4) If the change points are (nearly) equidistant, the
motion is considered to be (near) periodic.
(5) The Activity Areas and Activity History Areas for
the frames (subsequences) between change points are
extracted. The shape of the Activity Areas and the
direction and magnitude of motion are derived from
the Activity History Area, to be used for recognition.
(6) False alarms are removed: if motion characteristics
of successive subsequences are similar, those subse-
quences are merged and the change point between
them is deleted.
(7) Multiple Activity Areas and Activity History Areas
originating from the same activity are detected and
merged if their motion and periodicity characteristics
coincide.
(8) Shape descriptors of the resulting Activity Areas and
motion information from the Activity History Areas
are used for recognition.
The detection of different activities between change points
increases the usefulness and accuracy of the system for
many reasons. The proposed system avoids the drawback
of “overwriting” that characterizes MHIs that are extracted
using the entire sequence. In periodic motions, for example,
where an activity takes place from left to right, then from
right to left, and so on, all intermediate changes of direction
are lost in the temporal history image if the all video
frames are used. This is overcome in our approach, as
Activity History Areas are estimated over segments with one
kind of activity, giving a clear indication of the activity’s
direction and temporal evolution. This also allows the
extraction of details about the activity taking place, such
as the direction of translational motions, periodicity of
motions like boxing, or of more complex periodic motions,
containing similarly repeating components (see Section 6.2).
Finally, the application of recognition techniques to the
extracted sequences would not be meaningful if the sequence
had not been correctly separated into subsequences with one
activity each.
Both the shape of the Activity Area and motion infor-
mation from the Activity History Area are used for accurate
activity recognition, as detailed in the sections that follow.
5.1. Fourier Shape Descriptors of Activity Area. The shape
of the Activity Areas can be described by estimating the
Fourier Descriptors (FDs) [35] of their outlines. The FDs
are preferred as they provide better classification results
than other shape descriptors [36]. Additionally, they are
rotation, translation, and scale invariant, and inherently
capture some perceptual shape characteristics: their lower
frequencies correspond to the average shape, while higher
frequencies describe shape details [36].TheFDsarederived
from the Fourier Transform (FT) F
1
, F
2
, ,F
N
of each
shape outline’s boundary coordinates. The DC component
F
1
is not used, as it only indicates the shape position. All
values are divided by the magnitude of
|F
1
| to achieve scale
invariance, and rotation invariance is guaranteed by using
their magnitude. Thus, the FDs are given by
f =
|
F
2
|
|F
1
|
,
|F
3
|
|F
1
|
, ,
|F
N
|
|F
1
|
.
(11)
Only the 20 first terms of the FD, corresponding to the 20
lowest frequencies, are used in the recognition experiments,
as they capture the most important shape information. The
comparison of the FDs for different activities takes place
by estimating their Euclidean distance, since they are scale,
translation, and rotation invariant. When L
= 20 elements
of the FDs are retained, the Euclidean distance between two
FDs
f
A
, f
B
is given by
d
Eucl
=
L
k=1
f
A
(
k
)
− f
B
(
k
)
,
(12)
and each activity is matched to that with the shortest
Euclidean distance.
5.2. Activity History Area for Motion Magnitude and Direction
Detection. Although the shape of Activity Areas is charac-
teristic of many activities and is effectively used for their
recognition, there also exist categories of activities with very
similar Activity Areas. A characteristic example commonly
EURASIP Journal on Image and Video Processing 7
0
0.1
0.2
0.3
0.4
0.5
0.6
0.7
0.8
0.9
1
0 20 40 60 80 100
Gauss model
Empirical
distribution
Laplace
model
(a)
0
0.1
0.2
0.3
0.4
0.5
0.6
0.7
0.8
0.9
1
0 20 40 60 80 100
Gauss model
Empirical
distribution
Laplace
model
(b)
0
0.1
0.2
0.3
0.4
0.5
0.6
0.7
0.8
0.9
1
0 20 40 60 80 100
Gauss model
Empirical
distribution
Laplace
model
(c)
0
0.1
0.2
0.3
0.4
0.5
0.6
0.7
0.8
0.9
1
0 20 40 60 80 100
Gauss model
Empirical
distribution
Laplace
model
(d)
0
0.1
0.2
0.3
0.4
0.5
0.6
0.7
0.8
0.9
1
0 20 40 60 80 100
Gauss model
Empirical
distribution
Laplace
model
(e)
0
0.1
0.2
0.3
0.4
0.5
0.6
0.7
0.8
0.9
1
0 20 40 60 80 100
Gauss model
Empirical
distribution
Laplace
model
(f)
Figure 5: Empirical distribution, Laplace and Gaussian data modeling for: (a) Daria Jump, (b) Denis Jack, (c) Eli Jump in place, (d) Moshe
Run, (e) Daria Walk, (f) Moshe Skip.
Table 1: Gaussian and laplace modeling errors.
Model/Video Lyova Run Eli Run Daria Run Denis Run Moshe Run Shahar Run Lena2 Run
Gaussian 0.0913 0.0976 0.1077 0.0898 0.1010 0.0975 0.1128
Laplace 0.0239 0.0265 0.0344 0.0253 0.0310 0.0295 0.0409
Model/Video Lena1 Run Ira Run Ido Run Daria Jack Denis Jack Eli Jack Ido Jack
Gaussian 0.1206 0.0801 0.0933 0.1026 0.1031 0.1105 0.0879
Laplace 0.0433 0.018 0.0253 0.0371 0.0333 0.042 0.0257
Model/Video Ira Jack Lena Jack Lyova Jack Moshe Jack Shahar Jack Daria Jump Denis Jump
Gaussian 0.1129 0.0864 0.108 0.1081 0.1057 0.0815 0.0734
Laplace 0.047 0.0307 0.0359 0.0368 0.0383 0.0179 0.0153
Model/Video Eli Jump Ido Jump Ira Jump Lena Jump Lyova Jump Moshe Jump Shahar Jump
Gaussian 0.094 0.0827 0.0680 0.0956 0.0788 0.0947 0.0984
Laplace 0.0228 0.0237 0.0219 0.0239 0.0207 0.027 0.0234
encountered in practice is that of translational motions,
whose Activity Area covers a linear region (horizontally,
vertically, or diagonally). It is seen in Figures 6, 14(e)–
14(g) that this shape is linear for different translational
motions, such as walking or running, so it is insufficient
for discriminating amongst them. However, this linearity
property can be used to separate translations from other
kinds of motions. The linearity can be derived from its mean
in the horizontal direction. Activities that do not contain
a translational component, such as waving, lead to a local
concentration of pixel activity, which makes sense since they
take place over a confined area (last image pairs of Figure 6).
In order to separate translational motions from each
other, the Activity History Areas (Figure 7)areused.
Motion direction and magnitude information is extracted
by estimating the mean of the Activity History Area in
the horizontal and vertical directions. In this work all
translational motions are horizontal, so only the horizontal
mean of the AHA is estimated. This mean forms a line whose
slope provides valuable information about the direction and
magnitude of motion.
(i) The sign of the slope shows the direction of motion: it
is negative for a person moving to the left and positive
for motion to the right.
(ii) The magnitude of the slope is inversely proportional
to the velocity, that is, higher magnitudes correspond
to slower activities.
The values of the Activity History Area are higher in
pixels that were active recently; here the the pixel locations
8 EURASIP Journal on Image and Video Processing
(a)
1
1.5
2
2.5
3
3.5
4
4.5
5
0 40 80 120 160
(b)
(c)
1
1.5
2
2.5
3
3.5
4
4.5
5
0 40 80 120 160
(d)
(e)
0
0.05
0.1
0.15
0.2
0.25
0.3
0.35
0.4
0.45
0 40 80 120 160
(f)
Figure 6: Activity Area outlines and their mean in horizontal direction for walking, running, waving. The mean AA outline is linear for
translational motions.
120
100
80
60
40
20
20 60 100 140
(a)
0
5
10
15
20
25
30
35
40
45
0 50 100 150
(b)
120
100
80
60
40
20
20 60 100 140
(c)
0
2
4
6
8
10
12
14
0 20 40 60 80 100120140
(d)
Figure 7: Activity History Areas and their means for translational motions to the left and right: walking left, running right. Direction and
magnitude information is included in these areas.
correspond to the horizontal axis, and the slope is estimated
by
slope
=
t
last
− t
first
x
last
− x
first
,
(13)
where t
first
is the frame at which the first horizontal pixel
(the leftmost x location here) is activated, and t
last
the frame
where the last horizontal pixel is activated (the rightmost x
location). This can be seen in Figures 8(a), 8(b) for motions
to the right and left, respectively: motion to the right leads
to a positive slope since the rightmost pixel is activated at the
most recent frame, while motion to the left leads to a negative
slope.
The Activity History Area of a fast activity (e.g., running)
contains a small range of frames (from t
first
to t
last
), since
it takes place in a short time, whereas the Activity History
Area of a slow activity occurs during more frames, since
the motion lasts longer. In order to objectively discriminate
between fast and slow actions, the same number of pixels
must be traversed in each direction. Thus, in (13), x
last
–x
first
is the same for all activities, and t
last
–t
first
has high values
for slow actions and low values for fast ones. Consequently,
higher magnitudes of the slope of (13) correspond to slower
motions and lower magnitudes correspond to faster ones.
Table 2: Slope magnitude of mean AHA for baseline Translational
Videos.
Motion Run Jog Walk
AHA slope 0.1192±0.0358 0.1651±0.0455 0.27248±0.054625
The activities examined are horizontal walking, jogging,
running, and cover the same distance, so that the slope
magnitude can be objectively used to discriminate among
them. For comparison, the Activity History Area is extracted
from a set of baseline translation videos, and its horizontal
mean is estimated. The slope of the mean is found from (13)
and its magnitude is given in Tab le 2 for each activity. As
expected, the slope has higher values for slower motions.
For the classification of a test video, its Activity History
Area is extracted, and its mean is estimated. The sign of its
slope indicates whether the person is moving to the right or
left and its magnitude is compared to the average slope of the
three baseline categories of Tab le 2 using the Mahalanobis
distance. For a baseline set with mean μ
= [μ
1
, ,μ
N
]
and covariance matrix Σ, the Mahalanobis distance of
data y
= [y
1
, , y
N
]fromitisdefinedasd
Mahal
(y) =
(y − μ)
T
Σ
−1
(y − μ). The Mahalanobis distance is used as
EURASIP Journal on Image and Video Processing 9
t
last
(last frame)
t
first
(first frame)
x
first
x
last
Slope > 0
Horizontal
direction x
(a)
t
last
(last frame)
t
first
(first frame)
x
first
x
last
Slope < 0
Horizontal
direction x
(b)
Figure 8: Mean of Activity History Area in horizontal direction for motion to the right and left.
a distance metric as it incorporates data covariance, which is
not taken into account by the Euclidean distance. In this case
the data is one dimensional (the slope) so its variance is used
instead of the covariance matrix.
6. Experiments for Recognition
Experiments with real videos take place to examine the per-
formance of the change detection module. These videos can
be found on />human-activity-recognition, so that the reader can observe
the ground truth and verify the validity of the experiments.
The ground truth for the times of change is extracted
manually and compared to the estimated change points to
evaluate the detection performance.
We model the data by a Laplacian distribution
(Section 4.2) to approximate f
0
and f
1
of (5), which are
unknown and need to be estimated from the data v
k
0
,k
at each
time k. The distribution of the “current” data f
0
is extracted
from the first w
0
samples of v
k
0
,k
, in order to take into account
samples that belong to the old distribution, while f
1
is
approximated using the most recent w
1
samples. There could
be a change during the first w
0
samples used to approximate
f
0
, but there is no way to determine this a priori, so there is
the implicit assumption that no change takes place in the first
w
0
frames. Currently, there is no theoretically founded way to
determine the optimal length of the windows w
0
and w
1
,as
stated in the change detection literature [37]. Consequently,
the best possible solution is to empirically determine the
window lengths that give the best change detection results for
certain categories of videos, and use them accordingly. After
extensive experimentation, w
0
= 10 and w
1
= 5arefoundto
give the best detection results with the fewest false alarms, for
detecting a change between successive activities. For periodic
motions, the changes occur more often, so smaller windows
are used, namely w
0
= w
1
= 4.
At each frame k, the test statistic T
k
is estimated and
compared against a threshold in order to determine whether
or not a change has occurred. Due to the sequential nature
of the system, there is no closed form expression for this
threshold, so an optimal value cannot be determined for it
apriori[38]. It is found empirically that for videos of human
motions like the ones examined here, the threshold which
leads to the highest detection rate with the fewest false alarms
is given by
η
opt
= μ
T
+2.3 · σ
T
,
(14)
where μ
T
and σ
T
are the mean and standard deviation of the
test statistic T
k
until frame k.
6.1. Experiments with Translational Motions. In this sec-
tion, experimental results for videos containing transla-
tional motions, namely, walking, jogging, and running,
are presented. Characteristic frames of some videos, the
corresponding activity area and the likelihood ratio over
time are shown in Figure 9 and all the videos examined can
be seen on />human-activity-recognition.Theactivityareascorrectlycap-
ture the pixels that are active in each video and the likelihood
ratio values change at the time when the actual change
occurs. In total, change points are correctly detected for 16
videos with translational motions, as shown in Ta b le 3 ,but
for three of the videos false alarms are also detected. These
false alarms are easily eliminated by examining the average
motion and its variance for each extracted subsequences
as they do not change significantly before and after a false
alarm. In this manner, no false alarms remain and only the
correct change points are detected, shown in bold fonts in
Ta bl e 3 (for the cases where there were false alarms). In the
table, LR indicates that an activity takes place from left to
right, HD means “horizontally-diagonally”, LRL is left-right-
left and LRLR is left-right-left-right. The numbers (e.g.,
Jog LR1) distinguish between different videos of the same
activity. The last two videos, Walk LRL and Walk LRLR have
two and three change points, respectively, which are correctly
detected in both cases, with no false alarms.
Figures 9(e)–9(i) contains frames from a walking
sequence, where the pixels around the person’s neck are
mistaken for static pixels, leading to two Activity Areas, one
corresponding to the head and one to the body, shown in
Figures 9(f), 9(g). When there are more than one Activity
Area, the sequential testing is applied to each Activity Area
separately, since there could be more than one different
10 EURASIP Journal on Image and Video Processing
(a) (b) (c)
12
10
8
6
4
2
×10
3
10 20 30 40 50 60
(d)
(e) (f) (g)
22
18
14
10
6
2
×10
2
20 40 60 80 100 120
(h)
0
5
10
15
×10
2
0 40 80 120
(i)
Figure 9: (a), (b) Frames of person jogging left, right, (c) Activity Area, (d) likelihood ratio values for each active pixel, over all frames, (e)
person walking left, right, (f), (g) activity areas for head and body, (h) likelihood ratio (LRT) values for each active pixel (in the body area),
over all frames, (i) LRT values for all pixels (in the body area), showing change times.
Table 3: Change points for videos with translational motions.
Video Jog LR 1 Jog LR 2 Run LR 1 Run LR 2 Walk HD Walk LR 1 Walk LR 2 Walk LR 3
Changepoints3533232057586118,30,89
Video Walk LR 4 Walk LR 5 Walk LR 6 Walk LR 7 Walk LR 8 Walk LR 9 Walk LRL Walk LRLR
Change points 37-93-134 58-71 49 67 74 70 58, 102 35, 69, 104
activity taking place. In this example, the area corresponding
to the head is too small to provide enough samples for a
reliable estimate of the change-point, so only the likelihood
ratio values for the Activity Area corresponding to the body
of the person with the coat are shown in Figures 9(h), 9(i).
Even in this case, the change points are correctly found.
6.2. Experiments with Nontranslational Motions. Combina-
tions of nontranslational motions are examined in this
section. The first video contains a person clapping, fol-
lowed by a person boxing, and the second shows a per-
son waving followed by a person clapping (see Figure 10
and />activity-recognition). The resulting Activity Areas contain
the pixels that move in both activities and the likelihood
ratio values estimated over all active pixels lead to correct
change point detection. For the clapping-boxing sequence,
the correct change point is detected at frame 99, but there
are also false alarms at frames 65, 85, 123,159, 176,200,
introduced because of changes in the individual repeating
activities (clapping only or boxing only). As in Section 6.1,
these false alarms are eliminated by simply estimating
the motion characteristics of the extracted subsequences,
which undergo significant change only at frame 99. In the
handwaving-handclapping video, the true change point is
found at frame 127, but false alarms are also detected
at frames 11, 35, 56, 75, 89, 141, 225, which are removed as
before, leading to the detection of only the correct change
point. It should be emphasized that the relative height
of the likelihood ratio values is not taken into account
for the elimination of false alarms. Instead, the motion
characteristics of the resulting subsequences are measured,
as explained earlier.
6.2.1. Periodic Motions. The values of the data windows
w
0
, w
1
, chosen for approximating f
0
, f
1
,respectively,affect
the resolution of the system. When w
0
, w
1
have higher values,
they detect changes at a coarse granularity, but at the cost
of missing small changes inside each individual activity. In
this section, we present experiments where these windows
are set to w
0
= w
1
= 4, enabling the detection of changes
in repeating activities with good accuracy.
Figure 11 shows frames of the videos examined, along
with the corresponding activity areas, and log-likelihood
ratio values. For the Boxing and Jumping in Place videos,
two activity areas are extracted, one corresponding to the
upper part of the human’s body and one to the legs. This
is because the middle area of the body is relatively static.
For those cases, each activity area is examined separately: the
resulting change points for the two activity areas coincide,
and the motion characteristics between these change points
are the same, so these areas are (correctly) assigned to the
EURASIP Journal on Image and Video Processing 11
(a) (b) (c)
2.5
2
1.5
1
0.5
×10
3
20 60 100 140 180
(d)
0
1
2
3
4
5
6
7
8
9
10
×10
3
0 50 100 150 200 250
(e)
(f) (g) (h)
2.5
2
1.5
1
0.5
×10
3
50 100 150 200 250
(i)
0
0.5
1
1.5
2
2.5
3
×10
3
0 50 100 150 200 250 300
(j)
Figure 10: Handclapping-boxing video: (a) frame 30, (b) frame 100, (c) Activity Area of clapping and boxing, (d) likelihood ratio estimated
for each pixel, (e) likelihood ratio values for all pixels, handwaving-handclapping video: (f) frame 10, (g) frame 254, (h) Activity Area, (i)
likelihood ratio estimated for each pixel, (j) likelihood ratio values for all pixels, used for change detection.
0 50 100 150 200 250
0
100
200
300
400
500
600
0 50 100 150 200 250
0
0.5
1
1.5
2
2.5
3
3.5
4
0 10 20 30 40 50 60 70
0 10 20 30 40 50 60
0
100
200
300
400
500
0 102030405060
0
20
40
60
80
100
120
140
160
180
0 100 200 300 400
×10
3
0
0.5
1
1.5
2
2.5
3
3.5
4.5
4
×10
3
0
0.5
1
1.5
2
2.5
×10
3
Figure 11: First row: boxing, second row: jumping, third row: jumping in place, fourth row: composite walking sequence. Each row shows
video frames, the activity area, likelihood ratio values for all pixels.
12 EURASIP Journal on Image and Video Processing
20 40 60 80 100120 140 20 40 60 80 100 120 140
2
4
6
8
10
12
14
1
2
3
4
5
6
7
8
9
0 50 100 150
0
0.5
1
1.5
2
2.5
0 50 100 150
0
1
2
3
4
5
6
7
8
9
10 20 30 40 50 60 70 80
0.5
1
1.5
2
2.5
3
3.5
0102030405060708090
0
50
100
150
200
250
300
10 20 30 40 50 60 70 8090
1
2
3
4
5
6
0 20406080 100
0
50
100
150
200
250
300
×10
3
×10
3
×10
3
×10
3
×10
3
×10
7
Figure 12: Videos with multiple Activity Areas: first two rows, people walking, two separate activity areas, third row, crossing ladies, fourth
row, beach. The activity area from rows 3 and 4 contains both motions, but change points are correctly found. Each row shows video frames,
the activity area, likelihood ratio values, and likelihood ratio values for all pixels.
Table 4: Change points for periodic motions, extracted period.
Video Change points Period
Box 8, 13, 18, 23, , 203, 208, 213 5
Jump 10, 15, 20, 15, , 46, 51,56 5
Jump in place 6, 11, 18, 26,34, 42, 50 8
Walk 22,19, 56,44, 22, 19, 56,44, 22, 19, 56,44 3
same activity. Tab le 4 shows the detected change points for
each video and the resulting period. The last video is more
complex, containing 3 identical subsequences of a person
walking left-right-left: all change points are found, and form
a pattern that repeats 3 times.
6.3. Experiments with Multiple Activity Areas. Avideoof
two people performing different activities at different, but
overlapping, time intervals, is examined (Figure 12,top
two rows). The Activity Area consists of two distinct
binary masks, corresponding to the different activities, so
the sequential change detection takes place in each area
separately. For both Activity Areas, the likelihood ratios for
all pixels inside them correctly locate the times of change
at frames 53, 81, 97 for the person walking on the left,
and at frame 33 for the person walking on the right. Two
more complicated videos, with multiple but overlapping
activity areas are examined (Figure 12,lasttworows).In
this case, there is only one activity area, containing more
than one activities, but the proposed method can still detect
the changes of each activity. This is because enough of the
data being processed undergoes a change, which is then
detected by the sequential likelihood test. In the first video,
with the crossing ladies, changes are found at frames 35, 81
when one lady enters and when another leaves, respectively.
In the second video with the beach scene, changes are
detected at frame 37, when the two ladies disappear behind
the umbrella, at frame 52 when the three ladies meet,
frame 66 when one lady is hidden by the umbrella, 78
when the girl reappears, and 94 when the two walking
ladies disappear (see />templates-human-activity-recognition). This shows that the
proposed system can handle cases of multiple activities
taking place during different, possibly overlapping, intervals,
with accurate results. Also, these videos contain dynamically
moving backgrounds, and yet accurate change detection is
obtained for them.
EURASIP Journal on Image and Video Processing 13
20 40 60 80 100 120 140 160 180
0.5
1
1.5
2
2.5
10 20 30 40 50 60
20 40 60 80 100 120 140 160
1
2
3
4
5
6
×10
3
0.5
1
1.5
2
2.5
×10
3
×10
3
Figure 13: Videos with dynamic backgrounds. First two rows, videos with trees moving in the wind, last row a video with moving water
surface. Each row shows video frames, activity area, likelihood ratio values, likelihood ratio values for all pixels.
6.4. Experiments with Dynamic Backgrounds. Several chal-
lenging videos involving dynamic backgrounds are exam-
ined. Despite the moving background, the activity areas are
found with accuracy, as seen in Figure 13.Thechangedetec-
tion results are extracted from the last column of Figure 13
and are tabulated in Ta bl e 5. All change points are detected
correctly, along with a few false alarms, which are in italics
in Ta bl e 5 . The false alarms are easily removed by comparing
the motion characteristics between estimated change points:
before and after a false alarm, the motion characteristics do
not change, so those change points are eliminated.
7. Experiments for Recognition
Experimental results for recognition based on the Activity
Area and Activity History Area information are presented
here. It should be emphasized that the activity recognition
results are good although there is no training stage, so the
proposed method is applicable to various kinds of activity,
without restrictions imposed by the training set.
Table 5: Change points for dynamic backgrounds.
Video Change points
Tre es 2 23, 39, 61, 72, 80
Trees 5 15, 62, 77, 87, 110, 130, 153
Tre es 6 14,28
Tre es 7 10, 17, 23, 37, 45, 56
Water surface 13, 40, 58, 68, 81, 110, 121, 133, 146
Table 6: Recognition for boxing, handclapping, handwaving (%).
Activity Box Handclap Handwave
Box 75.49 24.51 0
Handclap 17.39 79.45 3.16
Handwave 0 12.85 87.15
7.1. Recognition Using Fourier Shape Descriptors of Activity
Area. Experiments for activity recognition take place for
14 EURASIP Journal on Image and Video Processing
(a) (b) (c) (d)
(e) (f) (g)
Figure 14: Activity Area outlines for (a) boxing, (b) clapping, (c), (d) waving, (e) walking, (f) jogging, (g) running.
Table 7: Mahalanobis distance for running videos.
Motion Run 1 left Run 1 right Run 2 left Run 2 right
AHA slope −0.1030 0.0801 −0.0794 0.0822
d
Mahal
from Run 0.4524 1.0926 1.1122 1.0339
d
Mahal
from Jog 1.3661 1.8695 1.8849 1.8233
d
Mahal
from Walk 3.1026 3.5218 3.5346 3.4834
Table 8: Mahalanobis distance for jogging videos.
Motion Jog 1 left Jog 1 right Jog 2 left Jog 2 right
AHA slope −0.1602 0.1527 −0.1438 0.1448
d
Mahal
from Run 1.1467 0.9370 0.6882 0.7162
d
Mahal
from Jog 0.1088 0.2736 0.4693 0.4473
d
Mahal
from Walk 2.0554 2.1927 2.3557 2.3374
boxing, handclapping and handwaving, with Activity Area
outlines like those in Figures 14(a)–14(f).Thecomparison
of the FDs for 23 videos of boxing, handclapping and
handwaving each, lead to the correct classification of 75.49%
of the boxing, 79.45% of the handclapping and 87.15% of
the handwaving sequences as can be seen in Tab le 6 . This
makes intuitive sense, as the outlines of the Activity Areas
for the boxing videos have a blob-like shape, which is not
as descriptive as the other boundaries. Indeed, the best
recognition results are achieved for the handclapping video,
whose Activity Area outlines have a very characteristic shape.
Additionally, the boxing and handclapping motions are more
often confused with each other than with the handwaving, as
expected, since the latter’s Activity Area has a very distinctive
shape.
Different methods have also used this dataset for activity
recognition. In [39], excellent recognition results of 98%
for boxing, 91.9% for clapping, and 91.7% for waving
are achieved. However, that method is based on extracting
motion templates (motion images and motion context)
using very simple processing, which would fail for more
challenging sequences, like those in Section 6.4: the standard
deviation of the illumination over successive video frames is
estimated to find active pixels, a measure which can easily
lead to false alarms in the presence of noise. In [40], Support
Vector Machines (SVMs) are used, so training is required in
their method. They achieve recognition of 97.9% for boxing,
but 59.7% for clapping and 73.6% for waving, that is, worse
than our results. Finally, in [41] volumetric features are
used, leading to a higher computational cost, but achieving
recognition results of only 69.4% for boxing, 55.6% for
clapping and 91.7% for waving (which is comparable to
our result). Overall our approach has a consistently good
performance, with recognition rates above 75%, despite its
simplicity, low computational cost, and the fact that it does
not require any training or prior knowledge.
EURASIP Journal on Image and Video Processing 15
Table 9: Mahalanobis distance for walking videos.
Mot ion Wal k 1 L Walk 1 R Walk 2 L Walk 2 R Walk 3 L Walk 3 R Walk 4 L Wal k 4 R
AHA slope −0.3138 0.4112 −0.3676 0.3511 −0.3518 0.3887 −0.2729 0.3980
d
Mahal
from Run 5.4408 8.1638 6.9449 6.4836 6.5032 7.5348 4.2974 7.7948
d
Mahal
from Jog 3.2675 5.4085 4.4501 4.0874 4.1028 4.9139 2.368 55.1183
d
Mahal
from Walk 0.7565 2.5395 1.7414 1.4393 1.4521 2.1276 0.0077 2.2979
7.2. Recognition Using Activ ity History Area Features. For
translational motion classification, we examine the subse-
quences extracted from the walking, jogging, and running
videos of Section 6.1 after change detection. The direction
of motion in each one is correctly found for all data. The
Mahalanobis distance of the slope magnitude from the test
values for each video is shown in Tables 7–9, where it can be
seen that correct classification is achieved in all cases, both
for the direction and for the type of motion.
8. Conclusions
In this work, a novel approach for the analysis of human
motion in video is presented. The kurtosis of interframe
illumination variations leads to binary masks, the Activity
Areas, which indicate which pixels are active throughout the
video. The temporal evolution of the activities is character-
ized by temporally weighted versions of the Activity Areas,
the Activity History Areas. Changes in the activity taking
place are detected via sequential change detection, applied
on the interframe illumination variations. This separates
the video into sequences containing different activities,
based on changes in their motion. The activity taking place
in each subsequence is then characterized by the shape
of its Activity Area or on its magnitude and direction,
derived from the Activity History Area. For nontranslational
activities, Fourier Shape Descriptors represent the shape
of each Activity Area, and are compared with each other,
for recognition. Translational motions are characterized
based on their relative magnitude and direction, which are
retrieved from their Activity History Areas. The combined
use of the aforementioned recognition techniques with the
proposed sequential change detection for the separation of
the video in sequences containing separate activities leads to
successful recognition results at a low computational cost.
Future work includes the development of more sophisticated
and complex recognition methods, so as to achieve even
better recognition rates. The application of change detection
on video is also to be extended to a wider range of videos, as
it is a generally applicable method, not limited to the domain
of human actions.
Acknowledgments
The research leading to these results has received fund-
ing from the European Communitys Seventh Framework
Programme FP7/2007-2013 under grant agreement FP7-
214306-JUMAS, from FP6 under contract no. 027685-MESH
and FP6-027026-K-Space.
References
[1] L. Wang, W. Hu, and T. Tan, “Recent developments in human
motion analysis,” Pattern Recognition, vol. 36, no. 3, pp. 585–
601, 2003.
[2] J. K. Aggarwal and Q. Cai, “Human motion analysis: a review,”
Computer Vision and Image Understanding,vol.73,no.3,pp.
428–440, 1999.
[3] D. M. Gavrila, “The visual analysis of human movement: a
survey,” Computer Vision and Image Understanding, vol. 73,
no. 1, pp. 82–98, 1999.
[4] K. Akita, “Image sequence analysis of real world human
motion,” Pattern Recognition, vol. 17, no. 1, pp. 73–83, 1984.
[5] I. Haritaoglu, D. Harwood, and L. S. Davis, “W4: real-time
surveillance of people and their activities,” IEEE Transactions
on Pattern Analysis and Machine Intelligence, vol. 22, no. 8, pp.
809–830, 2000.
[6] A. Bottino and A. Laurentini, “A silhouette based technique
for the reconstruction of human movement,” Computer Vision
and Image Understanding, vol. 83, pp. 79–95, 2001.
[7] R. D. Green and L. Guan, “Quantifying and recognizing
human movement patterns from monocular video imagespart
I: a new framework for modeling human motion,” IEEE
Transactions on Circuits and Systems for Video Technology, vol.
14, no. 2, pp. 179–189, 2004.
[8] I. Laptev and T. Lindeberg, “Space-time interest points,”
in Proceedings of the 9th IEEE International Conference on
Computer Vision (ICCV ’03), vol. 1, pp. 432–439, Nice, France,
October 2003.
[9] M. Oren, C. Papageorgiou, P. Sinha, E. Osuna, and T. Poggio,
“Pedestrian detection using wavelet templates,” in Proceedings
of the IEEE Computer Society Conference on Computer Vision
and Pattern Recognition (CVPR ’97), pp. 193–199, San Juan,
Puerto Rico, USA, June 1997.
[10] M. Singh, A. Basu, and M. Mandal, “Human activity recogni-
tion based on silhouette directionality,” IEEE Transactions on
Circuits and Systems for Video Technology,vol.18,no.9,pp.
1280–1292, 2008.
[11] T. Cootes, C. Taylor, D. Cooper, and J. Graham, “Active shape
models-their training and application,” Computer Vision and
Image Understanding, vol. 61, no. 1, pp. 38–59, 1995.
[12] C. Cedras and M. Shah, “Motion-based recognition a survey,”
Image and Vision Computing, vol. 13, no. 2, pp. 129–155, 1995.
[13] J. Boyd and J. Little, “Global versus structured interpretation
of motion: moving light displays,” in Proceedings of the IEEE
Workshop on Motion of Non-Rigid and Articulated Objects
(NAM ’97), pp. 18–25, 1997.
[14] R. Polana and R. Nelson, “Detecting activities,” in Proceedings
of the IEEE Conference on Computer Vision and Pattern
Recognition (CVPR ’93), pp. 2–7, New York, NY, USA, June
1993.
16 EURASIP Journal on Image and Video Processing
[15] A. F. Bobick and J. W. Davis, “The recognition of human
movement using temporal templates,” IEEE Transactions on
Pattern Analysis and Machine Intelligence, vol. 23, no. 3, pp.
257–267, 2001.
[16] L. Gorelick, M. Blank, E. Shechtman, M. Irani, and R. Basri,
“Actions as space-time shapes,” IEEE Transactions on Pattern
Analysis and Machine Intelligence, vol. 29, no. 12, pp. 2247–
2253, 2007.
[17] J. Yamato, J. Obya, and K. Ishii, “Recognizing human action
in time sequential images using hidden markov model,” in
Proceedings of the IEEE International Conference on Computer
Vision and Pattern Recognition (CVPR ’92), pp. 379–385, The
Hague, The Netherlands, 1992.
[18] A. Kale, A. Sundaresan, A. N. Rajagopalan, et al., “Identi-
fication of humans using gait,” IEEE Transactions on Image
Processing, vol. 13, no. 9, pp. 1163–1173, 2004.
[19] X. Sun, C. W. Chen, and B. S. Manjunath, “Probabilistic
motion parameter models for human activity recognition,”
in Proceedings of the International Conference on Pattern
Recognition (ICPR ’02), vol. 16, no. 1, pp. 443–446, Quebec,
Canada, August 2002.
[20] C. R. Wren, A. Azarbayejani, T. Darrell, and A. P. Pentland,
“P finder: real-time tracking of the human body,” IEEE
Transactions on Pattern Analysis and Machine Intelligence, vol.
19, no. 7, pp. 780–785, 1997.
[21]T.Aach,L.D
¨
umbgen, R. Mester, and D. Toth, “Bayesian
illumination-invariant motion detection,” in Proceedings of the
IEEE International Conference on Image Processing (ICIP ’01),
vol. 3, pp. 640–643, Thessaloniki, Greece, October 2001.
[22] C. Stauffer and W. Grimson, “Adaptive background mixture
models for real-time tracking,” in Proceedings of the IEEE
Computer Society Conference on Computer Vision and Pattern
Recognition (CVPR ’99), vol. 2, pp. 246–252, Fort Collins,
Colo, USA, June 1999.
[23] M. El Hassouni, H. Cherifi, and D. Aboutajdine, “HOS-based
image sequence noise removal,” IEEE Transactions on Image
Processing, vol. 15, no. 3, pp. 572–581, 2006.
[24] G. B. Giannakis and M. K. Tsatsanis, “Time-domain tests
for Gaussianity and time-reversibility,” IEEE Transactions on
Signal Processing, vol. 42, no. 12, pp. 3460–3472, 1994.
[25] C. Stauffer and W. Grimson, “Adaptive background mixture
models for real-time tracking,” in Proceedings of the IEEE
Computer Society Conference on Computer Vision and Pattern
Recognition (CVPR ’99), vol. 2, pp. 246–252, Fort Collins,
Colo, USA, June 1999.
[26] E. S. Page, “Continuous inspection scheme,” Biometrika, vol.
41, no. 1, pp. 100–115, 1954.
[27] H. V. Poor, An Introduction to Signal Detection and Estimation,
Springer, New York, NY, USA, 2nd edition, 1994.
[28] A. Wald, Sequential Analysis, Dover Publications, New York,
NY, USA, 2004.
[29] G. V. Moustakides, “Optimal stopping times for detecting
changes in distributions,” Annals of Statistics, vol. 14, no. 4,
pp. 1379–1387, 1986.
[30] M. Basseville and I. Nikiforov, Detection of Abrupt Changes:
Theory and Application, Prentice-Hall, Englewood Cliffs, NJ,
USA, 1993.
[31] B.Aiazzi,L.Alparone,andS.Baronti,“Estimationbasedon
entropy matching for generalized Gaussian PDF modeling,”
IEEE Signal Processing Letters, vol. 6, no. 6, pp. 138–140, 1999.
[32] J. P. Nolan, Stable Distributions—Models for Heavy Tailed Data,
chapter 1, Birkh
¨
auser, Boston, Mass, USA, 2010.
[33] A. Briassouli, P. Tsakalides, and A. Stouraitis, “Hidden mes-
sages in heavy-tails:DCT-domain watermark detection using
alpha-stable models,” IEEE Transactions on Multimedia, vol. 7,
pp. 700–715, 2005.
[34] D. Simitopoulos, S. A. Tsaftaris, N. V. Boulgouris, A. Brias-
souli, and M. G. Strintzis, “Fast watermarking of MPEG-1/2
streams using compressed-domain perceptual embedding and
a generalized correlator detector,” EURASIP Journal on Applied
Signal Processing, vol. 8, pp. 1088–1106, 2004.
[35] M. Bober, “MPEG-7 visual shape descriptors,” IEEE Transac-
tions on Circuits and Systems for Video Technology, vol. 11, no.
6, pp. 716–719, 2001.
[36] D. S. Zhang and G. Lu, “A comparative study of Fourier
descriptors for shape representation and retrieval,” in Proceed-
ings of the 5th Asian Conference on Computer Vision (ACCV
’02), pp. 646–651, Melbourne, Australia, Januray 2002.
[37] C. Hory, A. Kokaram, and W. J. Christmas, “Threshold
learning from samples drawn from the null hypothesis for the
generalized likelihood ratio CUSUM test,” in Proceedings of the
IEEE Workshop on Machine Learning for Signal Processing,pp.
111–116, September 2005.
[38] I. V. Nikiforov, “A generalized change detection problem,”
IEEE Transactions on Information Theory,vol.41,no.1,pp.
171–187, 1995.
[39] Z. M. Zhang, Y. Q. Hu, S. Chan, and L. T. Chia, “Motion
context: a new representation for human action recognition,”
in Proceedings of the European Conference on Computer Vision
(ECCV ’08), vol. 5305 of Lecture Notes in Computer Science,pp.
817–829, Marseille, France, October 2008.
[40] C. Schuldt, I. Laptev, and B. Caputo, “Recognizing human
actions: a local SVM approach,” in Proceedings of the 17th
International Conference on Pattern Recognition, Cambridge,
UK, August 2004.
[41] Y. Ke, R. Sukthankar, and M. Hebert, “Efficient visual event
detection using volumetric features,” in Proceedings of the10th
IEEE International Conference on Computer Vision (ICCV ’05),
vol. 1, pp. 166–173, Beijing, China, October 2005.