Machining of High Strength Steels With Emphasis on Surface Integrity by air force machinability data center_2 docx
Bạn đang xem bản rút gọn của tài liệu. Xem và tải ngay bản đầy đủ của tài liệu tại đây (518.01 KB, 9 trang )
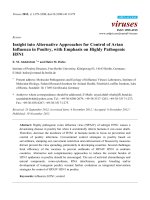
Figure 146. A turning and boring surface texture test piece.
Chapter
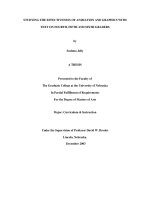
Figure 147. Machinability testing utilising an ‘accelerated testing procedure’ – a combination of the rapid facing and degraded
tool tests
.
Machinability and Surface Integrity
on a moderately short timescale. Normally in many
previous testing programs, an uncoated cemented car-
bide P20, or P10 grade would have been used, since
these grades withstand both higher speeds and have
better tool wear resistance to that of previously utilised
cutting tool materials. However in this case, an P25
grade was chosen, which is a degradation from the
optimum P20 grade, but it should still perform satis-
factorily. Furthermore, the cutting speed was raised by
>2.5 times the optimum of 200 m min
–1
, with all fac-
ing operations being conducted at a ‘constant surface
speed’
12
of 550 m min
–1
.
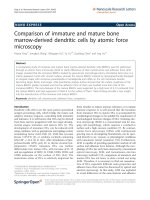
Typical tool-life curves produce by the AWT tech-
nique are illustrated in Fig. 148, showing the expected
three stages of ank wear. is ank wear being a func-
tion of: the initial edge breakdown, steady-state wear –
as the insert’s ank progressively degenerates and -
nally, catastrophic insert edge breakdown – as the edge
completely fails. Detailed metallurgical analysis can be
made as to the reasons why some P/M compacts per-
formed better than others, by reference to the litera-
ture on the metallurgical interactions between the tool
and the compact – this subject being outside the scope
of the present discussion. e facing-o secondary
machining operation meant that aer 10 facing passes,
a pre-programmed ‘optional stop’ can then be applied,
to allow both tool ank wear and compact surface tex-
ture to be established. e faced-o surface texture re-
sults can then be superimposed onto the same graph –
for a direct comparison of ank wear and for that of
the machined surface texture parameter. Without go-
ing into too much detail of the specic aspects of the
processing and metallurgical interactions present here
on the composite graph, some compacts abraded the
cutting insert more than others, while the ‘faced’ sur-
face texture, generally seemed to get worse, then im-
prove and nally worsen again. However, this is a
complex problem which goes to the ‘heart’ of the vi-
12 ‘Constant surface speed’ , this can be achieved by employing
the appropriate ‘canned-cycle’ G-code accessed from the CNC
controller, which allows the testpiece’s rotational speed to in-
crease as the faced diameter decreases*.
* Normally there is a restriction on the rotational speed limit
– created by the maximum available speed for this machine
tool, which would normally be reached well before the cutting
insert has coincided with that of components centre line, but
because in this instance, the compacted testpiece is hollow, the
rotational restriction does not present a problem.
sual aspect of machined surfaces – wherein the real
situation is that surface texture continuously degen-
erates, and it is only the burnishing (i.e.‘ironing’) of
the surface that ‘masks’ the temporary improvement
in machined surface – more on this topic will be made
in the surface integrity section. What is apparent from
using the AWT technique is that on a very short tim-
escale, considerable data can be generated and applied
research assessments can be conducted both speedily
and eciently. is topic of exploiting the minimum
machining time and data-gathering activities to gain
the maximum information, will be the strategic mes-
sage for the following dialogue.
Machinability Strategies: Minimising Machining
Time, Maximising Data-Gathering
Prior to commencing any form of machinability tri-
als, parameters for cutting data need to be ascertained
in order to minimise any likelihood of repetition of
results, while reducing the amount of testpieces to be
machined to the minimum. Data obtained from such
trials must be valid and to ensure that the cutting pa-
rameters selected are both realistic and signicant a
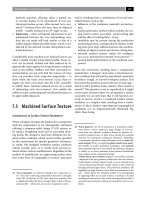
disciplined experimental strategy based upon the ‘De-
sign of Experiments’ (DoE) approach is necessary – see
Fig. 149. Here, a ow-chart highlights the step-by-
step approach for a well-proven industrial technique,
to maximise the labour-intensive and costly exercise
of obtaining a satisfactory conclusion to an unbiased
and ranked series of machinability results. ere are
a range of techniques that can be utilised to assess
whether the cutting data inputs, namely: feeds, speeds,
D
OC
’s, etc., will result in the correct inputs to obtain
an extended tool life, or an improvement in the ma-
chined surface texture from the testing program. One
such method is termed the ‘Latin square’ – which as-
sesses the signicance of the test data and its interac-
Chapter
Figure 148. Graphical results obtained from the accelerated machinability test, illustrating how ank wear and
surface texture degrades, with the number of facing-o passes
.
Machinability and Surface Integrity
tions. For a practical machinability trial employing a
‘Latin square’ , it uses a two-way ANOVA
13
table, with a
limited amount of ‘degrees of freedom’ , typically: fee
-
drate, cutting speed, D
OC
, plus surface nish – these
parameters can be changed/modied to suit the ‘pro-
gramme of machining’ in hand. By using a very lim-
ited group of cutting trials, a two-way ANOVA table
can be constructed and their respective ‘F-ratio’ for
each interaction can be determined. is calculated ‘F-
ratio’ should be greater than the 5% ‘condence limit’
of the statistical distribution to be signicant. If the F-
ratio falls below –5% (i.e. for the calculated F-ratio),
then the interactions are not signicant, which ne-
cessitates increasing the ‘factor strength’ (e.g. increas-
ing the: cutting speed, feedrate, etc.), to generate data
which is >5% condence limit – as shown by the ‘feed-
back loop’ in Fig. 149, or alternatively, using a dierent
factor. By such means, ANOVA tests for signicance of
machining data, ensures that the processing parameters
utilised for the prospective machinability trial are both
valid and the correct ones to use in the proposed ma-
chining programme.
13 ‘Analysis of variance’ (ANOVA), or as it should be more ap-
propriately termed the ‘analysis of variation about the means’ ,
consists of portioning the total variation present in a data set
into ‘components’. Each ‘component’ is attributed to an iden-
tiable cause, or source of variation; in addition, one ‘com-
ponent’ represents the variation due to uncontrolled factors
and random errors associated with the response measure-
ments.Specically, if the data set consists of ‘n’ measurements
‘y
1
.…,y
n
’ and their mean is denoted by: ‘y ’ , the total varia-
tion about the mean is embodied in the ‘sum of squared de-
viations’ , as following diagram depicts, for the ‘partitioning
scheme’ for ANOVA:
Total Sum of Squares about the mean:
n
�
i=
(y
−
¯
y)
↓ ↓ ↓ ↓ ↓
Sum of
squares
– due to
Source1
Sum of
squares
– due to
Source2
Sum of
squares
– due to
Source3
Sum of
squares
– due to
Source4
Error, or
residual
Sum of
Squares
e technique of analysis of variance decomposes this total
‘sum of squares’ into the parts shown above, for a case in
which four identiable sources of variation are present – in
addition to the ‘error component’. e number of identiable
causes of variation and the formulae for the ‘component sums
of squares’ are intrinsically connected to the specic experi-
mental design utilised, in the data collection and to the statis-
tical model deemed appropriate for this analysis.
Rather than spending considerable time, eort
and indeed exorbitant expense, on a large and com-
plex machining testing programme, which more oen
than not, produces numerous machined components
that are almost indistinguishable from each other. It
might be more prudent, to conduct a ‘condensed’ series
of trials, based upon a rigorous statistically-designed
methodology. erefore, experiments based on the so-
called ‘orthogonal arrays’ can be benecially engaged
in this regard. Many applied researchers and engineers
have utilised a range of factorial-designed experi-
ments, typied by the ‘Taguchi-approach’.
e main problem with these ‘arrays’ is that in many
situations the large number of ‘interactions’ (i.e. fac-
tors) have been shown to interfere with the overall re-
sults – introducing ‘secondary eects’ , which will not
have been anticipated for, when the original strategic
programme was devised
14
. Such spurious data, could
seriously aect future machining recommendations
and inuence the outcome in a negative manner. e
‘interaction problem’ can have these aects consider-
ably reduced by incorporating a more ‘truncated-ap-
proach’ to the experimental design strategy for the
machinability trials, rather than using a ‘full’ Taguchi
orthogonal array (Fig. 150). For example, if all of the
experiments are conducted in for example one of ‘stan-
dard’ the Taguchi L
8
(2
7
) orthogonal array, depicted in
Fig. 150, then the ‘total outcomes’ (i.e. components
machined), would be: 2
7
= 128 × 8 = 1,024 individual
components machined. Here, in the Taguchi orthogo-
nal array seven factors have been employed and with
the vast amount of components produced from such a
long-running and very costly machining programme,
many of the pertinent details will be lost on those en-
gineers/researchers attempting to de-code the vast as-
sortment of machinability data collated. However, it
is possible to utilise a much simpler-approach to the
overall massive data-collection and analysis problem,
yet still providing statistical signicance, this can be
achieved by adopting a ‘Fractional factorial-designed
experiment’. Here, instead of the virtually ‘mindless
task’ of producing 1,024 almost identical components,
14 ‘Orthogonal array factors’ – when utilising a ‘full’ Taguchi-
designed orthogonal array for a complete picture of all of the
interactions, then it has been shown (Shainin, 1985 – see refer-
ences), that if many factors are employed (i.e. normally >5),
this results in unwanted ‘secondary eects’ which cannot be
accounted for, leading to spurious results from any machin-
ability trials.
Chapter
by using a ‘Fractional factorial-designed experiment’
with an identical matrix to that given in Fig. 150,
only 8 components are produced! is testing regime
is both signicantly quicker and much less costly to
perform, obtaining a ‘snap-shot’ of the overall ma-
chinability problem, but because considerably less tes-
tpieces are produced, the ‘interaction-problem’ and its
‘secondary eects’ are not an issue, even when seven
factors are utilised. Obviously, this machinability data
has to be collated and investigated in a disciplined and
controlled fashion. One tried-and-tested method of
establishing an unbiased and ranked interpretation of
these results, is to use the much misunderstood and
maligned technique of ‘Value Analysis’
15
(VA). is VA
when used to show trends in competitive functions
15 ‘Value Engineering and Analysis’ (VE/VA), with VE being
principally concerned with an overall improvement of design-
based details on engineering components, while a more lim-
ited form of this technique is termed VA – being particularly
relevant for detailed interpretation of recorded data from ex-
perimentation. Here, in this case, from the wide-ranging and
oen seemingly unrelated output of machinability trials.
Figure 149. Flow chart indicating the desigh philosophy for unbiased and ranked machinability trials.
Machinability and Surface Integrity
Figure 150. A fractional factorial-designed experiment, based upon a Taguchi L
8
(2
7
) – orthogonal array.
Chapter
and operations, can be successfully utilised from the
comparisons of cutting uids, through to complex and
dicult-to-machine aerospace machinability trials. If
a more sophisticated technique is required, then it is
also possible to utilise ‘Quality Function Deployment’
16
(QFD), to obtain a complete picture of the outcomes
from machining trials. QFD is oen used by indus-
try as a means for its ‘Continuous-improvement pro-
grammes’
17
. Here for ‘simplicity’s-sake’ , the more basic
and somewhat less complex VA tabulated data-colla-
tion approach, will be briey reviewed.
e application of VA to a series of collated and
compiled massed-data is not new. In fact, it was
widely-used during the 1960’s, but fell into disfavour,
partly because its function and operation were oen
not well-dened – this being exacerbated by poor im-
plementation of its recommendations. However, VA
techniques are useful, allowing one to interpret data
trends both quickly and objectively – without undue
bias – at a glance of a spreadsheet. Not only can signi-
cant trends be readily seen, but the spreadsheet shown
in Fig. 151 – shows a typical machinability data for P/
M compacts drilled by two diering drill-point geom-
etries. By using the spreadsheet, not only can overall
trends be readily seen, it also can depict sub-set trends
as well, giving a complete picture (i.e. globally) of the
important criteria in assessing machining data. As a
simple ranking system is used, considerable objectiv-
ity can be gained and with little undue inuence – bias,
aecting the outcome from these tabulated results. In
employing the ranking of the results, it is normal prac-
tice to decrement down and if two values are ranked
identically, then they are given the same rankings, fol-
lowed by the next lower ranking, being two numbers
lower, as following example shows:
16 ‘Quality Function Deployment’ (QFD), is a general term that
means the: ‘Deployment of quality through deployment of qual-
ity functions’ (Akao, 1988). It is oen known as the ‘House of
Quality’ , because the tabulated graphical representation looks
similar to that of a house – when all the interacting factors
for subsequent analysis have been included on the chart. is
QFD technique, is a wide-ranging philosophy for the com-
plete analysis of both simple and intricate designs and can be
successfully exploited for machinability trials.
17 ‘Continuous-improvement programmes’ , can be dened as
an: ‘Operational philosophy that makes the best use of resources
in order to increase product, or service quality and result in
more eective satisfaction of customers’ (Swanson, 1995).
For example, in Fig. 151 – for the values shown in
column two (i.e. le-hand side: Jobber drill, rust
Force 0.254 N):
Compact type: 1 2 3 4 5 6 7 8
Ranking: 6 8 5 1 5 7 3 2
NB Here, two 5’s were ranked, meaning that the next
decremented value would rank as 3. Hence, in this case
the Low compaction Compact type No. 2 this was best
and Low compaction No. 4 worst – as jobber drilled.
is ‘truncated approach’ the elementary and easily
comprehended VA tabulation (Fig. 151) , enables non-
specialists, together with knowlegdible experimenter,
to recognize the inuence various machining param-
eters have on the potential performance of the trials
undertaken. By judicious use, the VA technique in
conjunction with a strictly controlled and limited ma-
chining strategy – based upon some form of ‘orthogo-
nal array’ , in combination with the ‘strength’ (i.e >5%
‘F-ratio’) of parameters by ANOVA, this will enable a
researcher to conduct a speedy, compact, realistic, yet
meaningful machinability assessment.
7.2 Machined Roundness
Roundness is a condition of a ‘surface of revolution’ ,
which can take the form of a: cylinder, cone, or sphere,
where all the peripheral data points (i.e. measure-
ments) intersect. In reality, the radius of say, a nomi-
nally round workpiece tends to deviate – from the
‘true circle’ – around the periphery of the part, making
these variations the theme to subjective interpretation
of the measured results. In fact, in the past, the sim-
plistic technique for the assessment of roundness was
usually measuring three diameters on a workpiece, to
determine the diametrical variations, then ‘averaging’
to give its overall dimensional size. Moreover, for vari-
ations in a workpiece’s radius about an axis of rotation,
this was oen found by positioning the part between a
‘bench-’ , or sine-centres’ – the latter equipment is em
-
ployed for turned tapered features, then rotating and
monitoring it with dial gauges both at and along its
length. In the past, this rather supercial metrologi-
cal workpiece assessment was supposed to inform the
inspector as to its potential in-service performance.
If some radial variations occurred, this geometrical
Machinability and Surface Integrity
Figure 151. Value analysis – tabulation of the performance of two drilling
points and a typical range of drilling data, when machining powder metal-
lurgy compacts
.
Chapter