Báo cáo hóa học: "Research Article EEG-Based Subject- and Session-independent Drowsiness Detection: An Unsupervised Approach" pot
Bạn đang xem bản rút gọn của tài liệu. Xem và tải ngay bản đầy đủ của tài liệu tại đây (2.03 MB, 11 trang )
Hindawi Publishing Corporation
EURASIP Journal on Advances in Signal Processing
Volume 2008, Article ID 519480, 11 pages
doi:10.1155/2008/519480
Research Article
EEG-Based Subject- and Session-independent Drowsiness
Detection: An Unsupervised Approach
Nikhil R. Pal,
1, 2, 3
Chien-Yao Chuang,
1, 2
Li-Wei Ko,
1, 2
Chih-Feng Chao,
1, 2
Tzyy-Ping Jung,
1, 2, 4
Sheng-Fu Liang,
5
and Chin-Teng Lin
1, 2
1
Department of Computer Science, National Chiao-Tung University, 1001 University Road, Hsinchu 30010, Taiwan
2
Brain Research Center, National Chiao-Tung University, 1001 University Road, Hsinchu 30010, Taiwan
3
Computer and Communication Sciences Division, Electronics and Communication Sciences Unit, Indian Statistical Institute,
203 Barrackpore Trunk Road, Kolkata 700108, India
4
Institute for Neural Computation, University of California of San Diego, 4150 Regents Park Row, La Jolla, CA 92037, USA
5
Department of Computer Science and Information Engineering, National Cheng-Kung University, University Road,
Tainan 701, Taiwan
Correspondence should be addressed to Chin-Teng Lin,
Received 2 December 2007; Revised 25 June 2008; Accepted 22 July 2008
Recommended by Chien-Cheng Lee
Monitoring and prediction of changes in the human cognitive states, such as alertness and drowsiness, using physiological signals
are very important for driver’s safety. Typically, physiological studies on real-time detection of drowsiness usually use the same
model for all subjects. However, the relatively large individual variability in EEG dynamics relating to loss of alertness implies
that for many subjects, group statistics may not be useful to accurately predict changes in cognitive states. Researchers have
attempted to build subject-dependent models based on his/her pilot data to account for individual variability. Such approaches
cannot account for the cross-session variability in EEG dynamics, which may cause problems due to various reasons including
electrode displacements, environmental noises, and skin-electrode impedance. Hence, we propose an unsupervised subject- and
session-independent approach for detection departure from alertness in this study. Experimental results showed that the EEG
power in the alpha-band (as well as in the theta-band) is highly correlated with changes in the subject’s cognitive state with respect
to drowsiness as reflected through his driving performance. This approach being an unsupervised and session-independent one
could be used to develop a useful system for noninvasive monitoring of the cognitive state of human operators in attention-critical
settings.
Copyright © 2008 Nikhil R. Pal et al. This is an open access article distributed under the Creative Commons Attribution License,
which permits unrestricted use, distribution, and reproduction in any medium, provided the original work is properly cited.
1. INTRODUCTION
Drivers’ fatigue is one of the primary causal factors for many
road accidents and hence detection of drowsiness of drivers
in real time can help preventing many accidents behind the
steering wheel. In the field of safety driving, thus develop-
ment of methodologies for detection drowsiness/departure
from alertness in drivers has become an important area of
research. Drowsiness leads to a decline in drivers’ abilities
of perception, recognition, and vehicle control, and hence
monitoring of drowsiness in drivers is very important to
avoid road accidents. It is known that various physiological
factors covary with drowsiness levels [1–5]. Some such
factors are eye activities, heart rate variability (HRV), and
the electroencephalogram (EEG) activities. Since the effect
of changes in cognitive state on EEG is quite strong, in
this study we will use EEG as our information source
for detection of drowsiness. Most of the earlier studies
using EEG relating to assessment of changes in cognitive
states are supervised in nature and have used the same
detection model for all subjects [6–8].Butitisknownthat
there existed relatively large subjective variability in EEG
dynamics relating to drowsiness/departure from alertness.
This suggests that for many operators, group statistics or
a global model may not be effective to accurately predict
changes in the cognitive states [9–12]. Subject-dependent
models have also been developed to account for individual
variability. Such personalised models although can alleviate
2 EURASIP Journal on Advances in Signal Processing
the problem of individual variability in EEG spectra; such
methods cannot take into account the variability between
sessions in EEG spectra due to various factors such as elec-
trode displacements, environmental noises, skin-electrode
impedance, and baseline EEG differences. One of the major
problems in dealing with EEG signals in a real-time driving
environment is the presence of noise. Often independent
component analysis (ICA) [13–17] is used for cleaning noise
from EEG. However, selection of the noisy components in an
automatic manner using ICA is still a difficult task.
In this investigation we introduce an unsupervised
approach to estimate a model for the alert state of the
subject. We will refer to such models as alert-models. A
part of this investigation has been reported in [18]. The
proposed approach can account for the variability in EEG
signals between individuals and between sessions with the
same individual. Being an unsupervised approach we do not
need a teacher or a labeled training dataset with information
on whether the driver is in an alert state or drowsy state
at every time instant. In this approach, we derive models
of the alert state of the subject as characterised by the EEG
signal collected during the first few minutes of recording. We
assume that during the first few minutes of driving, the driver
(subject) will be in an alert state, although he/she may not
be in a completely normal state as he/she might have walked
some distance to reach the garage. This approach can account
for baseline shifts and the variations in EEG spectra due to
changes in recording conditions in different driving sessions.
We find that the EEG log power in the alpha-band (as well
as in the theta-band) and the driving performance exhibits a
rough linear relation suggesting that changes in the cognitive
state are reflected in the EEG power in the two specified
bands. We then demonstrate that deviation of the EEG power
from that of the alert model also follows a similar relation
with the changes in driving performance, and hence with the
changes in cognitive state. Consequently, a derivation from
the alert model can be used to detect drowsiness and that is
what we do in this investigation.
2. DATA ACQUISITION
2.1. Experimental set up: a virtual reality (VR-)based
driving environment
In this study we use a virtual-reality-based highway-driving
environment to generate the required data. Some of our
previous studies to investigate changes in drivers’ cognitive
states during a long-term monotonous driving have also
used the same VR-based environment [19, 20]. In this
system, a real car mounted on a 6-degree-of-freedom Stewart
platform is used for the driving and seven projectors are
used to generate 3D surrounded scenes. During the driving
experiments, all scenes move depending on the displacement
of the car and the subject’s maneuvering of the wheel, which
makes the subject feel like driving the car on a real road. In
all our experiments, we have kept the driving speed fixed at
100 km/h and the system automatically and randomly drifts
the car away from the center of the cruising lane to mimic
the effects of a nonideal road surface. The driver is asked to
F7
F8
F4
G
FT7
FT8
FC3
FC4
A1
A2
TF7
TF8
T3
T4
T5 T6
O1
O2
OZ
PZ
CPZ
CZ
FCZ
FZ
F3
C3
C4
CP3
CP4
P3
P4
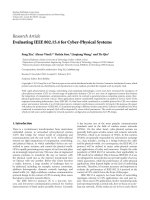
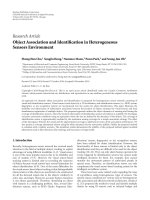
Figure 1: Electrodes placement of international 10–20 system. F:
frontallobe,T:temporallobe,C:centrallobe,P:parietallobe,and
O: occipital lobe. Z refers to an electrode placed on the midline.
maintain the car along the center of the cruising lane. All
subjects involved in this study have good driving skill and
hence when the subject is alert, his/her response time to the
random drift is short and the deviation of the car from the
center of the lane is small. But when the subject is not alert
or drowsy, both the response time and the car’s deviation
are high. Note that, in all our experiments, the subject’s car
is the only car cruising on the VR-based freeway. Although
both response time and the deviation from the central line
are related to the subject’s driving performance, in this study,
we use the car’s deviation from the central line as a measure
of behaviour performance of the subjects.
2.2. The EEG recording system
The data acquisition system uses 32 sintered Ag/AgCl
EEG/EOG electrodes with a unipolar reference at right
earlobe and 2 ECG channels in bipolar connection which
are placed on the chest. All EEG/EOG electrodes were placed
following a modified international 10–20 system and refer
to right earlobe as depicted in Figure 1.InFigure 1,A1and
A2 are two reference channels. The two channels FP1 and
FP2 are found to be quite noisy and hence we do not use
the signals obtained from them. Thus, we use data from 28
channels. Before the data acquisition, the contact impedance
between EEG electrodes and cortex was calibrated to be less
than 5 kΩ. We use the Scan NuAmps Express system (Com-
pumedics Ltd., VIC, Australia) to simultaneously record the
EEG/EOG data and the deviation between the center of the
vehicle and the center of the cruising lane. The EEG data are
recorded with 16-bit quantization level at the sampling rate
of 500 Hz. To reduce the burden of computation, the data
are then downsampled to sampling rate of 250 Hz. Since the
objective is to develop methodologies that can be used in real
time, we do not use sophisticated noise cleaning techniques
such as ICA but we preprocess the EEG signals using a simple
lowpass filter with a cutoff frequency of 50 Hz to remove
the line noise (60 Hz and its harmonics) and other high-
frequency noise.
Nikhil R. Pal et al. 3
Driving
experiment
EEG data from
channel OZ
Preprocessing
of
power spectra
Computation of
alpha-model with
Mardia test
Computation of
theta-model with
Mardia test
Alpha-band spectra
Theta-band spectra
Finding the alert model
Compute
MDA
Compute
MDC
Compute
MDT
Correlation
analysis
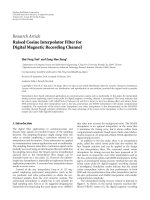
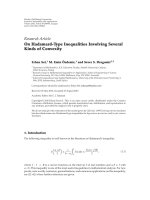
Figure 2: The flowchart of the EEG analysis method. First, we calculate power spectra of EEG data and preprocess with median filter. Then,
we select theta- and alpha-band powers while the subject is alert to build two alert models. After the models are built, alpha- and theta-band
powers are used to deviations (MD
∗
) from the models. We smooth the resultant MD
∗
with a 90-second moving window at 2-second steps
and calculate the correlations between subject’s driving performance and the smoothed MD
∗
.
2.3. The subjects
Here we provide a brief description of the EEG recording
system as well as of the subjects involved in this study. We
have used a set of thirteen subjects (ages varying from 20 to
40 years old) to generate data for the investigation. Of this
thirteen, ten subjects are the same as used in [18]. Statistical
reports [21] suggest that people often get drowsy within one
hour of continuous driving in the early afternoon hours.
Moreover, after a good sleep in the night, people are not
likely to fall sleep easily during the first half of the day. And
hence, we have conducted all our experiments in the early
afternoonafterlunchsothatwecangeneratemoreuseful
data. We have informed the participants about the goal of
these experiments and the general features of the driving
task. We have also completed the necessary formalities to get
their consent for these experiments. Each subject was asked
to drive the car for 60 minutes with a view to keep the car
at the center of the cruising lane by maneuvering it with the
steering wheel. Of the thirteen subjects, four struggled with
mild drowsiness, while the remaining nine exhibited mild
and deep drowsy episodes during the 1-hour driving session.
2.4. Indirect measurement of alertness
To investigate the relationship between the measured EEG
signals and subject’s cognitive state, and to quantify the level
of the subject’s alertness, in our previous studies [19, 20],
we have defined an indirect index of the subject’s alertness
level (driving performance) as the deviation between the
center of the vehicle and the center of the cruising lane.
Typically, the drowsiness level fluctuates with cycle lengths
longer than 4 minutes [22–25], and hence we smooth
the indirect alertness level index using a causal 90-second
moving window advancing at 2-second steps. This helps us
to eliminate variance with cycle lengths shorter than 1-2
minutes. We emphasize that this index is used only to validate
our approach, and it is not as an input to develop the model
for the alert state of the subject.
3. THE PROPOSED UNSUPERVISED APPROACH
It is recognised that the changes in EEG spectra in the theta-
band (4
∼7 Hz) and alpha-band (8∼11 Hz) reflect changes
in the cognitive and memory performance [26]. Other
studies have reported that EEG power spectra at the theta-
band [25, 27] and/or alpha-band [28, 29] are associated
with drowsiness, and EEG log power and subject’s driving
performance are largely linearly related. These findings have
motivated us to derive the alert models of the driver using the
alpha-band and theta-band EEG power spectrum computed
using OZ channel output recorded in the first few minutes
of driving. The choice of the OZ channel is explained in
Section 4. We emphasize that the few minutes of data used
to find the alert model are not necessarily collected from
the very beginning of the driving session because different
factors, for example, if the driver walks a few meters to
reach the garage, may influence the EEG signal generated
at the very beginning. The specific window to be used
for generating the alert model is selected by Mardia test
(explained later) [30]. We assume that if the subject/driver
is in an alert state, then the EEG power spectra relating to
theta-band (as well as that relating to alpha-band) would
follow a multivariate normal distribution. The parameters
of the multivariate normal distributions characterise the
models. Using the alpha-band and theta-band EEG powers,
we identify two normal-distribution-based models. Then,
we assess the deviation of the current state of the subject
from the alert model using Mahalanobis distance (MD). We
assume that when the subject continues to remain alert,
4 EURASIP Journal on Advances in Signal Processing
his/her EEG power should resemble the sample data used
to generate the model and hence would match the alert
model or template. If the subject becomes drowsy, then its
power spectra in the alpha-band (and also in theta-band)
will deviate from the respective model and hence MD will
increase. With a view to reduce the effect of spurious noise,
MDs are smoothed over a 90-second moving windows, the
window is moved by 2-second steps. We then study the
relationship between smoothed Mahalanobis distance and
subject’s driving performance by computing the correlation
between the two. Figure 2 shows the overall flow of the
EEG data analysis. In Figure 2, note that, after the models
are identified, the preprocessed alpha-band and theta-band
power data directly go to the blocks for computation of
MDA and MDT, respectively. MDT and MDA are measures
of deviations of the subject’s present state from the respective
models, this will be clarified later. The block for computation
of MDC makes a linear combination of MDT and MDA.
Finally, the three, MDA, MDT, and MDC, are used in
correlation analysis with the driver’s performance. We now
explain the various major tasks in the model development
and the use of the model in the following sections.
3.1. Smoothing of the power spectra
We use a componentwise median filter for smoothing the
power spectrum data. We compute one data vector (a vector
with power spectrum) in 20 dimensions using 2-second sig-
nal and fast Fourier transform (FFT). Thus, we consider 500-
point Hanning windows without overlap. Each windowed
500-point epoch is now subdivided into 16 subepochs each
with 125 points using a Hanning window. Each subepoch
is shifted by 25 points. For example, the first subepoch uses
points 1 through 125, the second subepoch uses points 26
through 150, and so on. Each subepoch is then extended to
256 points by zero padding for a 256-point FFT. A moving
median (computed using the 16 subepochs) filter is used to
minimise the presence of artifacts in the EEG records of all
subwindows. The median filter is realised by computing the
median of each component. In other words, for 2-second
signal, we have generated 16 vectors, each in 20 dimensions.
Then, we generate a new vector in 20 dimensions, where the
ith component is the median value of the ith component of
the 16 vectors. We call this new vector the mov ing median
filtered data. This process is repeated for every two seconds
without overlap. The moving median filtered EEG power
spectra are then converted to a logarithmic scale prior to
further analysis. Logarithmic scaling linearizes the expected
multiplicative effects of subcortical systems involved in
wake-sleep regulation on EEG amplitudes [31]. Thus for
each session, EEG log power time series at alpha-band as
well as at theta-band with 2-second (500-point, an epoch)
timeintervals are generated. These time series data are the
inputs to our model.
3.2. Computation of the alert model of the subject
In our approach, for every subject in every driving session a
new model will be constructed. Consequently, the variability
between subjects as well as the intersession variability is
no more important, because they are taken into account
automatically. To develop the alert model we make a few mild
but realistic assumptions as follows.
(1) The subject is usually very alert immediately after
he/she starts the driving session.
(2) Subject’s cognitive state can be characterised by the
power spectrum of his/her EEG.
(3) When the person is in the alert state, he/she can
be modeled reasonably well using a multivariate
distribution of the power spectrum.
(4) The alert model expresses well the EEG spectra when
the subject remains alert or returns to alert state from
drowsiness.
One can argue that the subject may already be in a drowsy
state when he/she begins driving. If that is really true, then
that can be detected by checking the consistency between
two alert models derived using data in two successive time
intervals. In other words, we can check whether the two
alert-models identification in two successive time intervals
are statistically the same or not. If the subject was already
in a drowsy state, then he/she will either move to a deep
drowsy/sleepy state or will transit to an alert state. In both
cases, the two models will not be statistically the same.
Here, we use a multivariate distribution to model
the distribution of power spectrum in the alert state. In
particular, every 2 seconds, we calculate the power spectrum
vector in p dimension (in our experiment p
= 4 (theta-
band) or p
= 5 (alpha-band)). In this way, a set of n = 30
data vectors
{x
1
, , x
30
} is generated in every minute. We
use3minutesofspectraldatatoderivethealertmodel.The
alert model is represented and characterised by a multivariate
normal distribution N(μ,Σ
2
), where μ is the mean vector and
Σ is the variance-covariance matrix.
We use the maximum likelihood estimates for μ and
Σ
2
. After finding the alert model, we check whether the
EEG spectrum in the alpha-band (also in theta-band) indeed
follows a multivariate normal using Mardia’s test [31–33].
If the model passes the Mardia’s test, we accept that model
as the alert model. Otherwise, we move the data window
by one minute and again use the next 3 minutes of data to
derive and validate the model using Mardia’s test. Once a
model is built, a significant deviation from the model can
be taken as a departure from alertness. Note that we are
saying “departure from alertness” which is not necessarily
drowsiness. For example, the subject could be excited over
a continued conversation over a mobile phone. In this case,
although the person is not drowsy, he/she is not alert as
far as the driving task is concerned and hence needs to be
cautioned. Thus our approach is more useful than typical
drowsiness detection systems. A consistent and significant
deviation for some time can be taken as an indicator of
drowsiness.
For the sake of completeness, we briefly explain the
Mardia’s test of multivariate normality. Given a random
Nikhil R. Pal et al. 5
Table 1: The average correlation between mahalanobis distance and driving error of all subjects for different channels.
Pole F7 F3 FZ F4 F8 FT7 FC3 FCZ FC4 FT8
MDA 0.52 0.45 0.59 0.47 0.47 0.53 0.59 0.60 0.56 0.48
MDT 0.13 0.25 0.42 0.23 0.09 0.27 0.56 0.60 0.46 0.13
Pole T3 C3 CZ C4 T4 TP7 CP3 CPZ CP4 TP8
MDA 0.60 0.58 0.58 0.54 0.48 0.54 0.57 0.57 0.51 0.52
MDT 0.38 0.60 0.63 0.54 0.34 0.53 0.58 0.67 0.55 0.53
Pole P7 P3 PZ P4 P8 O1 OZ O2 — —
MDA 0.56 0.56 0.52 0.53 0.53 0.60 0.64 0.64 — —
MDT 0.57 0.64 0.66 0.63 0.65 0.71 0.74 0.73 — —
sample, X ={x
1
, , x
n
} in R
p
, Mardia [32–34] defined the
p-variate skewness and kurtosis as
b
1,p
=
1
n
2
n
i=1
n
j=1
x
i
− x
S
−1
x
j
− x
3
,
b
2,p
=
1
n
n
i=1
x
i
− x
S
−1
x
i
− x
2
.
(1)
In (1)
x and S represent the sample mean vector and
covariance matrix, respectively. In the case of univariate data,
b
1,p
and
b
2,p
reduce to the usual univariate measures
skewness and kurtosis, respectively. If the sample is obtained
from a multivariate normal distribution, then the limiting
distribution of
b
1,p
is a chi-square with p(p +1)(p +
2)/6 degrees of freedom, while that of
√
n (b
2,p
− p(p +
2))/8
p(p +2) isN(0, 1). Hence, we can use these statistics
to test multivariate normality. In all our experiments, we
have used the routines available for Mardia’s test in the R-
package [35].
After the alert model is found, we use it to assess the
subject’s cognitive state. This is done by finding how the
subject’s present state, as represented by the EEG power
spectra, is different from the state represented by the alert
model. The deviation of the present state from the model is
computed using Mahalanobis distance [36] that can account
for the covariance between variables while computing the
distance. Let the alert model computed using the alpha-
band be represented by (
x, S)
A
and that by the theta-band
be represented by (
x, S)
T
.Letx be a vector representing the
power spectra in the alpha-band (or in the theta-band) of the
EEG of the subject at some time instant, then the deviation
of the present state from the model is
MD
∗
(x) =
x − x
T
S
−1
x − x
. (2)
In (2) if we use the alpha-band model, then
∗ is A,and
for the theta-band model and data,
∗ will be T. Thus, the
deviation from the alpha-band model will be denoted by
MDA and that for the theta-band model will be denoted by
MDT. Similar to the preprocessing of the indirect alertness
level index (driving performance), the MDA/MDT is also
smoothed by the moving average method using a window
with 45 values (i.e., the average is over 90 seconds). The
moving average window is shifted by just one value (i.e., 2
seconds). For a better visual display, we have scaled the MD
∗
values by subtracting the average MD
∗
computed over the
training data used for finding the alert model.
We will see later that the deviation from either the alpha-
band model (i.e., MDA) or the theta-band model (i.e., MDT)
can be used to detect departure from the alart cognitive
state. This raises a natural question: can a combined use of
MDA and MDT do a better job than individual ones. To
explore such a possibility we use a linear combination MDA
and MDT to compute a combined measure of deviation as
MDC
= a·MDA + (1 −a)·MDT, 0 ≤ a ≤ 1.
Now, in order to demonstrate that MD
∗
(
∗
= MDA/
MDT/MDC) can be used to detect changes in the cognitive
states, we compute the linear correlation between the
alertness level index (d) and the smoothed Mahalanobis
distance (MD
∗
). In our subsequent discussion MD
∗
will
represent the smoothed deviations, that is, the smoothed
values of MDA, MDT, and MDC as the case may be. The
correlation coefficient is defined as
Corr
d,MD
∗
=
d − d
MD
∗
− MD
∗
d − d
2
MD
∗
− MD
∗
2
. (3)
4. EXPERIMENT RESULTS
There are a few important issues to be resolved before we
can proceed with the detailed analysis. The first issue is how
to decide the optimal window size for feature extraction
(computing FFT). For this, we have tried various choices and
have found that 2-second signal does a reasonably good job
and that is what we use here. Note that one can use a more
systematic approach using training and validation data to
find the optimal window size. The next issue is the choice of
channels to be used for analysis. We have data from 28 EEG
channels and we wanted to use only one channel. To find
the most useful channel for the problem at hand, for each
channel we compute the average correlation (averaged over
all subjects) between MDA and the driving performance.
Similarly, we also compute the average correlation between
MDT and the driving performance. These correlation values
are summarised in Ta ble 1. Ta ble 1 reveals that the highest
correlation occurs for channel OZ both with MDT and
MDA. This suggests that channel OZ is better than other
6 EURASIP Journal on Advances in Signal Processing
17
18
19
20
21
22
23
Alpha-power (dB)
0 5 10 15 20 25 30 35 40
Driving performance
(a)
19
20
21
22
23
24
25
Theta-power (dB)
0 5 10 15 20 25 30 35 40
Driving performance
(b)
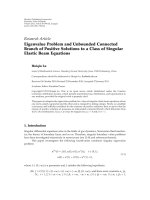
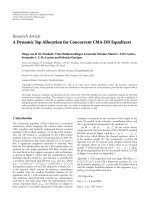
Figure 3: Error-sorted EEG spectra at OZ over 13 sessions. (a) The solid lines represent the grand mean power spectra and the dotted lines
represent the standard deviations of the power spectra. When the driving error increases from 0 to 20, the mean of alpha-power (8
∼12 Hz)
rises sharply and monotonically from 19 to 21 dB, after which it remains more or less stable near 2 dB above the baseline. (b) The mean of
theta-power (4
∼7 Hz) increases monotonically and steadily from 20 to 23 dB as the driving error increases (alertness to deep drowsiness).
channels in discriminating departure from alertness. The
channels O1 and O2 which are neighbors of OZ also exhibit a
very high correlation. Since we have decided to use only one
channel, we have chosen channel OZ for further study.
To investigate the relationship between the driver’s per-
formance and the concurrent changes in the EEG spectrum,
we have sorted the EEG power spectra in alpha-band by
smoothed driving error. The similar sorting is also done
for power in the theta-band. Figure 3(a) depicts the relation
between the alpha-power and the driving error, while
Figure 3(b) displays the same for theta-power. Figure 3(a)
reveals that when the driving error increases from 0 to
20, the mean of alpha-power (8
∼12 Hz) rises sharply and
monotonically from 19 to 21 dB, after that it slowly goes
down a little bit. While for the theta-power (Figure 3(b)), the
mean power (4
∼7 Hz) increases monotonically and steadily
from 20 to 23 dB as the driving error increases (alertness to
deep drowsiness).
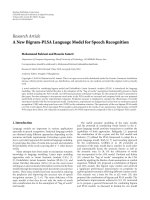
Our alert model does not use EEG power, but MDT and
MDA. So, next we check how strongly MDA and MDT are
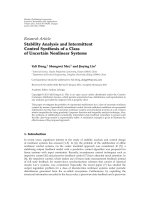
correlated with the driving performance. Figure 4(a) shows
the relation between driving error and MDA (across the 13
test subjects/sessions) while Figure 4(b) exhibits the same for
MDT. It is interesting to see that Figures 3 and 4 exhibit
almost the same behaviour; in fact, for Figure 4(b) we find
that compared to Figure 3(b), the average MDT increases
more steadily with driving performance.
Can we say that the use of MD
∗
would be more useful
than the use of alpha- and theta-power? To address this
question, for every subject we have computed the correlation
between power (in alpha- and theta-bands) and driving error
and also the correlation between MD
∗
(MDA and MDT)
and driving error. Tabl e 2 summarises the correlation values.
Ta ble 2 reveals that of the 26 sets of correlation values, in
Table 2: The comparison of the correlation between power
and driving performance and MD
∗
and driving performance for
channel OZ.
Subjects
Power correlation Distance correlation
(alpha/theta) (MDA/MDT)
S1 0.57/0.34 0.75/0.73
S2 0.70/0.51 0.69/0.47
S3 0.63/0.60 0.67/0.65
S4 0.26/0.14 0.47/0.41
S5 0.66/0.79 0.62/0.85
S6 0.26/0.88 0.63/0.85
S7 0.66/0.97 0.57/0.96
S8 0.04/0.72 0.76/0.80
S9 0.41/0.78 0.39/0.77
S10 0.60/0.87 0.76/0.88
S11 0.40/0.57 0.53/0.90
S12 0.35/0.52 0.24/0.62
S13 0.40/0.94 0.45/0.95
Average 0.45/0.62 0.58/0.76
16 cases the correlation has increased with MD
∗
.Inafew
cases, the increase in correlation is very high. For example,
with subject S8, the correlation with alpha-power is only
0.04 while that with MDA is 0.76. Similarly, for S6, the
alpha-power correlation is 0.26 which enhances to 0.63 for
MDA. This clearly indicates the effectiveness of the alert
model. Table 2 also displays the average correlation values.
The average correlation with deviations from the model is
increased by about 30% for alpha-band, while that for the
theta-band is increased by about 23%.
Nikhil R. Pal et al. 7
5
6
7
8
9
10
11
12
MDA
0 5 10 15 20 25 30 35 40
Driving performance
(a)
4
5
6
7
8
9
10
11
MDT
0 5 10 15 20 25 30 35 40
Driving performance
(b)
Figure 4: Error-sorted MD for different sessions. (a) The solid lines represent the grand mean MD and the dotted lines represent its standard
deviations. When the driving error increases from 0 to 20, the MDA rises sharply and monotonically from 5 to 9, after which it remains more
or less stable. (b) The MDT increases monotonically and steadily from 4 to 9 as the driving error increases (alertness to deep drowsiness).
Table 3: All combination correlations of all subjects by using OZ channel
Subjects
Correlation
(MDA/MDT)
Correlation 0.1
∗
MDA 0.9
∗
MDT
Correlation 0.3
∗
MDA 0.7
∗
MDT
Correlation 0.5
∗
MDA 0.5
∗
MDT
Correlation 0.7
∗
MDA 0.3
∗
MDT
Correlation 0.9
∗
MDA 0.1
∗
MDT
S1
0.75/0.73 0.75 0.78 0.77 0.77 0.75
S2
0.69/0.47 0.59 0.67 0.69 0.69 0.69
S3
0.67/0.65 0.66 0.68 0.69 0.69 0.68
S4
0.47/0.41 0.43 0.46 0.48 0.48 0.47
S5
0.62/0.85 0.84 0.80 0.75 0.70 0.65
S6
0.63/0.85 0.86 0.86 0.85 0.83 0.74
S7
0.57/0.96 0.95 0.92 0.84 0.74 0.62
S8
0.76/0.80 0.80 0.81 0.82 0.81 0.79
S9
0.39/0.77 0.77 0.75 0.69 0.58 0.45
S10
0.76/0.88 0.88 0.88 0.87 0.85 0.81
S11
0.53/0.90 0.92 0.90 0.86 0.74 0.60
S12
0.24/0.62 0.64 0.65 0.67 0.65 0.45
S13
0.45/0.95 0.95 0.93 0.87 0.75 0.56
Average
0.58/0.76 0.77 0.78 0.76 0.71 0.64
4.1. Linear combination of model deviations
The analysis above provides strong and convincing evidence
that changes in the driving performance during a long
driving session are related to the changes in the EEG power
in the alpha- and theta-bands. In the given experimental
setup, higher driving error corresponds to departure from
alert state of mind. Thus, departures from alert cognitive
state are reflected in the EEG power of the alpha- and theta-
bands. The change (correlation) is more strongly visible
in the deviations from the alert model derived based on
multivariate normal distribution. We have experimented
with two models, one based on alpha-band and other based
on the theta-band. Both appear quite effective. But can we
improve it further using the two bands/models together?
Figure 5 displays the MDT and MDA as a function of driving
error. From these figures as well as from Ta ble 2,wefind
that driving errors of mild drowsy cases are more strongly
related to MDA, while MDT is highly correlated with driving
performance for cases when the subject went to a deep
drowsy state. Thus, if we can use the right model based on
alpha-band or theta-band, we can do a better detection. But
in reality, we will not know beforehand which model to use.
So a combined model could be more useful.
To examine this possibility, we consider a very simple
liner combination of MDA and MDT as MDC
= a·MDA +
(1
− a)·MDT, 0 ≤ a ≤ 1. There are infinitely possible
choices for the constant a in the linear combination. We have
8 EURASIP Journal on Advances in Signal Processing
0
0 1000 30002000 0 1000 30002000 0 1000 30002000
0 1000 30002000 0 1000 30002000 0 1000 30002000
0
1000 30002000
0 1000 30002000 0 1000 30002000
0 1000 30002000
0 1000 30002000 0 1000 30002000
0
1000 30002000
50
0
50
20
10
0
20
10
0
20
10
0
20
10
0
20
10
0
20
10
0
20
10
0
20
10
0
20
10
0
20
10
0
20
10
0
20
10
0
20
10
0
0
50
0
50
0
50
0
50
0
50
0
50
0
50
0
50
0
50
0
50
0
50
Driving performanceDriving performanceDriving performanceDriving performanceDriving performance
Driving performance
MDA/
Time (s)
Time (s)
Time (s)
Time (s)
Time (s)
Time (s)
Time (s)
Time (s)
Time (s)
Time (s)
Time (s)
Time (s)
Time (s)
MDA
MDT
S1
S4
S7
S10
S2
S5
S8
S11
S3
S6
S9
S12
S13
MDTMDA/MDTMDA/MDTMDA/MDT
Figure 5: MDT and MDA versus actual driving performance. Some subjects such as S1 experienced mild drowsiness and MDA is strongly
correlated with subject’s driving performance. Another subject, S10, was in a deep drowsy state and for this subject MDT is highly correlated
with its driving performance.
used a grid search starting from a = 0toa = 1withan
increment of 0.1 and for every such linear combination we
have computed the correlation of MDC with a driving error.
Based on the limited dataset that we have used, we found
a
= 0.3 as the best choice. Ta ble 3 lists the correlation values
for a few illustrative cases. Note that in the second column
we have two correlation values x/y,wherex corresponds to
MDA (i.e., a
= 1) and y corresponds to MDT (i.e., a = 0).
The bottom row in Ta ble 3 shows the average correlations of
all combinations from thirteen subjects. Displays the average
correlation values. Although the improvement in average
correlation is marginal, what is important is that for the
combined model for both deep drowsy and mild drowsy
cases we get a very good correlation. As anexample, for
subject S9, if we use MDA, the correlation is only 0.39, while
using MDC, for all combinations the correlation is higher
than that with MDA. This justifies the utility of the combined
model. Figure 6 depicts the driving error and the MDC for
all 13 subjects. It is clear from these figures that, on average,
MDC is in more agreement with the driving error.
Nikhil R. Pal et al. 9
0
0 1000 30002000 0 1000 30002000 0 1000 30002000
0 1000 30002000 0 1000 30002000 0 1000 30002000
0
1000 30002000
0 1000 30002000 0 1000 30002000
0 1000 30002000
0 1000 30002000 0 1000 30002000
0
1000 30002000
50
0
50
20
10
0
20
10
0
20
10
0
20
10
0
20
10
0
20
10
0
20
10
0
20
10
0
20
10
0
20
10
0
20
10
0
20
10
0
20
10
0
0
50
0
50
0
50
0
50
0
50
0
50
0
50
0
50
0
50
0
50
0
50
Driving performanceDriving performanceDriving performanceDriving performanceDriving performance
Driving performance
Time (s)
Time (s)
Time (s)
Time (s)
Time (s)
Time (s)
Time (s)
Time (s)
Time (s)
Time (s)
Time (s)
Time (s)
Time (s)
MDC
S1
S4
S7
S10
S2
S5
S8
S11
S3
S6
S9
S12
S13
MDCMDCMDCMDC
Figure 6: The time series of MDC (0.3 MDA + 0.7 MDT) from OZ channel and the driving performance of all subjects. The black line
represents driving performance and the blue line corresponds to MDC. The MDC is found to be highly correlated with driving performance.
5. DISCUSSIONS
We have assumed that when a subject starts driving, he is in
an alert state. However, this may not necessarily be true. If
the person is not in an alert state (i.e., he/she is in a drowsy
state), then either he will move to a deep drowsy state or
will get to the alert state with time. Thus his/her EEG power
spectrum will change with time. This type of situations can
be detected using a consistency check as explained earlier.
For example, we can find two alert models of the person
at time instant t second and at t + δ second, where δ can
be 180 seconds. If the person is in an alert state, then these
two models will be statistically the same. So we can use such
hypothesis testing to authenticate whether the person is in
an alert state at the beginning or not. If desired, this can
be further strengthened having a stored alert model. If the
consistency check explained above fails, then we can check
the similarity between the stored model and the model just
found. If these two models are also significantly different, this
will further suggest that the person is not in an alert state.
The dataset used in this study is not very big. From
the 13 subjects, four subjects were mild drowsy during
the driving experiments, while the remaining subjects went
through episodes of mild drowsy to deep drowsy states.
To demonstrate the effectiveness of this method, further
investigation using a bigger set needs to be done.
We have used only OZ channel. Use of O1 and O2
along with OZ might improve the system performance.
10 EURASIP Journal on Advances in Signal Processing
In this investigation, we have demonstrated the feasibility of
an unsupervised subject and session independent approach
to detect departure from alertness in driver. In future, we
plan to identify thresholds on MDA/MDT/MDC which can
be used to label the driver’s cognitive state as alert/mild
drowsy/deep drowsy. This will require some validation data
as well as authentication by experts. Once this is done, such
thresholds can be used in conjunction with the unsupervised
method. We keep all these for our future investigation.
6. CONCLUSIONS
In this study, we propose an unsupervised approach that
in every driving session generates a statistical model of the
alert state of the subject using a very limited data obtained
at the beginning of the driving session. Our model makes
a few very realistic assumptions to derive the alert-state
model. We assume that the EEG power spectrum in an
alert state can be reasonably modeled using a multivariate
normal distribution. The model is first validated statistically
and then used to asses the cognitive state of the driver. A
significant deviation from the model is taken as a departure
from the alert state. We also attempt to find good choices
of channel(s) and EEG features for assessing the drowsiness-
related EEG dynamics. We have found that OZ is an effective
channel and the power spectra in the theta-band and alpha-
band have good discriminating power. We have derived three
models: one based on alpha-band spectrum, one based on
the theta-band power spectrum, and the third one combines
the deviations of the subjects’ present cognitive state from the
two models. We have demonstrated that the deviation of the
subjects present cognitive state from the alert model covaries
with the driving performance which is an indirect measure of
operators’ changing levels of alertness when they perform a
realistic driving task in a VR-based driving simulator. Unlike
most supervised methods, our method can account for large
individual and cross-session variability in EEG dynamics.
REFERENCES
[1] R. S. Huang, C. J. Kuo, L L. Tsai, and O. T. C. Chen, “EEG pat-
tern recognition-arousal states detection and classification,”
in Proceedings of IEEE Internat ional Conference on Neural
Networks (ICNN ’96), vol. 2, pp. 641–646, Washington, DC,
USA, June 1996.
[2] A. Vuckovic, V. Radivojevic, A. C. N. Chen, and D. Popovic,
“Automatic recognition of alertness and drowsiness from EEG
by an artificial neural network,” Medical Engineering and
Physics, vol. 24, no. 5, pp. 349–360, 2002.
[3]S.Roberts,I.Rezek,R.Everson,H.Stone,S.Wilson,andC.
Aiford, “Automated assessment of vigilance using committees
of radial basis function analysers,” IEE Proceedings: Science,
Measurement and Technology, vol. 147, no. 6, pp. 333–338,
2000.
[4] K. B. Khalifa, M. H. Bedoui, R. Raytchev, and M. Dogui, “A
portable device for alertness detection,” in Proceedings of the
1st Annual International Conference on Microtechnologies in
Medicine and Biology (MMB ’00), pp. 584–586, Lyon, France,
October 2000.
[5] B. J. Wilson and T. D. Bracewell, “Alertness monitor using
neural networks for EEG analysis,” in Proceedings of the
10th IEEE Workshop on Neural Network for Signal Processing
(NNSP ’00), vol. 2, pp. 814–820, Sydney, Australia, December
2000.
[6]K.F.VanOrden,W.Limbert,S.Makeig,andT.P.Jung,“Eye
activity correlates of workload during a visuospatial memory
task,” Human Factors, vol. 43, no. 1, pp. 111–121, 2001.
[7] M. Matousek and I. Petersen, “A method for assessing alertness
fluctuations from EEG spectra,” Electroencephalography and
Clinical Neurophysiology, vol. 55, no. 1, pp. 108–113, 1983.
[8] J.Beatty,A.Greenberg,W.P.Deibler,andJ.O’Hanlon,“Oper-
ant control of occipital theta rhythm affects performance, in
a radar monitoring task,” Science, vol. 183, no. 4127, pp. 871–
873, 1974.
[9] J. A. Stern, D. Boyer, and D. Schroeder, “Blink rate: a possible
measure of fatigue,” Human Factors, vol. 36, no. 2, pp. 285–
297, 1994.
[10] D. Schmidt, L. A. Abel, L. F. Dell’Osso, and R. B. Daroff,
“Saccadic velocity characteristics: intrinsic variability and
fatigue,” Aviation Space and Environmental Medicine, vol. 50,
no. 4, pp. 393–395, 1979.
[11] D.K.McGregorandJ.A.Stern,“Timeontaskandblinkeffects
on saccade duration,” Ergonomics, vol. 39, no. 4, pp. 649–660,
1996.
[12] K. F. Van Orden, T P. Jung, and S. Makeig, “Combined eye
activity measures accurately estimate changes in sustained
visual task performance,” Biological Psychology, vol. 52, no. 3,
pp. 221–240, 2000.
[13] C. Jutten and J. Herault, “Blind separation of sources—part I:
an adaptive algorithm based on neuromimetic architecture,”
Signal Processing, vol. 24, no. 1, pp. 1–10, 1991.
[14] P. Comon, “Independent component analysis: a new con-
cept?” Signal Processing, vol. 36, no. 3, pp. 287–314, 1994.
[15] A. J. Bell and T. J. Sejnowski, “An information-maximization
approach to blind separation and blind deconvolution,”
Neural Computation, vol. 7, no. 6, pp. 1129–1159, 1995.
[16] M. Girolami, “An alternative perspective on adaptive indepen-
dent component analysis algorithms,” Neural Computation,
vol. 10, no. 8, pp. 2103–2114, 1998.
[17] T W. Lee, M. Girolami, and T. J. Sejnowski, “Independent
component analysis using an extended infomax algorithm
for mixed sub-Gaussian and super-Gaussian sources,” Neural
Computation, vol. 11, no. 2, pp. 417–441, 1999.
[18] C. T. Lin, N. R. Pal, C. Y. Chuang, T. P. Jung, L. W. Ko, and
S. F. Liang, “An EEG-based subject- and session-independent
drowsiness detection,” in Proceedings of International Joint
Conference on Neural Networks (IJCNN) and the World
Congress on Computational Intelligence (WCCI), pp. 3448–
3454, Hong Kong, June 2008.
[19] C T. Lin, R C. Wu, T P. Jung, S F. Liang, and T Y. Huang,
“Estimating driving performance based on EEG spectrum
analysis,” EURASIP Journal on Applied Signal Processing, vol.
2005, no. 19, pp. 3165–3174, 2005.
[20] C T. Lin, R C. Wu, S F. Liang, W H. Chao, Y J. Chen, and
T P. Jung, “EEG-based drowsiness estimation for safety driv-
ing using independent component analysis,” IEEE Transactions
on Circuits and Systems I, vol. 52, no. 12, pp. 2726–2738, 2005.
[21] H. Ueno, M. Kaneda, and M. Tsukino, “Development of
drowsiness detection system,” in Proceedings of the Vehicle
Navigation and Information Systems Conference (VNIS ’94),
pp. 15–20, Yokohama, Japan, August 1994.
Nikhil R. Pal et al. 11
[22] S. Makeig and T P. Jung, “Changes in alertness are a principal
component of variance in the EEG spectrum,” NeuroReport,
vol. 7, no. 1, pp. 213–216, 1995.
[23] T P. Jung, S. Makeig, M. Stensmo, and T. J. Sejnowski,
“Estimating alertness from the EEG power spectrum,” IEEE
Transactions on Biomedical Engineering, vol. 44, no. 1, pp. 60–
69, 1997.
[24] S. Makeig and M. Inlow, “Lapses in alertness: coherence of
fluctuations in performance and EEg spectrum,” Electroen-
cephalography and Clinical Neurophysiology, vol. 86, no. 1, pp.
23–35, 1993.
[25] S. Makeig and T P. Jung, “Tonic, phasic, and transient EEG
correlates of auditory awareness in drowsiness,” Cognitive
Brain Research, vol. 4, no. 1, pp. 15–25, 1996.
[26] W. Klimesch, “EEG alpha and theta oscillations reflect cogni-
tive and memory performance: a review and analysis,” Brain
Research Reviews, vol. 29, no. 2-3, pp. 169–195, 1999.
[27] S. Makeig, T P. Jung, and T. J. Sejnowski, “Awareness during
drowsiness: dynamics and electrophysiological correlates,”
Canadian Journal of Experimental Psychology, vol. 54, no. 4,
pp. 266–273, 2000.
[28] M. A. Schier, “Changes in EEG alpha power during simulated
driving: a demonstration,” International Journal of Psychophys-
iology, vol. 37, no. 2, pp. 155–162, 2000.
[29] S L. Joutsiniemi, S. Kaski, and T. A. Larsen, “Self-organizing
map in recognition of topographic patterns of EEG spectra,”
IEEE Transactions on Biomedical Engineering, vol. 42, no. 11,
pp. 1062–1068, 1995.
[30] K. V. Mardia, “Mardia’s test of multinormality,” in Encyclope-
dia of Statistical Sciences, S. Kotz and N. L. Johnson, Eds., vol.
5, pp. 217–221, John Wiley & Sons, New York, NY, USA, 1985.
[31] M. Steriade, “Central core modulation of spontaneous oscil-
lations and sensory transmission in thalamocortical systems,”
Current Opinion in Neurobiology, vol. 3, no. 4, pp. 619–625,
1993.
[32] K. V. Mardia, “Measures of multivariate skewness and kurtosis
with applications,” Biometrika, vol. 57, no. 3, pp. 519–530,
1970.
[33] K. V. Mardia, “Applications of some measures of multivariate
skewness and kurtosis in testing normality and robustness
studies,” Sankhya B, vol. 36, no. 2, pp. 115–128, 1974.
[34] K. V. Mardia, “Tests of univariate and multivariate normality,”
in Handbook of Statistics, S. Kotz, Ed., vol. 1, pp. 279–320,
North-Holland, Amsterdam, The Netherlands, 1980.
[35] />[36] P. C. Mahalanobis, “Generalized distance in statistics,” Pro-
ceedings of the National Institute of Science of India, pp. 49–55,
1936.