Báo cáo hóa học: " Review Article Multimodal Pressure-Flow Analysis: Application of Hilbert Huang Transform in Cerebral Blood Flow Regulation" docx
Bạn đang xem bản rút gọn của tài liệu. Xem và tải ngay bản đầy đủ của tài liệu tại đây (1.77 MB, 15 trang )
Hindawi Publishing Corporation
EURASIP Journal on Advances in Signal Processing
Volume 2008, Article ID 785243, 15 pages
doi:10.1155/2008/785243
Review Article
Multimodal Pressure-Flow Analysis: Application of Hilbert
Huang Transform in Cerebral Blood Flow Regulation
Men-Tzung Lo,
1, 2, 3
Kun Hu,
1
Yanhui Liu,
4
C K. Peng,
2
and Vera Novak
1
1
Division of Gerontology, Beth Israel Deaconess Medical Center, Harvard Medical School, Boston, MA 02115, USA
2
Division of Interdisciplinary Medicine & Biotechnology and Margret & H.A. Rey Institute for Nonlinear Dynamics in Medicine,
Beth Israel Deaconess Medical Center, Harvard Medical School, Boston, MA 02115, USA
3
Research Center for Adaptive Data Analysis, National Central University, Chungli 32054, Taiwan
4
DynaDx Corporation, Mountain View, CA 94041, USA
Correspondence should be addressed to Vera Novak,
Received 3 September 2007; Revised 15 February 2008; Accepted 14 April 2008
Recommended by Daniel Bentil
Quantification of nonlinear interactions between two nonstationary signals presents a computational challenge in different
research fields, especially for assessments of physiological systems. Traditional approaches that are based on theories of stationary
signals cannot resolve nonstationarity-related issues and, thus, cannot reliably assess nonlinear interactions in physiological
systems. In this review we discuss a new technique called multimodal pressure flow (MMPF) method that utilizes Hilbert-Huang
transformation to quantify interaction between nonstationary cerebral blood flow velocity (BFV) and blood pressure (BP) for the
assessment of dynamic cerebral autoregulation (CA). CA is an important mechanism responsible for controlling cerebral blood
flow in responses to fluctuations in systemic BP within a few heart-beats. The MMPF analysis decomposes BP and BFV signals
into multiple empirical modes adaptively so that the fluctuations caused by a specific physiologic process can be represented in a
corresponding empirical mode. Using this technique, we showed that dynamic CA can be characterized by specific phase delays
between the decomposed BP and BFV oscillations, and that the phase shifts are significantly reduced in hypertensive, diabetics and
stroke subjects with impaired CA. Additionally, the new technique can reliably assess CA using both induced BP/BFV oscillations
during clinical tests and spontaneous BP/BFV fluctuations during resting conditions.
Copyright © 2008 Men-Tzung Lo et al. This is an open access article distributed under the Creative Commons Attribution License,
which permits unrestricted use, distribution, and reproduction in any medium, provided the original work is properly cited.
1. INTRODUCTION
Previous works have demonstrated that fluctuations in phys-
iological signals carry important information reflecting the
mechanisms underlying control processes and interactions
among organ systems at multiple time scales. A major
problem in the analysis of physiological signals is related
to nonstationarities (statistical properties such as mean and
standard deviation vary with time), which is an intrinsic
feature of physiological data and persists even without
external stimulation [1–3]. The presence of nonstation-
arities makes traditional approaches assuming stationary
signals not reliable. To resolve the difficulties related to
nonstationary behavior, concepts and methods derived from
statistical physics have been applied in the studies of different
control mechanisms including locomotion control [4–6],
cardiac regulation [7, 8], cardio-respiratory coupling [9–
11], renal vascular autoregulation [12], cerebral blood flow
regulation [13–16], and circadian rhythms [17–19]. One of
the innovative approaches applied to physiological studies is
Hilbert Huang transform (HHT) [20]. The HHT is based
on nonlinear chaotic theories and has been designed to
extract dynamic information from nonstationary signals
at different time scales. The advantages of the HHT over
traditional Fourier-based methods have been appreciated
in many studies of different physiological systems such as
blood pressure hemodynamics [21], cerebral autoregulation
[13, 15, 16], cardiac dynamics [22], respiratory dynamics
[23], and electroencephalographic activity [24]. In this
review, we focus on the computational challenge on the
quantification of interactions between two nonstationary
physiologic signals. To demonstrate progress in resolving the
generic problem related to nonstationarities, we review the
recent applications of nonlinear dynamic approaches based
on HHT to one specific physiological control mechanism—
cerebral blood flow regulation.
2 EURASIP Journal on Advances in Signal Processing
Cerebral autoregulatory mechanisms are engaged to
compensate for metabolic demands and perfusion pressure
variations under physiologic and pathologic conditions [25,
26]. Dynamic autoregulation reflects the ability of the
cerebral microvasculature to control perfusion by adjusting
the small-vessel resistances in response to beat-to-beat blood
pressure (BP) fluctuations by involving myogenic and neu-
rogenic regulation. Reliable and noninvasive assessment of
cerebral autoregulation (CA) is a major challenge in medical
diagnostics. Transcranial Doppler ultrasound (TCD) enables
assessment of dynamic CA during interventions with sudden
systemic BP changes induced by the Valsalva maneuver
(VM), head-up tilt, and sit-to-stand test in various medical
conditions [13, 26–34]. Conventional approaches typically
model cerebral regulation using mathematical models of a
linear and time-invariant system to simulate the dynamics
of BP as an input to the system, and cerebral blood flow
as output. A transfer function is typically used to explore
the relationship between BP and cerebral blood flow velocity
(BFV) by calculating gain and phase shift between the BP
and BFV power spectra [26, 35–40]. Many studies have
shown that transfer function can identify alterations in
BP-BFV relationship under pathologic conditions such as
stroke, hypertension, and traumatic brain injuries that are
associated with impaired autoregulation [26, 35–39, 41–43].
This Fourier transform-based approach, however, assumed
that signals are composed of superimposed sinusoidal oscil-
lations of constant amplitude and period at a predetermined
frequency range. This assumption puts an unavoidable
limitation on the reliability and application of the method,
because BP and BFV signals recorded in clinical settings are
often nonstationary and are modulated by nonlinearly inter-
acting processes at multiple time-scales corresponding to the
beat-to-beat systolic pressure, respiration, spontaneous BP
fluctuations, and those induced by interventions.
To overcome problems in CA evaluations related to
nonstationarity and nonlinearity, several approaches derived
from concepts and methods of nonlinear dynamics have
been proposed [13–16, 44–47]. A novel computational
method called multimodal pressure-flow (MMPF) analysis
was recently developed to study the BP-BFV relationship
during the Valsalva maneuver (VM) [13]. The MMPF
method enables evaluation of autoregulatory dynamics based
on instantaneous phase analysis of BP and BFV oscillations
induced by the intervention (a sudden reduction of BP
and BFV followed by an increase in both signals). The
MMPF applies an empirical mode decomposition (EMD)
algorithm to decompose complex BP and BFV signals into
multiple empirical modes [21]. Each mode represents a
frequency-amplitude modulation in a narrow frequency
band that can be related to a specific physiologic process.
For example, this technique can easily identify BP and BFV
oscillations induced by the VM (0.1–0.03 Hz, i.e., period
∼10 to 30 seconds). Using this method, a characteristic
phase lag between BFV and BP fluctuations corresponding
to VM was found in healthy subjects, and this phase lag
was reduced in patients with hypertension and stroke [13].
These findings suggested that BFV-BP phase lag could serve
as an index of CA. However, intervention procedures, such
as the VM, introduce large intracranial pressure fluctuations
and also require patients’ active participation. As a result,
such procedures are not applicable under various clinical
conditions, such as in acute care settings.
It has been hypothesized that CA can be evaluated from
spontaneous BP-BFV fluctuations during resting conditions
[14–16]. This hypothesis has been motivated by the facts that
(i) CA is a continuous dynamic process so that it should
always engage to regulate cerebral blood flow, and (ii) BP
and BFV display spontaneous fluctuations at different time
scales [38, 39, 48–50] even during resting conditions. Since
spontaneous BP and BFV fluctuations can be entrained
by respiration or other external perturbation over a wide
frequency range [0.05–0.4 Hz] [51, 52] and the dominant
frequency of spontaneous BP fluctuations varies among
individuals over time and under different test conditions,
reliable measures of the nonlinear BFV-BP relationship
without preassuming oscillation frequencies and waveform
shapes are needed. These requirements are well satisfied
by the MMPF algorithm which extracts intrinsic BP and
BFV oscillations embedded in the original signals and
quantifies instantaneous phase relationship between them. If
the MMPF is sensitive and can provide reliable estimation of
autoregulation using spontaneous BP and BFV fluctuations,
it is expected that, similar to BP and BFV oscillations
introduced by the VM, spontaneous BFV and BP oscillations
during resting conditions should also exhibit specific phase
shifts.
In this review, we present an overview of the transfer
function analysis (TFA) that was traditionally used to
quantify CA (Section 2) and of the MMPF method and its
modifications (Section 3). In Section 4, we introduce a newly
developed automatic algorithm for the improved MMPF
method as well as engineering aspects that will potentially
lead to a fully automated analysis without expert input.
In Section 5, we review previous applications of MMPF in
clinical studies [15, 16], in which the ability and reliability
of the method in assessing the CA from spontaneous BP-
BFV fluctuations during resting conditions were evaluated
(Section 5). Specifically, we discuss the MMPF results in
three pathological conditions that are associated with car-
diovascular complications affecting cerebrovascular control
systems (stroke, hypertension, and diabetes) [53–57]. Our
previous studies have shown altered CA in these conditions
[13, 15, 16]. Additionally, a comparison of the MMPF and
the TFA results in the study of type 2 diabetes was discussed.
In Section 6, we discuss why nonlinear dynamic approaches
such as the MMPF can more reliably quantify nonlinear
relationship between nonstationary signals.
2. TRANSFER FUNCTION ANALYSIS
Transfer function analysis which has been widely used in
the CA assessment [35, 58] is based on Fourier transform.
BP and BFV signals are decomposed into multiple sinu-
soidal waveforms in order to compare the amplitudes and
phases of BP and BFV components at different frequencies.
The coherence representing the degree of similarity in
the variation (phase or amplitude) of two signals within
Men-Tzung Lo et al. 3
specific frequencies, then, can be evaluated through the
cross-spectrum. In general, a strong coherence indicates
dysfunction of CA.
The BP and BFV time series are first linearly detrended
and divided into 5000-point (100-seconds) segments with
50% overlap. The Fourier transform of BP, denoted as S
p
( f ),
and BFV, denoted as S
V
( f ), is calculated for each segment
with a spectral resolution of 0.01 Hz, and was used to
calculate the transfer function:
H(f )
=
S
p
( f )S
∗
V
( f )
S
p
( f )
2
= G( f )e
jφ( f )
,(1)
where S
∗
V
( f ) is the conjugate of S
V
( f ); |S
P
( f )|
2
is the power
spectrum density of BP; G( f )
=|H(f )| is the transfer
function amplitude (gain); and φ( f ) is the transfer function
phase at a specific frequency f . The amplitude and the phase
of the transfer function reflect the linear amplitude and time
relationship between the two signals. The reliability of these
linear relationships can be evaluated by C( f ), coherence that
rangesfrom0to1:
C( f )
=
S
P
( f )S
∗
V
( f )
2
S
P
( f )
2
S
V
( f )
2
. (2)
A coherence value close to 0 indicates the lack of linear
relationship between BP and BFV signals and, therefore,
the linear relationship between BP and BFV estimated by
the transfer function is not reliable. The absence of linear
relationship between BP and BFV is usually assumed to
reflect the nonlinear influence of CA.
Average coherence, gain, and phase are calculated in the
frequency range below 0.07 Hz in which the CA is assumed
to be most effective [35, 39]. For comparison with the MMPF
results, the same transfer function analysis is also performed
in the same frequency range as the observed dominant
spontaneous oscillations in BP and BFV.
3. MULTIMODAL PRESSURE-FLOW METHOD
The main concept of the MMPF method is to quantify
nonlinear BP-BFV relationship by concentrating on intrinsic
components of BP and BFV signals that have simplified
temporal structures but still can reflect nonlinear inter-
actions between two physiologic variables. The MMPF
method includes four major steps: (1) decomposition of each
signal (BP and BFV) into multiple empirical modes, (2)
selection of empirical modes for (dominant) oscillations in
BP and corresponding oscillations in BFV (3) calculation of
instantaneous phases of extracted BP and BFV oscillations,
and (4) calculation of biomarker(s) of CA based on BP-BFV
phase relationship.
The improved MMPF method provides a more reliable
estimation of BP-BFV phase relationship by implementing
a noise assisted EMD, called ensemble EMD (EEMD) [59],
to extract oscillations embedded in nonstationary BP and
BFV signals. The EEMD technique can ensure that each
component does not consist of oscillations at dramatically
disparate scales, and that different components are locally
nonoverlapping in the frequency domain. Thus, each com-
ponent obtained from the EEMD may better represent
fluctuations corresponding to a specific physiologic process.
To demonstrate such an advantage of the EEMD, we will
apply the method to extract dominant spontaneous BP-BFV
oscillations during baseline resting conditions and compare
the results to those obtained from the traditional EMD
method.
3.1. Empirical mode decomposition
To achieve the first major step of MMPF, we originally
utilized the empirical mode decomposition (EMD) algo-
rithm, developed by Huang et al. [21] to decompose the
nonstationary BP and BFV signals into multiple empirical
modes, called intrinsic mode functions (IMFs). Each IMF
represents a frequency-amplitude modulation in a narrow
band that can be related to a specific physiologic process [21].
For a time series x(t) with at least 2 extremes, the EMD
uses a sifting procedure to extract IMFs one by one from the
smallest scale to the largest scale:
x(t)
= c
1
(t)+r
1
(t)
= c
1
(t)+c
2
(t)+r
2
(t)
.
.
.
= c
1
(t)+c
2
(t)+···+ c
n
(t),
(3)
where c
k
(t) is the kth IMF component, and r
k
(t) is the resid-
ual after extracting the first k IMF components
{i.e., r
k
(t) =
x(t) −
k
i
=1
c
i
(t)}. Briefly, the extraction of the kth IMF
includes the following steps.
(i) Initialize h
0
(t) = h
i−1
(t) = r
k−1
(t)(ifk = 1, h
0
(t) =
x(t)), where i = 1.
(ii) Extract local minima/maxima of h
i−1
(t) (if the total
number of minima and maxima is less than 2, c
k
(t) =
h
i−1
(t) and stop the whole EMD process).
(iii) Obtain upper envelope (from maxima) and lower
envelope (from minima) functions p(t)andv(t)by
interpolating local minima and maxima of h
i−1
(t),
respectively.
(iv) Calculate h
i
(t) = h
i−1
(t) −(p(t)+v(t))/2.
(v) Calculate the standard deviation (SD) of (p(t)+
v(t))/2.
(vi) If SD is small enough (less than a chosen threshold
SD max, typically between 0.2 and 0.3) [21], the kth
IMF component is assigned as c
k
(t) = h
i
(t)and
r
k
(t) = r
k−1
(t) − c
k
(t); otherwise repeat steps (ii) to
(v) for i +1untilSD< SD max.
Theaboveprocedureisrepeatedtoobtaindifferent IMFs
at different scales until there are less than 2 minima or
maxima in a residual r
k−1
(t) which will be assigned as the
last IMF (see the step (ii) above).
4 EURASIP Journal on Advances in Signal Processing
EMD
0 50 100 150 200 250 300
0 50 100 150 200 250 300
0 50 100 150 200 250 300
0 50 100 150 200 250 300
0 50 100 150 200 250 300
0 50 100 150 200 250 300
−10
0
10
−10
−5
0
5
−5
0
5
−5
0
5
−5
0
5
−5
0
5
0
0.5
1
0
0.5
1
0
0.5
1
0
0.5
1
0
0.5
1
0
0.5
1
50 100 150 200 250
50 100 150 200 250
50 100 150 200 250
50 100 150 200 250
50 100 150 200 250
50 100 150 200 250
20
40
60
20
40
60
20
40
60
20
40
60
20
40
60
20
40
60
Thespectrogramoftheoscillation
entrained by respiration
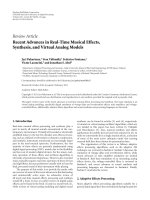
Figure 1: (Left panel) A raw BP signal and its decomposed empirical modes (i.e., c
5
–c
9
components from bottom to top) obtained by
the EMD method. (Right panel) The corresponding short-time Fourier transform (STFT) spectrograms of the signals in left panel. The
spectrogram was obtained using Gaussian sliding window with time duration of 40 seconds, shifted 2 seconds between successive evaluations
and then plotted using color map.
3.2. Ensemble empirical mode decomposition (EEMD)
For signals with intermittent oscillations, one essential prob-
lem of the EMD algorithm is that an intrinsic mode could
comprise of oscillations with very different wavelengths
at different temporal locations (i.e., mode mixing). The
problem can cause certain complications for our analysis,
making the results less reliable. To overcome the mode
mixing problem, a noise assisted EMD algorithm, namely,
the ensemble empirical mode decomposition (EEMD), has
been proposed [59]. The EEMD algorithm first generates
an ensemble of data sets obtained by adding different
realizations of white noise to the original data. Then, the
EMD analysis is applied to these new data sets. Finally,
the ensemble average of the corresponding intrinsic mode
functions from different decompositions is calculated as the
final result. Shortly, for a time series x(t), the EEMD includes
the following steps.
(i) Generate a new signal y(t) by superposing to x(t)
a randomly generated white noise with amplitude
equal to certain ratio of the standard deviation of x(t)
(applying noise with larger amplitude requires more
realizations of decompositions).
(ii) Perform the EMD on y(t) to obtain intrinsic mode
functions.
(iii) Iterate steps (i)-(ii) m times with different white
noise to obtain an ensemble of intrinsic mode
function (IMFs)
{c
1
k
(t), k = 1, 2, , n}, {c
2
k
(t), k =
1, 2, , n}, , {c
m
k
(t), k = 1, 2, , n}.
(iv) Calculate the average of intrinsic mode func-
tions
{c
k
(t), k = 1, 2, , n},wherec
k
(t) =
(1/m)
m
i
=1
c
i
k
(t).
The last two steps are applied to reduce noise level and
to ensure that the obtained IMFs reflect the true oscillations
in the original time series x(t). In this study, we repeat
decomposition m times (m
≥ 200) to make sure that the
noise is reduced to negligible level.
To illustrate the mode mixing problem, we applied both
EMD and EEMD to BP signal of a healthy subject. Figure 1
shows the results of the EMD. The left-side panels of Figure 1
show the original BP signal (the top plot) and the decom-
posed IMFs (modes 9–5 from the second to the bottom
plots). For each plotted signal on the left side of Figure 1,
the corresponding short-time Fourier transform (STFT)
spectrogram was obtained by applying Fourier transform
in overlapped Gaussian sliding windows (the window size
is 40 seconds and 2 seconds shift between two successive
windows) and was plotted using color mapping on the right
side of Figure 1. As shown in the rectangle area of the STFT
spectrograms of raw BP signals (marked using white line, the
Men-Tzung Lo et al. 5
EEMD
0 50 100 150 200 250 300
0 50 100 150 200 250 300
0 50 100 150 200 250 300
0 50 100 150 200 250 300
0 50 100 150 200 250 300
0 50 100 150 200 250 300
−5
0
5
−10
0
10
−5
0
5
−5
0
5
−5
0
5
−5
0
5
0
0.5
1
0
0.5
1
0
0.5
1
0
0.5
1
0
0.5
1
0
0.5
1
50 100 150 200 250
50 100 150 200 250
50 100 150 200 250
50 100 150 200 250
50 100 150 200 250
50 100 150 200 250
20
40
60
20
40
60
20
40
60
20
40
60
20
40
60
20
40
60
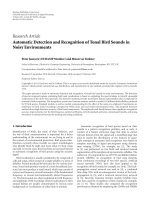
Figure 2: (Left panel) The same BP signal as shown in Figure 1 and its decomposed empirical modes (i.e., c
5
–c
9
components from bottom to
top) obtained by the EEMD method. (Right panel) The corresponding short-time Fourier transform (STFT) spectrograms of the signals in
left panel. The spectrograms were calculated and plotted using the same procedure discussed in Figure 1. The noise ratio for EEMD method
is 0.2.
top panel of the right side in Figure 1), the instantaneous
frequency of spontaneous oscillation entrained by the res-
piration is time dependent over the range of 0.18
∼0.3 Hz.
Both mode 5 and mode 6 IMFs from the EMD contain
parts of respiration induced oscillations in BP at different
time, that is, no single IMF mode can reflect respiration
influence consistently throughout the entire time series. In
contrast, as shown in Figure 2, the mode 7 IMF from the
EEMD can fully represent the respiratory oscillations in BP,
as indicated by the same STFT spectrogram of the IMF as
the original BP signals in the frequency range of 0.18–0.3 Hz.
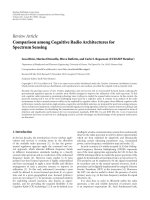
Using the EEMD, we also extracted the respiration induced
oscillations in the simultaneously recorded BFV signal of the
same subject (mode 7 IMF in Figure 3).
As shown in our simulation, EEMD ensures the decom-
positions to compass the range of possible solutions in
the sifting process and to collate the signals of different
scales in the proper IMF naturally. It produces a set of
IMFs, each displaying a time-frequency distribution without
transitional gaps. With the elimination of the mode mixing
problem, the EEMD can better extract intrinsic mode(s)
corresponding to specific physiologic mechanisms.
3.3. Mode selection
The second step of the MMPF is to choose an IMF for the BP
and the corresponding IMF for the BFV signal. The choice
seems rather subjective and any mode within the interested
frequency range can be used. The following criteria are
proposed for this step in order to improve reliability and
robustness of MMPF results. The most important one is
to ensure that the two chosen IMFs are matched, that is,
the extracted fluctuations in BP and BFV correspond to
the same physiologic process. In addition, it is better to
choose BP component that has reproducible patterns to
minimize variability among different trials. For example,
the initial MMPF study used the BP and BFV oscillations
induced by interventions such as VM [13], and recent studies
used the spontaneous BP and BFV oscillations entrained by
respiration [15, 16]. We will discuss these applications of the
MMPF and its performance in Section 4.
3.4. Hilbert transform
The third major step of the MMPF analysis is to obtain
instantaneous phases of the extracted BP and BFV oscil-
lations (i.e., the IMFs correspond to specific physiology
process). Note that the extracted BP and BFV oscillations
are not stationary, that is, their amplitude and frequency
vary over time. Such nonstationary oscillations can be better
characterized by analytical methods that can quantify the
amplitude and phase (or frequency) at any given moment.
Therefore, the MMPF uses Hilbert transform to obtain
instantaneous phases of BP and BFV oscillation. Unlike the
Fourier transform, Hilbert transform does not assume that
signals are composed of superimposed sinusoidal oscillations
6 EURASIP Journal on Advances in Signal Processing
EEMD
0 50 100 150 200 250 300
0 50 100 150 200 250 300
0 50 100 150 200 250 300
0 50 100 150 200 250 300
0 50 100 150 200 250 300
0 50 100 150 200 250 300
−2
0
2
4
−5
5
0
10
−5
0
5
−5
0
5
−5
0
5
−2
0
2
4
0
0.5
1
0
0.5
1
0
0.5
1
0
0.5
1
0
0.5
1
0
0.5
1
50 100 150 200 250
50 100 150 200 250
50 100 150 200 250
50 100 150 200 250
50 100 150 200 250
50 100 150 200 250
20
40
60
20
40
60
20
40
60
20
40
60
20
40
60
20
40
60
Figure 3: (Left panel) A raw BFV signal and its decomposed empirical modes (i.e., c
5
–c
9
components from bottom to top) obtained by
the EEMD method. (Right panel) The corresponding short-time Fourier transform (STFT) spectrograms of the signals in left panel. The
spectrograms were calculated and plotted using the same procedure discussed in Figure 1. The noise ratio for EEMD method is 0.2.
with constant amplitude and frequency. Thus, the instan-
taneous phases obtained from Hilbert transform are more
suitable for the assessment of the nonlinear relationship
between complex oscillations [60].
In order to obtain instantaneous phases with appropriate
physical meaning, Hilbert transform requires that an oscilla-
tory signal should be symmetric with respect to the local zero
mean and the numbers of zero crossings and extreme should
be the same. The intrinsic mode function derived from the
EMD method satisfies this requirement (see Section 3.1). For
a time series s(t), its Hilbert transform is defined as
s(t) =
1
π
P
s
t
t −t
dt
,(4)
where P denotes the Cauchy principal value. Hilbert trans-
form has an apparent physical meaning in Fourier space: for
any positive (negative) frequency f , the Fourier component
of the Hilbert transform
s(t) at this frequency f can
be obtained from the Fourier component of the original
signal s(t) at the same frequency f after a 90
◦
clockwise
(anticlockwise) rotation in the complex plane, for example,
if the original signal is cos(ωt), its Hilbert transform will
become cos(ωt
− 90
◦
) = sin(ωt). For any signal s(t), the
corresponding analytic signal can be constructed using its
Hilbert transform and the original signal:
S(t)
≡ s(t)+is(t) = A(t)e
iϕ(t)
,(5)
where A(t)andϕ(t) are the instantaneous amplitude and
instantaneous phase of s(t), respectively.
In particular, the instantaneous BP and BFV phases
are calculated on a sample by sample basis. The BP-BFV
phase shift for each subject is calculated as the average of
instantaneous differences of BFV and BP phases over the
entire baseline. The instantaneous BP-BFV phase shift is
averaged over a prolonged time period to provide statistically
robust phase estimates.
3.5. MMPF autoregulation indices
The last step of the MMPF is to derive indices of CA from
the instantaneous phases of BP and BFV oscillations. It is
believed that CA leads to fast recovery of BFV in response to
BP fluctuations and, thus, the phases of BFV oscillations are
advanced compared to BP phases. For simplicity of statistical
analysis, originally the phase shift at the minimum and
maximum of these two signals is used as the index of CA
[13]. To provide statistically more robust phase estimates, the
BP-BFV phase shift for each subject can be calculated as the
average of instantaneous differences of BFV and BP phases
over the course of the VM or spontaneous oscillations [16].
4. COMPUTER-ASSISTED PROGRAM FOR
MMPF ANALYSIS
To implement the steps in Sections 3.3–3.5 in the MMPF
analysis, a software package was developed to load the
decomposed intrinsic modes of BP and BFV signals, to allow
the selections of BP and BFV components, and to calculate
Men-Tzung Lo et al. 7
the MMPF autoregulation index (see Figure 4). In previous
version of the MMPF software, the selection of BP and BFV
components had been done manually, that is, a researcher
will pick an intrinsic mode after visualizing all components
decomposed by the EMD or EEMD. The manual selection
is useful, but it requires fully understanding the MMPF
algorithm and all technical details of the program execution.
Moreover, the manual selection needs human inputs and it
is time consuming. Therefore, the best solution would be to
enable a program-based automatic selection according to the
defined criteria for mode selection, described in Section 3.3.
As a first step to achieve this goal, we have designed
a computer-assisted program to select the respiratory-
modulated oscillation from the decomposed IMF modes.
In this program, the STFT spectrogram analysis, a well-
known method of time frequency analysis, is performed
for all decomposed modes (right panel of Figures 2 and
3). For each mode, the instantaneous mean frequency
for each sliding window is obtained. The IMF with the
mean frequency oscillating mostly in a selected frequency
range (e.g., 0.1
∼0.4 Hz for spontaneous oscillations during
baseline conditions) is automatically picked as the default
mode to be used for the assessment of autoregulation.
With the illustrated spectrograms, the default mode can
also be manually verified or modified to ensure that the
automated selection is appropriate. The same procedure is
used to obtain both spontaneous oscillations in BP and the
corresponding oscillations in BFV. Finally, the instantaneous
BP and BFV phases are calculated using Hilbert transform on
a sample by sample basis. The instantaneous BP-BFV phase
shift for each subject is averaged over 5 minutes and is used
as an index of the dynamic CA.
5. PERFORMANCE OF IMPROVED MMPF
5.1. Assessment of autoregulation in healthy
control, hypertensive, and stroke subjects
during resting condition
To test whether the MMPF can evaluate the dynamics of
CA from spontaneous BP-BFV fluctuations during supine
rest, our recent study compared the BP-BFV phase shifts
obtained from BP and BFV oscillations introduced by the
VM and from spontaneous BP-BFV oscillations during
supine baseline [15]. Data of 12 control, 10 hypertensive,
and 10 stroke subjects during VM and baseline resting
condition were analyzed using the improved MMPF method.
Spontaneous oscillations (period: mean
± SD, 15.7 ± 9.2
seconds) in the same frequency range as the VM oscillations
(17.7
± 7.9 seconds, pair t-test P = .37) were chosen. BP-
BFV phase shifts during spontaneous oscillations (ranging
from
∼−60 to 120 degrees) were highly correlated to those
obtained from VM oscillations (left side middle cerebral
arteries R
= 0.92, P<.0001; right side R = 0.80, P<
.0001) (see Figure 5). Consistently, the paired- t test showed
that the average BP-BFV phase shifts during baseline were
statistically the same as the values during the VM (P>.47).
These results indicate that the MMPF method can enable
reliable assessment of CA dynamics and its impairment
under pathologic conditions using spontaneous BP-BFV
fluctuations.
5.2. Measurement of cerebral autoregulation
dynamics based on spontaneous oscillations
entrained by respirations in diabetic subjects
In our recent study [16], the MMPF method was applied
to study the relationship between spontaneous BP-BFV
oscillations at the respiratory frequency (
∼0.1–0.4 Hz) in
healthy (control) and diabetic subjects. The results showed
that in healthy subjects, there were also specific phase
shifts between spontaneous BP and BFV oscillations over
this frequency range (0.1–0.4 Hz) and that the phase shifts
were significantly reduced in patients with type 2 diabetes,
indicating altered dynamics of BP-BFV relationship, and
thus impairment of vasoregulation in diabetic subjects (see
Figure 6). In contrast, the transfer function analysis was
unable to show any significant group differences of phase
shifts between BP and BFV signals at the frequency <0.07 Hz
in which CA is traditionally studied as well as over the
frequency range of 0.1–0.4 Hz (see Ta ble 1). The sensitivity
and specificity of the MMPF and transfer function measures
were compared using receiver operating characteristic (ROC)
analysis [61] by comparing the areas under the ROC curves
(AUC) between the control and diabetes groups. The ROC
analysis showed that the AUC of MMFP-based phase shifts
(left: 0.94
± 0.04; right: 0.87 ± 0.06) are larger than those
obtained by applying transfer function analysis (left: 0.56
±
0.09, P<.001; right: 0.56 ± 0.09, P = .003) (see Figure 7),
indicating that the BP-BFV phase shifts may serve as a more
sensitive biomarker for the diabetes mellitus (DM) group
than the traditional transfer function phase.
6. DISCUSSION & CONCLUSION
6.1. Assessment of nonlinear interactions between
nonstationary signals
Quantification of nonlinear interactions between two non-
stationary signals presents a computational challenge in dif-
ferent research fields, especially for assessments of physiolog-
ical systems. The computational approaches, based on tradi-
tional theories and methods, cannot resolve nonstationarity-
related issues and be used reliably to study these systems.
One possible and promising approach is to utilize and adopt
concepts and methods derived from nonlinear dynamics
that are designed to explore nonlinear interactions in
nonstationary systems. In the last two decades, nonlinear
dynamic approaches have been applied in many different
biological fields such as cardiovascular system, respiration,
locomotor activity, and neuronal activity in brain [11, 14, 62,
63]. It has been gradually accepted that nonlinear dynamic
methods can provide new information about the control
mechanisms of physiological systems that may be difficult
to be characterized using traditional approaches. In this
review, we aim to demonstrate the point by discussing
recent advance in the field of cerebral blood flow regulation
and the contribution of a nonlinear dynamic approach as
8 EURASIP Journal on Advances in Signal Processing
20 40 60 80 100 120
Time (s)
−4
−2
0
2
4
0
50
100
150
20
40
60
80
100
0
20
40
60
80
100
BP MCAR MCAL
−100 −50 0 50 100 150 200 250 300
BP phase
−100
−50
0
50
100
150
200
250
300
350
400
450
MCAL
MCAR
MCA phase
Subject: VAUA289.xl0
7
7
7
11.8356
21.3537
179.9919
18.38
229.8668
18.38
240.6777
18.38
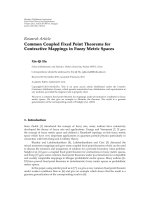
Figure 4: Screen copy of the MMPF analysis software (adapted from [15]). The data shown in this plot are from a healthy subject. The top
three panels on the left show BFV (left side and right side) and BP signals, respectively. The colored curves in these panels show the results
after removing faster fluctuations from the original signals. The bottom left panel shows the corresponding intrinsic modes for these three
signals (red: BP; blue: BFV on right side; green: BFV on left side). The vertical red dashed box (around 40–50 seconds) identifies part of
the VM period. The spontaneous oscillations in these signals during resting conditions prior to the VM can also be visualized. One of these
oscillations (around 14–22 seconds) is identified by two vertical red lines. The result of the BP-BFV phase shift analysis of this period is
plotted in the right panel. A reference line (dotted black line), indicating synchronization between BP and BFV, is shown in this panel for
easy comparison. The result is representative of normal autoregulation where BFV leads BP (by about 50 degrees in phase).
represented by the multimodal pressure flow method (as
discussed in the following sections). Though the MMPF
method has been mainly applied to assess the cerebral
autoregulation, the concept of this approach is generally
applicable for other physiological controls that involve
interactions between two nonstationary signals. Designing
and improving these approaches are crucial to tackle the
generic problem related to nonstationarity.
6.2. Assessment of autoregulation from spontaneous
BP and BFV oscillations
Autoregulatory responses are assessed by challenging cere-
brovascular systems using interventions such as the VM,
thigh cuff deflation, and the head-up tilt [26–31, 64].
However, these intervention procedures may introduce large
intracranial pressure fluctuations and require patients’ active
cooperation. Therefore, they are not generally applicable in
acute care clinical settings. In recent studies, an improved
MMPF method was introduced to quantify the BP-BFV
relationship in healthy, hypertensive, and stroke subjects
during supine resting conditions [15]. The results support
the notion that autoregulation is a dynamic process and
is always engaged even during resting conditions. Dynamic
autoregulationisneededforcontinuousadjustmentof
cerebral perfusion in response to variations of autonomic
cardiovascular and respiratory control (e.g., respiration,
heart rate, blood pressure, vascular tone). Furthermore,
applying the method to healthy and diabetic subjects, we
showed that cerebral vasoregulatory processes that control
pressure-flow relationship can operate at shorter time-scales
(<10 seconds) than previously suggested (see Figure 6).
In this review, we also introduced new results that
present a significant improvement of MMPF method by
introducing an automated mode selection algorithm that
is based on time-frequency analysis. This approach allows
Men-Tzung Lo et al. 9
0 60 120
Baseline BP-BFV phase shift (degrees)
0
60
120
VM BP-BFV phase shift (degrees)
R = 0.92
P<.0001
Control
HTN
Stroke
(a)
0
60
120
P
= .01
P
= .003
Control HTN Stroke
(c)
0 60 120
Baseline BP-BFV phase shift (degrees)
0
60
120
VM BP-BFV phase shift (degrees)
R = 0.8
P<.0001
Control
HTN
Stroke
(b)
0
60
120
P
= .02
P
= .003
Control HTN Stroke
(d)
Figure 5: Comparison of the BP-BFV phase shift during two different conditions and between control, hypertensive (HTN), and stroke
groups. (a)-(b) (adapted from [15]). For each subject in this study, BP-BFV phase shifts for left (a) and right (b) side middle cerebral arteries
(MCAs) were measured during the Valsalva maneuver (VM) and during supine baseline conditions. The straight line is the linear regression
fit of the data. The phase shifts during VM and baseline showed a strong correlation (left R
= 0.92, P<.0001; right R = 0.8, P<.0001).
(c)-(d). BP-BFV phase shifts during VM were smaller in hypertensive and stroke groups than in control group in both left and right MCAs
(HTN: left P
= .01, right P = .02; Stroke: left P = .003, right P = .003).
objective mode selection based on time-frequency measures.
Thus, the MMPF software is now more user-friendly and
does not require computational knowledge to implement the
MMPF technique for clinical evaluations.
Unlike traditional Fourier transform based approaches,
the MMPF method does not assume the BP and BFV
as superimposed sinusoidal oscillations of constant ampli-
tude and period at a preset frequency range. Instead, the
method adopts a new adaptive signal processing algorithm,
EEMD, to extract dominant spontaneous oscillations that
are actually embedded in the BP and BFV fluctuations.
Since spontaneous oscillations that are related to a specific
physiology process are usually nonstationary (i.e., statistical
properties such as mean levels and oscillation period vary
over time and change for different subjects), the conventional
filters that are based on Fourier or wavelet theories are not
reliable or valid for the extraction of embedded spontaneous
oscillation from the BP and BFV signals. In this paper,
we demonstrated that the EEMD can accurately extract
oscillations associated with respirations from nonstationary
BP and BFV signals. This result indicates that the EEMD can
serve as a blind time-variant filter to extract the embedded
nonstationary oscillations adaptively. Studying spontaneous
BP and BFV oscillations extracted by the EEMD method
revealed advanced phases in BFV compared to those in
BP, that is, flow oscillations preceded systemic pressure
oscillations. These BP-BFV phase shifts were similar to
those observed during the VM at the BP minimum and
maximum [13]. Such positive phase shift has also been
reported using Fourier transform methods during head-up
tilt and is interpreted as the faster recovery of BFV caused
by the compensation of cerebral vasoregulation [30]. In our
10 EURASIP Journal on Advances in Signal Processing
Control
0 60 120
Time (seconds)
0
40
80
BFV-BP phase shift
(degrees)
Left
Right
−3
0
3
6
Components
30
60
BFVR
(cm/s)
30
60
BFVL
(cm/s)
70
140
BP
(mm Hg)
BP
BFVL
BFVR
0 60 120
Time (seconds)
(a)
DM
0 60 120
Time (seconds)
−40
0
40
80
BFV-BP phase shift
(degrees)
Left
Right
−5
0
5
Components
70
140
BFVR
(cm/s)
70
140
BFVL
(cm/s)
70
140
BP
(mm Hg)
0 60 120
Time (seconds)
BP
BFVL
BFVR
(b)
Left Right
Subject
0
20
40
60
80
BP-BFV phase shift
(degrees)
P<.0001 P<.0001
Control
DM
(c)
Figure 6: Spontaneous oscillations of blood pressure (BP) and cerebral blood flow velocity (BFV) in (a) a 72-year-old healthy control woman
and (b) a 52-year-old man with type 2 diabetes during supine baseline. Figure 6(a) was adapted from [16]. BP, left and right BFVs (panels 1 to
3 in (a) and (b)) were decomposed into different modes using ensemble empirical mode decomposition algorithm, each mode corresponding
to fluctuations at different time scale. The components corresponding to respirations at frequency ranging from
∼0.1 to 0.4 Hz (the forth
panels in (a) and (b)) were extracted and used for the assessment of BP-BFV relationship. Instantaneous phases of BP and BFV oscillations
(solid lines in the bottom panels of (a) and (b)) were obtained using the Hilbert transform. There were large time/phase delays in BP
oscillations compared to the BFV oscillations. For each subject, the average BFV-BP phase shift (horizontal dashed lines in bottom panels
of (a) and (b)) was obtained as the average of instantaneous BFV-BPV phase shifts during the entire 5-min supine baseline. (c) Phase shifts
between spontaneous oscillations of BP and BFV were much smaller in diabetes group than in healthy control group (P<.0001). The group
averages of control and diabetes are shown in blue symbols with error bars as the standard deviations. There was no significant difference in
phase shifts between left and right blood flow velocities in both control and diabetes groups.
Men-Tzung Lo et al. 11
Table 1: Transfer function results. Adapted from [16]. P values indicate between group comparisons.
Group
0.01–0.07 Hz 0.1–0.4 Hz
Control Diabetes P Control Diabetes P
(n
= 20) (n = 20) (n = 20) (n = 20)
Coherence (left) 0.47 ±0.12 0.54 ±0.15 .12 0.71 ±0.13 0.60 ±0.18 .05
Coherence (right) 0.45
±0.11 0.50 ±0.17 .25 0.70 ± 0.12 0.58 ± 0.17 .02
Gain (left) 0.67
±0.42 0.67 ±0.42 .98 1.07 ± 0.27 0.68 ± 0.34 .0003
Gain (right) 0.65
±0.43 0.59 ±0.36 .64 1.01 ± 0.33 0.63 ± 0.34 .0006
Phase (left) 36.9
±32.144.3 ±32.5 .49 20.6 ±8.819.5 ±10.4.73
Phase (right) 44.6
±29.938.5 ±39.4 .57 21.3 ± 11.822.2 ± 9.6.79
study, we showed that BP-BFV phase shifts of spontaneous
oscillation for hypertensive stroke subjects were significantly
reduced when compared to healthy subjects as shown by
previous studies during the VM [13]. Therefore, the BP-BFV
phase shifts derived from the spontaneous oscillations can
also be used as the indicator of dynamic CA.
6.3. Frequency dependence of cerebral autoregulation
It has been proposed that autoregulatory mechanisms act as
a high-pass filter—cybernetic model [35, 37], being more
active at lower frequencies (< 0.1 Hz) and less effective for
faster spontaneous fluctuations and at respiration frequency.
Though there is no established physiologic neural pathway
that can account for the high-pass filter mechanism, the
frequency dependent influence of CA has been supported by
many studies that are based on the transfer function analysis
[39, 40, 42, 65]. It is important to note that coherence, gain,
and phase of transfer function are continuous functions of
frequency and do not exhibit an apparent transition point
at a specific frequency. Thus, the frequency-dependent influ-
ence of CA, as suggested by the model and transfer function
results, does not indicate a cutoff frequency beyond which
CA has no influence on blood flow regulation. Nevertheless,
many studies used
∼0.1 Hz as an upper frequency boundary
for the transfer function analysis; such choice of frequency
range for the estimation of CA seems rather arbitrary. Since
previous studies showed that blood flow level after induced
sudden blood reduction can be restored within 3–6 seconds
(corresponding to 0.16–0.33 Hz in frequency domain) [66,
67], there is no reason to refute that CA can modulate the
relationship of BP and BFV at frequencies faster than 0.1 Hz.
Indeed, there were already studies indicating that BP and
BFV oscillations at frequencies faster than 0.1 Hz may also
provide useful information on CA [14, 68].
Moreover, the transfer function analysis is based on
Fourier transform that implicitly assumes stationary signals
composed of sinusoidal oscillations of constant amplitude
and period. However, real-world recordings, such as BP and
BFV signals, are usually nonstationary and exhibit dynamic
changes over time (e.g., shifts of respiratory frequencies,
occurrence of spontaneous waves, etc.). Therefore, a single
transfer function may not be sensitive enough to identify the
influences of CA on relationship between the BP and BFV
oscillations at all time scales.
It is intriguing that the MMPF analysis revealed a specific
phase shift between BP and BFV oscillation in the frequency
range of
∼0.1–0.4 Hz in control subjects, and this phase
shift was significantly reduced in diabetic subjects. These
findings strongly support that CA is a continuous dynamic
process, influencing BP-BFV relationship over a frequency
range (>0.1 Hz) that is beyond previously ranges recognized.
However, transfer function analysis could not identify this
alteration in BP-BFV phase relationship in diabetic subjects
in this frequency range, suggesting that inherent nonlinear-
ities of CA may be better described by nonlinear methods
such as the MMPF and multivariate coherence—an approach
that takes into account contributions of other inputs, for
example, pressure and cerebrovascular resistances [46].
6.4. Comparison of the MMPF method and traditional
CA approaches
The observation that transfer function analysis (TFA) can-
not, but the MMPF can, show difference in phase relation
between systemic BP and BFV in type 2 diabetes, may lead
to following explanations: (1) TFA quantifies pressure and
flow relationship in a specific frequency range, while MMPF
is not frequency dependent. Therefore, these two methods
may quantify different aspects of underlying mechanisms
responsible for blood flow regulation. (2) Sensitivities of
these two methods are different so that their performances
in a small sample size of subjects can be different. As shown
by previous studies, both TFA and MMPF can identify
alterations in blood flow regulation in pathologic conditions
such as stroke, hypertension, and traumatic brain injuries
that are associated with impaired autoregulation. These
findings indicate that both methods can quantify CA using
BP and cerebral BFV but do not explain different results
in diabetic patients. The second possibility comes from
the fact that TFA usually focuses on the frequencies below
0.1 Hz while MMPF does not assume frequency range, that
is, MMPF extracted dominant oscillations that are truly
embedded in data. Thus, the optimal frequency range to
distinguish the difference between controls and diabetics in
blood pressure and blood flow relationship is not known. In
this study, we found that there were no group differences
12 EURASIP Journal on Advances in Signal Processing
00.51
1-specificity
0
0.5
1
Sensitivity
Left
MMPF
Tr an s fe r f un c ti on
(a)
00.51
1-specificity
0
0.5
1
Sensitivity
Right
MMPF
Tr an s fe r f un c ti on
(b)
Figure 7: Receiver operating characteristic (ROC) curves for the DM prediction using BP-BFV phase shifts obtained from the MMPF
method and using transfer function phases (0.1–0.4 Hz) (adapted from [16]). The y-axis is the sensitivity, representing the percentage of
DM subjects identified; and the x-axis is 1-specificity; that is, the percentage of control subjects that are incorrectly identified as DM subjects.
The areas under the ROC curves (AUC) closer to 1.0 for BP-BFV phase shifts indicates that the MMPF measure serve as a better discriminator
between the control and DM groups than traditional transfer function analysis.
in TFA results in the frequency range 0.01–0.07 Hz (in
which CA was traditionally believed to affect pressure and
flow relationship). The frequency of dominant oscillations
in blood pressure and flow extracted by MMPF was from
0.1 to 0.4 Hz. However, BP-BFV phase obtained from TFA
for the frequency range 0.1–0.4 Hz showed no difference
between controls and diabetic subjects, either (see Tabl e 1 ).
This finding refutes the notion that the differences in results
detected by TFA and MMPF are merely due to differences
in frequency range. Therefore, the differences in sensitivity
of both methods offer explanation for discrepancy in the
CA estimates in diabetic patients. Consistently, we found
that the BP-BFV phase shift had a better performance in
discriminating between control subjects and subjects with
type 2 diabetes (see Figure 7). The different results obtained
from the two analyses may not be surprising because
the BP-BFV phase shifts of transfer function analysis are
based on the Fourier transform which is not applicable
to nonstationary BP and BFV signals and nonlinear BP-
BFV relationship. Comparisons of the MMPF and the TFA
performance were done only using data obtained from
patients with type 2 diabetes. It would be desirable to further
establish reliability and repeatability of these methods in
other pathological conditions that are known to impair
cerebral autoregulation.
This review was focused on the MMPF method. There
are other approaches from nonlinear dynamics such as
phase synchronization technique [14], multiple multivariate
coherence [46], and general Volterra-Wiener approaches [44,
45, 47] that have been used to quantify cerebral autoregu-
lation but could not be covered in this short review. More
systematic studies are necessary to evaluate advantages and
disadvantages of these innovative methods during different
physiological and pathological conditions.
In conclusion, CA dynamics can be reliably estimated
from spontaneous BP and BFV fluctuations during baseline
resting conditions, and the BFV-BP phase shift obtained
by the improved MMPF method is a sensitive and reliable
measure of blood flow regulation and can be potentially used
to monitor autoregulation in subjects with cerebromicrovas-
cular diseases.
ABBREVIATIONS
MMPF: Multimodal pressure flow method;
EMD: Empirical mode decomposition;
EEMD: Ensemble empirical mode decomposition;
IMF: Intrinsic mode functions;
BP: Blood pressure;
BFV: Blood flow velocity;
VM: Valsalva maneuver;
TCD: Transcranial Doppler;
CA: Cerebral autoregulation.
ACKNOWLEDGMENTS
This study was supported by an American Diabetes Associa-
tion Grant 1-03-CR-23 to V. Novak, an NIH Older American
Men-Tzung Lo et al. 13
Independence Center Grant AG08812, NIH Program
projects AG004390 and NS045745, NIH-NINDS STTR grant
NS053128 in collaboration with DynaDx, Inc., a CIMIT
New Concept Grant (W81XWH) and a General Clinical
Research Center (GCRC) Grant MO1-RR01302., and James
S. McDonnell Foundation, the Ellison Medical Founda-
tion Senior Scholar in Aging Award, the G. Harold and
Leila Y. Mathers Charitable Foundation, Defense Advanced
Research Projects Agency, and the NIH/National Center
for Research Resources (P41RR013622). M T Lo gratefully
acknowledges support by NCU plan to develop first-class
university and top-level research centers (Grant 965941). The
authors acknowledge Steven Lin, Ary Goldberger for their
helpful comments, and Chris Peng for the assistance of data
processing.
REFERENCES
[1] H. Kantz and T. Schreiber, Nonlinear Time Series Analysis,
Cambridge University Press, Cambridge, UK, 1997.
[2] G. M. Viswanathan, C K. Peng, H. E. Stanley, and A. L.
Goldberger, “Deviations from uniform power law scaling in
nonstationary time series,” Physical Review E, vol. 55, no. 1,
pp. 845–849, 1997.
[3] P. Bernaola-Galv
´
an, P. Ch. Ivanov, L. A. Nunes Amaral, and H.
E. Stanley, “Scale invariance in the nonstationarity of human
heart rate,” Physical Review Letters, vol. 87, no. 16, Article ID
168105, 4 pages, 2001.
[4]J.J.CollinsandI.N.Stewart,“Symmetry-breakingbifur-
cation: a possible mechanism for 2:1 frequency-locking in
animal locomotion,” Journal of Mathematical Biology, vol. 30,
no. 8, pp. 827–838, 1992.
[5] J. J. Collins and C. J. De Luca, “Random walking during quiet
standing,” Physical Review Letters, vol. 73, no. 5, pp. 764–767,
1994.
[6] K. Hu, P. Ch. Ivanov, Z. Chen, M. F. Hilton, H. E. Stanley,
and S. A. Shea, “Non-random fluctuations and multi-scale
dynamics regulation of human activity,” Physica A, vol. 337,
no. 1-2, pp. 307–318, 2004.
[7] C K. Peng, J. Mietus, J. M. Hausdorff, S. Havlin, H. E. Stanley,
and A. L. Goldberger, “Long-range anticorrelations and non-
Gaussian behavior of the heartbeat,” Physical Review Letters,
vol. 70, no. 9, pp. 1343–1346, 1993.
[8] M. Costa, A. L. Goldberger, and C K. Peng, “Multiscale
entropy to distinguish physiologic and synthetic RR time
series,” Computers in Cardiology, vol. 29, pp. 137–140, 2002.
[9] B. Pompe, P. Blidh, D. Hoyer, and M. Eiselt, “Using mutual
information to measure coupling in the cardiorespiratory
system,” IEEE Engineering in Medicine and Biology Magazine,
vol. 17, no. 6, pp. 32–39, 1998.
[10] D. Hoyer, R. Bauer, B. Walter, and U. Zwiener, “Estimation
of nonlinear couplings on the basis of complexity and
predictability—a new method applied to cardiorespiratory
coordination,” IEEE Transactions on Biomedical Engineering,
vol. 45, no. 5, pp. 545–552, 1998.
[11] C. Sch
¨
afer, M. G. Rosenblum, H H. Abel, and J. Kurths,
“Synchronization in the human cardiorespiratory system,”
Physical Review E, vol. 60, no. 1, pp. 857–870, 1999.
[12] K. H. Chon, Y M. Chen, N H. Holstein-Rathlou, and V. Z.
Marmarelis, “Nonlinear system analysis of renal autoregula-
tion in normotensive and hypertensive rats,” IEEE Transactions
on Biomedical Engineering, vol. 45, no. 3, pp. 342–353, 1998.
[13] V. Novak, A. C. C. Yang, L. Lepicovsky, A. L. Goldberger, L. A.
Lipsitz, and C K. Peng, “Multimodal pressure-flow method
to assess dynamics of cerebral autoregulation in stroke and
hypertension,” BioMedical Engineering Online, vol. 3, article
39, 2004.
[14] Z. Chen, K. Hu, H. E. Stanley, V. Novak, and P. Ch.
Ivanov, “Cross-correlation of instantaneous phase increments
in pressure-flow fluctuations: applications to cerebral autoreg-
ulation,” Physical Review E, vol. 73, no. 3, Article ID 031915,
14 pages, 2006.
[15] K. Hu, C K. Peng, M. Czosnyka, P. Zhao, and V. Novak,
“Nonlinear assessment of cerebral autoregulation from spon-
taneous blood pressure and cerebral blood flow fluctuations,”
Cardiovascular Engineering, vol. 8, no. 1, pp. 60–71, 2008.
[16] K. Hu, C K. Peng, N. E. Huang, et al., “Altered phase
interactions between spontaneous blood pressure and flow
fluctuations in type 2 diabetes mellitus: nonlinear assessment
of cerebral autoregulation,” Physica A, vol. 387, no. 10, pp.
2279–2292, 2008.
[17] K. Hu, P. Ch. Ivanov, M. F. Hilton, et al., “Endogenous circa-
dian rhythm in an index of cardiac vulnerability independent
of changes in behavior,” Proceedings of the National Academy
of Sciences of the United States of America, vol. 101, no. 52, pp.
18223–18227, 2004.
[18]K.Hu,F.A.J.L.Scheer,P.Ch.Ivanov,R.M.Buijs,and
S. A. Shea, “The suprachiasmatic nucleus functions beyond
circadian rhythm generation,” Neuroscience, vol. 149, no. 3, pp.
508–517, 2007.
[19] P.Ch.Ivanov,K.Hu,M.F.Hilton,S.A.Shea,andH.E.Stanley,
“Endogenous circadian rhythm in human motor activity
uncoupled from circadian influences on cardiac dynamics,”
Proceedings of the National Academy of Sciences of the United
States of America, vol. 104, no. 52, pp. 20702–20707, 2007.
[20] N. E. Huang, Z. Shen, S. R. Long, et al., “The empirical mode
decomposition and the Hubert spectrum for nonlinear and
non-stationary time series analysis,” Proceedings of the Royal
Society A, vol. 454, no. 1971, pp. 903–995, 1998.
[21] W. Huang, Z. Shen, N. E. Huang, and Y. C. Fung, “Engineering
analysis of biological variables: an example of blood pressure
over 1 day,” Proceedings of the National Academy of Sciences
of the United States of America, vol. 95, no. 9, pp. 4816–4821,
1998.
[22] R. Maestri, G. D. Pinna, A. Accardo, et al., “Nonlinear
indices of heart rate variability in chronic heart failure
patients: redundancy and comparative clinical value,” Journal
of Cardiovascular Electrophysiology, vol. 18, no. 4, pp. 425–433,
2007.
[23] R. Balocchi, D. Menicucci, E. Santarcangelo, et al., “Deriving
the respiratory sinus arrhythmia from the heartbeat time
series using empirical mode decomposition,” Chaos, Solitons
&Fractals, vol. 20, no. 1, pp. 171–177, 2004.
[24] C. M. Sweeney-Reed and S. J. Nasuto, “A novel approach to
the detection of synchronisation in EEG based on empirical
mode decomposition,” Journal of Computational Neuroscience,
vol. 23, no. 1, pp. 79–111, 2007.
[25] R. Aaslid, “Cerebral hemodynamics,” in Transcranial Doppler,
D. W. Newell and R. Aaslid, Eds., pp. 49–55, Raven Press, New
York, NY, USA, 1992.
[26] R. B. Panerai, “Assessment of cerebral pressure autoregulation
in humans—a review of measurement methods,” Physiological
Measurement, vol. 19, no. 3, pp. 305–338, 1998.
[27] V. Novak, J. M. Spies, P. Novak, B. R. McPhee, T. A. Rummans,
and P. A. Low, “Hypocapnia and cerebral hypoperfusion in
14 EURASIP Journal on Advances in Signal Processing
orthostatic intolerance,” Stroke, vol. 29, no. 9, pp. 1876–1881,
1998.
[28] V. Novak, A. Chowdhary, B. Farrar, et al., “Altered cerebral
vasoregulation in hypertension and stroke,” Neurology, vol. 60,
no. 10, pp. 1657–1663, 2003.
[29] S. L. Dawson, R. B. Panerai, and J. F. Potter, “Critical closing
pressure explains cerebral hemodynamics during the Valsalva
maneuver,” Journal of Applied Physiology,vol.86,no.2,pp.
675–680, 1999.
[30] R. B. Panerai, S. L. Dawson, P. J. Eames, and J. F. Potter, “Cere-
bral blood flow velocity response to induced and spontaneous
sudden changes in arterial blood pressure,” American Journal
of Physiology, vol. 280, no. 5, pp. H2162–H2174, 2001.
[31] B. J. Carey, R. B. Panerai, and J. F. Potter, “Effect of aging on
dynamic cerebral autoregulation during head-up tilt,” Stroke,
vol. 34, no. 8, pp. 1871–1875, 2003.
[32] R. Cavestri, L. Radice, F. Ferrarini, et al., “CBF side-to-side
asymmetries in stenosis-occlusion of internal carotid artery.
Relevance of CT findings and collateral supply,” Italian Journal
of Neurological Sciences , vol. 12, no. 5, pp. 383–388, 1991.
[33] G.Russo,R.deFalco,E.Scarano,A.Cigliano,andG.Profeta,
“Non invasive recording of CO
2
cerebrovascular reactivity in
normal subjects and patients with unilateral internal carotid
artery stenosis,” Journal of Neurosurgical Sciences, vol. 38, no.
3, pp. 147–153, 1994.
[34] M. Silvestrini, F. Vernieri, P. Pasqualetti, et al., “Impaired
cerebral vasoreactivity and risk of stroke in patients with
asymptomatic carotid artery stenosis,” Journal of the American
Medical Association, vol. 283, no. 16, pp. 2122–2127, 2000.
[35] R. R. Diehl, D. Linden, D. L
¨
ucke, and P. Berlit, “Phase
relationship between cerebral blood flow velocity and blood
pressure: a clinical test of autoregulation,” Stroke, vol. 26, no.
10, pp. 1801–1804, 1995.
[36] A. A. Birch, M. J. Dirnhuber, R. Hartley-Davies, F. Iannotti,
and G. Neil-Dwyer, “Assessment of autoregulation by means
of periodic changes in blood pressure,” Stroke, vol. 26, no. 5,
pp. 834–837, 1995.
[37] R. R. Diehl, D. Linden, D. L
¨
ucke, and P. Berlit, “Spontaneous
blood pressure oscillations and cerebral autoregulation,” Clin-
ical Autonomic Research, vol. 8, no. 1, pp. 7–12, 1998.
[38] A. P. Blaber, R. L. Bondar, F. Stein, et al., “Transfer function
analysis of cerebral autoregulation dynamics in autonomic
failure patients,” Stroke, vol. 28, no. 9, pp. 1686–1692, 1997.
[39] R. Zhang, J. H. Zuckerman, C. A. Giller, and B. D. Levine,
“Transfer function analysis of dynamic cerebral autoregula-
tion in humans,” American Journal of Physiology, vol. 274, no.
1, pp. H233–H241, 1998.
[40] C. Haubrich, A. Wendt, R. R. Diehl, and C. Kl
¨
otzsch,
“Dynamic autoregulation testing in the posterior cerebral
artery,” Stroke, vol. 35, no. 4, pp. 848–852, 2004.
[41] C. A. Giller, “The frequency-dependent behavior of cerebral
autoregulation,” Neurosurgery, vol. 27, no. 3, pp. 362–368,
1990.
[42] C. A. Giller and D. G. Iacopino, “Use of middle cerebral
velocity and blood pressure for the analysis of cerebral
autoregulation at various frequencies: the coherence index,”
Neurological Research, vol. 19, no. 6, pp. 634–640, 1997.
[43] C. Haubrich, A. Klemm, R. R. Diehl, W. M
¨
oller-Hartmann,
and C. Kl
¨
otzsch, “M-wave analysis and passive tilt in patients
with different degrees of carotid artery disease,” Acta Neuro-
logica Scandinavica, vol. 109, no. 3, pp. 210–216, 2004.
[44] G. D. Mitsis, R. Zhang, B. D. Levine, and V. Z. Marmarelis,
“Modeling of nonlinear physiological systems with fast and
slow dynamics. II. Application to cerebral autoregulation,”
Annals of Biomedical Engineering, vol. 30, no. 4, pp. 555–565,
2002.
[45] G. D. Mitsis, M. J. Poulin, P. A. Robbins, and V. Z. Marmarelis,
“Nonlinear modeling of the dynamic effects of arterial pres-
sure and CO
2
variations on cerebral blood flow in healthy
humans,” IEEE Transactions on Biomedical Engineering, vol.
51, no. 11, pp. 1932–1943, 2004.
[46] R. B. Panerai, P. J. Eames, and J. F. Potter, “Multiple coherence
of cerebral blood flow velocity in humans,” American Journal
of Physiology, vol. 291, no. 1, pp. H251–H259, 2006.
[47] G. D. Mitsis, R. Zhang, B. D. Levine, and V. Z. Marmarelis,
“Cerebral hemodynamics during orthostatic stress assessed by
nonlinear modeling,” Journal of Applied Physiology, vol. 101,
no. 1, pp. 354–366, 2006.
[48] R. R. Diehl, B. Diehl, M. Sitzer, and M. Hennerici, “Sponta-
neous oscillations in cerebral blood flow velocity in normal
humans and in patients with carotid artery disease,” Neuro-
science Letters, vol. 127, no. 1, pp. 5–8, 1991.
[49] J. M. Karemaker, “Analysis of blood pressure and heart rate
variability: theoretical considerations,” in Clinical Autonomic
Disorders: Evaluation and Management,P.A.Low,Ed.,pp.
309–322, Lippincott-Raven, Philadelphia, Pa, USA, 2nd edi-
tion, 1997.
[50] T. B J. Kuo, C M. Chern, W Y. Sheng, W J. Wong, and
H H. Hu, “Frequency domain analysis of cerebral blood
flow velocity and its correlation with arterial blood pressure,”
Journal of Cerebral Blood Flow & Metabolism,vol.18,no.3,pp.
311–318, 1998.
[51] R. I. Kitney, T. Fulton, A. H. McDonald, and D. A. Linkens,
“Transient interactions between blood pressure, respiration
and heart rate in man,” Journal of Biomedical Engineering, vol.
7, no. 3, pp. 217–224, 1985.
[52] V. Novak, P. Novak, J. de Champlain, A. R. Le Blanc, R. Martin,
and R. Nadeau, “Influence of respiration on heart rate and
blood pressure fluctuations,” Journal of Applied Physiology, vol.
74, no. 2, pp. 617–626, 1993.
[53] P. J. Eames, M. J. Blake, S. L. Dawson, R. B. Panerai, and
J. F. Potter, “Dynamic cerebral autoregulation and beat to
beat blood pressure control are impaired in acute ischaemic
stroke,” Journal of Neurology Neurosurgery and Psychiatry, vol.
72, no. 4, pp. 467–472, 2002.
[54] S. L. Dawson, R. B. Panerai, and J. F. Potter, “Serial changes
in static and dynamic cerebral autoregulation after acute
ischaemic stroke,” Cerebrovascular Diseases,vol.16,no.1,pp.
69–75, 2003.
[55] J. Kwan, M. Lunt, and D. Jenkinson, “Assessing dynamic
cerebral autoregulation after stroke using a novel technique
of combining transcranial Doppler ultrasonography and
rhythmic handgrip,” Blood Pressure Monitoring, vol. 9, no. 1,
pp. 3–8, 2004.
[56] D. N. W. Griffith, S. Saimbi, C. Lewis, S. Tolfree, and
D. J. Betteridge, “Abnormal cerebrovascular carbon dioxide
reactivity in people with diabetes,” Diabetic Medicine, vol. 4,
no. 3, pp. 217–220, 1987.
[57] B.
ˇ
Zvan, M. Zaletel, J. P. Oblak, T. Poga
ˇ
cnik, and T. Kiauta,
“The middle cerebral artery flow velocities during head-up
tilt testing in diabetic patients with autonomic nervous system
dysfunction,” Cerebrovascular Diseases, vol. 15, no. 4, pp. 270–
275, 2003.
[58] L. A. Lipsitz, S. Mukai, J. Hamner, M. Gagnon, and V.
L. Babikian, “Dynamic regulation of middle cerebral artery
blood flow velocity in aging and hypertension,” Stroke, vol. 31,
no. 8, pp. 1897–1903, 2000.
Men-Tzung Lo et al. 15
[59] Z. Wu and N. E. Huang, “Ensemble empirical mode decompo-
sition: a noise-assisted data analysis method,” Tech. Rep. 193,
Centre for Ocean-Land-Atmosphere Studies, Calverton, Md,
USA, 2005.
[60] D. Gabor, “Theory of communication,” Journal of the IEE, vol.
93, part 3, no. 26, pp. 429–457, 1946.
[61] M. H. Zweig and G. Campbell, “Receiver-operating character-
istic (ROC) plots: a fundamental evaluation tool in clinical
medicine,” Clinical Chemistry, vol. 39, no. 4, pp. 561–577,
1993.
[62] D. M. Bramble and D. R. Carrier, “Running and breathing in
mammals,” Science, vol. 219, no. 4582, pp. 251–256, 1983.
[63] P. Tass, M. G. Rosenblum, J. Weule, et al., “Detection
of n : m phase locking from noisy data: application to
magnetoencephalography,” Physical Rev i ew Letters, vol. 81, no.
15, pp. 3291–3294, 1998.
[64]F.P.Tiecks,A.M.Lam,R.Aaslid,andD.W.Newell,
“Comparison of static and dynamic cerebral autoregulation
measurements,” Stroke, vol. 26, no. 6, pp. 1014–1019, 1995.
[65] J. W. Hammer, M. A. Cohen, S. Mukai, L. A. Lipsitz, and J. A.
Taylor, “Spectral indices of human cerebral blood flow control:
responses to augmented blood pressure oscillations,” Journal
of Physiology, vol. 559, no. 3, pp. 965–973, 2004.
[66] L. Symon, K. Held, and N. W. Dorsch, “A study of regional
autoregulation in the cerebral circulation to increased perfu-
sion pressure in normocapnia and hypercapnia,” Stroke, vol. 4,
no. 2, pp. 139–147, 1973.
[67] R. Aaslid, K F. Lindegaard, W. Sorteberg, and H. Nornes,
“Cerebral autoregulation dynamics in humans,” Stroke, vol.
20, no. 1, pp. 45–52, 1989.
[68] R. B. Panerai, J. M. Rennie, A. W. R. Kelsall, and D. H. Evans,
“Frequency-domain analysis of cerebral autoregulation from
spontaneous fluctuations in arterial blood pressure,” Medical
& Biological Engineering & Computing, vol. 36, no. 3, pp. 315–
322, 1998.