Báo cáo hóa học: " Research Article Cardiac Arrhythmias Classification Method Based on MUSIC, Morphological Descriptors, and Neural Network" doc
Bạn đang xem bản rút gọn của tài liệu. Xem và tải ngay bản đầy đủ của tài liệu tại đây (908.54 KB, 10 trang )
Hindawi Publishing Corporation
EURASIP Journal on Advances in Signal Processing
Volume 2008, Article ID 935907, 10 pages
doi:10.1155/2008/935907
Research Article
Cardiac Arrhythmias Classification Method Based on MUSIC,
Morphological Descriptors, and Neural Network
Ahmad R. Naghsh-Nilchi and A. Rahim Kadkhodamohammadi
Department of Computer Engineering, University of Isfahan, Isfahan 81746-73441, Iran
Correspondence should be addressed to Ahmad R. Naghsh-Nilchi,
Received 6 June 2008; Revised 27 September 2008; Accepted 12 December 2008
Recommended by Tan Lee
An electrocardiogram (ECG) beat classification scheme based on multiple signal classification (MUSIC) algorithm, morphological
descriptors, and neural networks is proposed for discriminating nine ECG beat types. These are normal, fusion of ventricular and
normal, fusion of paced and normal, left bundle branch block, right bundle branch block, premature ventricular concentration,
atrial premature contraction, paced beat, and ventricular flutter. ECG signal samples from MIT-BIH arrhythmia database are used
to evaluate the scheme. MUSIC algorithm is used to calculate pseudospectrum of ECG signals. The low-frequency samples are
picked to have the most valuable heartbeat information. These samples along with two morphological descriptors, which deliver
the characteristics and features of all parts of the heart, form an input feature vector. This vector is used for the initial training
of a classifier neural network. The neural network is designed to have nine sample outputs which constitute the nine beat types.
Two neural network schemes, namely multilayered perceptron (MLP) neural network and a probabilistic neural network (PNN),
are employed. The experimental results achieved a promising accuracy of 99.03% for classifying the beat types using MLP neural
network. In addition, our scheme recognizes NORMAL class with 100% accuracy and never misclassifies any other classes as
NORMAL.
Copyright © 2008 A. R. Naghsh-Nilchi and A. R. Kadkhodamohammadi. This is an open access article distributed under the
Creative Commons Attribution License, which permits unrestricted use, distribution, and reproduction in any medium, provided
the original work is properly cited.
1. INTRODUCTION
Most physiological activities consist of certain signals that
reflect the activities’ nature and functions. These signals are
of different types, such as biochemical signals in the form
of neuron transition and hormone, physical signals in the
form of pressure and temperature, and electrical signals in
the form of voltage and current. Disease or biological system
defects cause disorders in the function of physiological
procedures as well as their corresponding signals. One could
study the signal behaviors to identify the nature and type of
disorders or diseases.
Heart is one of the most important organs of body and
disorders in its function can cause serious problems for
the patient. Arrhythmias are abnormal heartbeats. In fact,
arrhythmias are heart diseases, caused by heart electrical-
conductive system disorders and heart diseases such as very
slow (bradycardia) or very fast (tachycardia) heart functions
and result in an inefficient pumping.
The heart state is generally reflected in the shape of
ECG waveform and heart rate. They may contain important
pointers to the nature of diseases afflicting the heart.
However, because the signals are nonstationary in nature,
the reflection may occur at random moments in the time-
scale (i.e., the disease symptoms are not present all the
time, but could manifest at certain irregular intervals during
the day). Therefore, for effective diagnostics, ECG pattern
and heart rate variability have to be observed over several
hours, which results in an enormous data volume. The study
of such volume of data is, of course, tedious and time
consuming. In addition, the possibility of the professional
observer errors (or misreading) vital information is also
high. Thus, computer-based analysis and classification of dis-
eases could be proved to be very helpful in heart diagnostics
[1].
Various computer-based methodologies for automatic
diagnosis have been proposed by researchers; however, the
entire process can generally be subdivided into a number of
2 EURASIP Journal on Advances in Signal Processing
separate processing modules such as preprocessing, feature
extraction/selection, and classification [2].
Signal acquisition, artifact removing, averaging, thresh-
olding, and signal enhancement are the main operations in
the course of preprocessing. Conventionally, ECG signal is
measured on static condition since various types of noise
including muscle artifact and electrode moving artifact are
coupled in dynamic environment. To solve this problem,
various noised signals are grouped into six categories
by context estimation. Then neural network and genetic
algorithm are used to effectively reconfigure noise reduction
filter [3]. Digital filters are proposed to remove high- and
low-frequency noises [4].
Another processing module is feature extraction. It is
the determination of a feature or a feature vector from
a pattern vector. The feature vector, which is comprised
of the set of all features used to describe a pattern, is
a reduced-dimensional representation of that pattern. The
module of feature selection is an optional stage, whereby
the feature vector is reduced in size including only what
may be considered as the most relevant features required
for discrimination, from the classification viewpoint. In the
feature extraction stage, numerous different methods can
be used so that several diverse features can be extracted
from the same raw data. To a large extent, each feature
can independently represent the original data, but none of
them is totally perfect for practical applications. Moreover,
there seems to be no simple way to measure relevance of the
features for a pattern classification task. ECG features can be
extracted in time-domain, in frequency-domain, or may be
represented as statistical measures [5]. They can be based on
ECG morphology and RR-intervals [6].
Jekova et al. [7] used 26 morphological descriptors
representing information of the amplitude, area, specific
interval durations, and measurements of the QRS vector in
the vectorcardiographic (VCG) plane. Ceylan and Ozbay [8]
applied principal component analysis and wavelet transform
for feature extraction. Fourier and wavelet analyses are
investigated for feature extraction [9]. Chazal and Reilly [10]
Considered feature sets that include wavelet-based features,
standard cardiology features, and features taken directly
from time-domain samples of ECG beat. Yu and Chou [11]
used independent component analysis to decompose ECG
signals into weighted sum of basic components that are
statistically mutual independent, and then the projections on
these components, together with the RR interval constitute a
feature vector.
The classification module is the final stage in automated
diagnosis. It examines the input feature vector and based
on its algorithmic nature produces a suggestive hypothe-
sis. Fuzzy c-means clustering and multilayered perceptron
are applied in [8]. Tadejko and Rakowski [6] developed
a classifier with SOM and learning vector quantization
algorithms. Yu and Chou [11] employed probabilistic neural
network (PNN) and a back-propagation neural network, as
classifiers. Jekova et al. [7] present a comparative study of
the learning capacity and the classification abilities of four
classification methods—kth nearest neighbor rule, neural
networks, discriminant analysis, and fuzzy logic. Chazal and
Reilly [10] compare the functions of linear, quadratic, and
logistic discriminants as ECG classifiers.
In this paper, we evaluate the ability of multiple sig-
nal classification (MUSIC), morphological descriptor, and
neural networks classifier to discriminate nine types of
electrocardiogram beats. The MUSIC method enables us
to estimate the spectrum of ECG signals with very high
resolution under a low-signal-to-noise ratio (SNR) situation
even if signal has a small data points [12–16].
2. PROPOSED METHOD
First, the signals are preprocessed by filtering and scaling
to remove high frequency noise, enhance signal quality,
and omit equipment and environment effects. Next, MUSIC
algorithm is applied to calculate pseudospectrum of ECG
signals, where the first 28 frequency samples of the pseu-
dospectrum together with the variances of peak times and
values are used as feature set. Finally, two different neural
networks, including a probabilistic neural network and
amultilayeredperceptronneuralnetwork,areemployed
in this study. The experimental results demonstrate the
effectiveness and efficiency of the proposed feature set and
MLP neural network for ECG beat recognition.
2.1. Preprocessing
The objectives of preprocessing stage are the omission of
high-frequency noise and the enhancement of signal quality
to obtain appropriate features. Furthermore, we should
remove equipment and environment influences on recorded
signals. In this stage, patterns are filtered and then scaled.
2.1.1. Filtering
In the MIT/BIH arrhythmia database, the analog outputs
of the playback unit are filtered to limit analog-to-digital
converter saturation and for antialiasing, using a bandpass
filter with a passband from 0.1 to 100 Hz relative to real time
[17]. In this study, because of its simplicity and fidelity, an
integer coefficient digital lowpass filter, proposed by Lo and
Ta ng [ 4], was used to remove noise caused by power line
interference, muscle tremors, and spikes:
L(z) =
1 −2
Z
−6
+Z
−12
1 −2
Z
−1
+Z
−2
. (1)
The 3 dB point is at 20 Hz, and the first side-lobe zero
amplitude is at 60 Hz. Therefore, power line interference at
60 Hz is completely eliminated, and high-frequency muscle
tremor noise is minimized, which is predominately a result
of the bandlimited (antialiased filtered) data in the MIT/BIH
arrhythmia database [18].
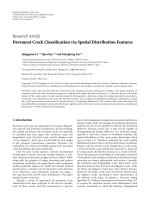
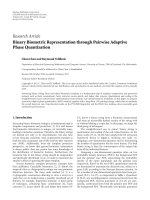
The magnitude and phase characteristics are shown in
Figure 1. One of the advantages of this filter structure is
its linear phase. In Figure 2, the phase plot is shown in its
wrapped form, where the phase is bound between
±π.Inits
unwrapped form, the linear nature of the phase is evident.
A. R. Naghsh-Nilchi and A. R. Kadkhodamohammadi 3
−250
−200
−150
−100
−50
0
Magnitude (dB)
0 20 40 60 80 100 120 140 160 180
Frequency (Hz)
(a)
−4
−3
−2
−1
0
1
2
3
4
Phase (radians)
0 20 40 60 80 100 120 140 160 180
Frequency (Hz)
(b)
Figure 1: Magnitude and phase of lowpass filter.
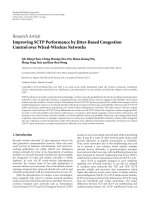
2.1.2. Scaling
In order to reduce amplitude variations, each QRS segment is
scaled to lie between 0 and 1. Figure 2 shows a normal pattern
and its processed form.
2.2. Feature extraction
2.2.1. MUSIC algorithm
Regarding several of the frequency estimation techniques,
signal analysis considers the use of eigenvalues and eigen-
vectors of the correlation matrix for the purposes of
defining signal and noise subspaces. In practice, we estimate
the signal and noise subspaces by using the eigenvectors
and eigenvalues of the sample correlation matrix, as two
orthogonal subspaces. The MUSIC algorithm is a method for
the estimation of pseudospectrum of signal which is based on
covariance attributes and eigenspace. In this method, input
signal is modeled as
x(n)
=
P
p=1
α
p
e
jω
p
n
+ w(n), (2)
where ω
p
is a normalized angular frequency of the compo-
nents, and w is additive white noise. Since we will make use
of matrix methods based on a certain time window of length
M, characterizationofthe signal model in the form of a vector
over this time window would be useful. The time window
includes the sample delays of the signal. It can be written as
x(n)
=
x(n) x(n +1)···x(n + m −1)
T
. (3)
We can then write the signal model consisting of complex
exponentials in noise from (2) for a length-M time-window
vector as
x(n)
=
P
p=1
α
p
v
ω
p
e
jnω
p
+ w(n) = s(n)+w(n), (4)
where w(n)
= [
w(n) w(n +1)···w(n + m −1)
]
T
is the
time-window vector of white noise and
v(ω)
=
1 e
jω
···e
jω(M−1)
T
(5)
is the time-window frequency vector. Consider the time-
window vector model consisting of a sum of complex
exponentials in noise from (4). The autocorrelation matrix
of this model can be written as the sum of signal and noise
autocorrelation matrices:
R
x
= E
x(n)x(n)
H
=
R
s
+ R
w
=
P
p=1
α
p
2
v
ω
p
v
H
ω
p
+ σ
2
w
I
= VAV
H
+ σ
2
w
I,
(6)
where
V
=
v
ω
1
v
ω
2
···v
ω
p
(7)
is an M
×P matrix and
A
=
⎡
⎢
⎢
⎢
⎢
⎣
α
1
2
0 ··· 0
0
α
2
2
··· 0
0
··· ··· 0
0
··· 0
α
p
2
⎤
⎥
⎥
⎥
⎥
⎦
(8)
is a diagonal matrix of the powers of each of the respective
complex exponentials. The autocorrelation matrix can also
be written in terms of its eigen-decomposition:
R
x
=
M
m=1
λ
m
q
m
q
H
m
= QΛQ
H
,(9)
where λ
m
are the eigenvalues in descending order, that is,
λ1
≥ λ2 ≥···≥λM and qm are their corresponding
eigenvectors. Here, Λ is a diagonal matrix made up of the
eigenvalues found in descending order on the diagonal, while
the columns of Q are the corresponding eigenvectors. The
4 EURASIP Journal on Advances in Signal Processing
−0.5
0
0.5
1
Magnitude (mV)
00.10.20.30.40.50.60.70.80.9
Time (s)
(a)
0
0.1
0.2
0.3
0.4
0.5
0.6
0.7
0.8
0.9
1
Magnitude (mV)
00.10.20.30.40.50.60.70.80.9
Time (s)
(b)
Figure 2:(a)AnECGpatternand(b)itsprocessedform.
eigenvalues due to the signals can be written as the sum of
the signal power in the time window and the noise:
λ
m
= M
α
m
2
+ σ
2
m
for m ≤ P. (10)
The remaining eigenvalues are due to the noise only, that is,
λ
m
= σ
2
m
for m ≤ P. (11)
Therefore, the P largest eigenvalues correspond to the
signal made up of complex exponentials and the remaining
eigenvalues have equal value and correspond to the noise.
Thus, we can partition the correlation matrix into portions;
due to the signal and noise eigenvectors,
R
x
= Q
S
ΛQ
H
s
+ σ
2
w
Q
w
Q
H
w
,
Q
s
=
q
1
q
2
···q
3
Q
w
=
q
P+1
···q
M
(12)
are matrices whose columns consist of the signal and noise
eigenvectors, respectively. From (4), x(n) can be split into
two subspaces spanned by the signal and noise eigenvectors,
respectively. Since, the eigenvectors of the Hermitian sym-
metric matrix are orthogonal and the correlation matrix is
the Hermitian symmetric, then these two subspaces, known
as the sig nal subspace and the noise subspace, are orthogonal
to each other. Therefore, with the projection matrix from
an M-dimensional space onto an L-dimensional subspace
(L<M) spanned, we can write the matrices that project an
arbitrary vector onto the signal and noise subspaces as
P
s
= Q
s
Q
H
s
P
w
= Q
w
Q
H
w
, (13)
since the eigenvectors of the correlation matrix are orthonor-
mal. Since the two subspaces are orthogonal
P
w
Q
s
= 0 P
s
Q
w
= 0, (14)
then all the time-window frequency vectors from (4)mustlie
completely in the signal subspace, that is,
P
s
v
ω
p
= v
ω
p
P
w
v
ω
p
= 0. (15)
Because of the orthogonality between the noise and signal
subspaces, all the time-window frequency vectors of the
complex exponentials are orthogonal to the noise subspace
from (15). Thus, for each eigenvector (P<m
≤ M),
v
H
ω
p
q
m
=
M
k=1
q
m
(k)e
−jω
p
(k−1)
= 0 (16)
for all the P frequencies ω
p
of the complex exponentials.
Therefore, if we compute a pseudospectrum for each noise
eigenvector as
R
m
(ω) =
1
v
H
(ω)q
m
2
=
1
Qm(ω)
2
, (17)
where the polynomial Qm(ω)hasM-1 roots, P of which
correspond to the frequencies of the complex exponentials.
These roots produce P peaks in the pseudospectrum from
(17). Note that the pseudospectra of all M-P noise eigenvec-
tors share these roots that are due to the signal subspace. The
remaining roots of the noise eigenvectors, however, occur
at different frequencies. There are no constraints on the
location of these roots, so that some may be close to the
unit circle and produce extra peaks in the pseudospectrum.
A means of reducing the levels of these spurious peaks in the
pseudospectrum is to average the M-P pseudospectra of the
individual noise eigenvectors:
R
MUSIC
(ω) =
1
M
m
=P+1
v
H
(ω)q
m
2
=
1
M
m
=P+1
Qm(ω)
2
,
(18)
which is known as the MUSIC pseudospectrum. The fre-
quency estimates of the P complex exponentials are then
taken as the P peaksinthispseudospectrum.Theterm
pseudospectrum is used because the quantity in (18)does
not contain information about the powers of the complex
exponentials or the background noise level [13]:
R
MUSIC
(ω) =
1
V
H
(ω)Q
w
Q
H
w
V(ω)
, (19)
A. R. Naghsh-Nilchi and A. R. Kadkhodamohammadi 5
where the variable frequency vector or frequency scanning
vector is V(ω)definedin(5). The varied range for angular
frequency ω is [
−π, π].TheproductQ
w
Q
H
w
represents
a projection matrix on the noise subspace [12]. Because
the signal is real, the pseudospectrum is just calculated
for 0-π frequencies, and then, a 129 frequency samples
pseudospectrum is obtained by taking the sample space of
π/128 including zero.
2.2.2. Feature Vector Computation
In the presence of two or more classes, feature extraction will
be a selection of the most effective features for preserving
class separability. Class separability criteria are essentially
independent of coordinate systems, and are completely
different from the criteria for signal representation [19]. In
this study, the filtering and scaling described in Sections
2.1.1 and 2.1.2 are applied to enhance signal quality, and
to unify patterns. Two sets of features are extracted from
the patterns. One set is the spectral features and the other
is the morphological features. To estimate spectral features,
the MUSIC algorithm is used to compute pseudospectrum
of patterns. Because the signal is real, the pseudospectrum is
just calculated for 0-π frequencies, and then a 129 frequency
samples pseudospectrum is obtained.
Since the high-frequency signals were filtered in the
preprocessing module, they are of no value in extraction
of features. Empirically, we come to the conclusion that
using the first 28 frequency samples of the pseudospectrum
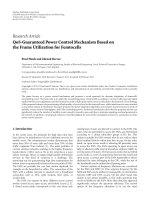
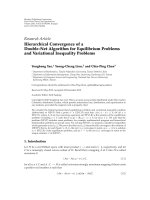
produces the best results. Examples of pseudospectra of
heartbeats in the nine classes are shown in Figure 3.Itisobvi-
ous that the last frequency samples of these pseudospectra are
similar and cannot be efficient features.
The ECG signal reflects the electrical activity of the heart
and the P-QRS-T segment represents one full cardiac cycle
in the time-domain. The magnitude and location of the P,
QRS, and T waves are indicative of the heart functioning.
The arrhythmias are pathological changes in the P-QRS-T
segment, as well as in the heart rate. Therefore, the variances
of the signal peaks values and times are also important
feature for characterizing arrhythmias. The location and
magnitude of the peaks in each heart cycle characterize the
function of the heart.
In order to find the peaks, first, the gradient of a scaled
heart cycle is calculated. The gradient of an ECG signal in
the plane containing the t (time) and m (magnitude) axes
is generally represented by the symbol
∇, and is defined as
the change in the m coordinate divided by the corresponding
change in time. This is shown as follows:
∇x(t) =
x(t + Δt) −x(t)
Δt
, (20)
where the value of t is started from 0 until the end of the
given samples, and Δt is set to be 1.
Second, all the peaks in any single heart cycle which are
related to the P-QRS-T segments are determined by locating
the zeros of the gradient. It is obvious that a heart cycle
may not produce all segment peaks depending on the patient
condition. Now, the variances of the magnitude and time of
those peaks obtained in the given heart cycle are computed.
Thesefeaturesaswellasspectralfeaturesarethenbuiltintoa
feature vector used as the input of the neural networks used
later.
It is essential to perform a normalization process in order
to standardize all the features to the same leve because the
quantity of the features may be quite different. The formula
of the normalization is defined as follows:
x
ij
=
x
ij
−min
max −min
, (21)
where x
ij
is the jth component of the ith feature vector, min
and max are the minimum and maximum, respectively, of
the jth component of the feature vectors. It maps a wide-
ranged signal to a limited range of [0, 1] . In our experiment,
the minimum and the maximum of each component in
the feature vectors are calculated from the training dataset
and are used throughout the experiments. The normalized
feature vectors serve as inputs to the following neural
network classifiers.
2.3. Classification by neural networks
To classify nine different types of arrhythmias, two neural
networks are used. Following, these two are discussed in
detail.
2.3.1. Multilayer perceptrons
An important class of neural networks is multilayer feedfor-
ward networks. Usually, the network is comprised of a set of
sensory units (source nodes) that form the input layer. It also
includes one or more hidden layers of computation nodes
and an output layer of computation nodes. Throughout the
neural network, the input signal propagates in a forward
direction and on a layer-by-layer basis. Since they are meant
to be a generalization of the single-layer perceptron, these
neural networks are referred to as multilayer perceptrons
(MLPs).
Multilayer perceptrons are trained in a supervised man-
ner algorithm with highly popular algorithm known as
error backpropagation algorithm whose basis is on the error-
correction learning rule. As such, it may be conceived of
a generalization of an equally popular adaptive filtering
algorithm.
Error backpropagation learning is a two-pass transmis-
sion through the layers of the networks. The passes are
forward and backward. In the forward pass, following the
application of an activity pattern (input vector) to the
sensory nodes, its effect propagates through the network
layer by layer with the result of production of a set of outputs
as the actual response of the network. During the forward
pass, the synaptic weights of the networks are fixed. However,
during the backward pass, an error-correction rule is used to
adjust the synaptic weights. A major part is the subtraction of
the actual response from a desired (target) response to make
an error signal. By the backward propagation of this error
signal against the direction of synaptic connection, “error-
backpropagation” is done. An Adjustment of the synaptic
6 EURASIP Journal on Advances in Signal Processing
−40
−20
0
20
40
60
80
100
120
140
Power (dB)
00.20.40.60.81
Normalized frequency (
×π rad/sample)
Pseudospectrum estimate via MUSIC
(a) NORMAL
−50
0
50
100
150
200
Power (dB)
00.20.40.60.81
Normalized frequency (
×π rad/sample)
Pseudospectrum estimate via MUSIC
(b) LBBB
−50
0
50
100
150
200
Power (dB)
00.20.40.60.81
Normalized frequency (
×π rad/sample)
Pseudospectrum estimate via MUSIC
(c) RBBB
−50
0
50
100
150
200
Power (dB)
00.20.40.60.81
Normalized frequency (
×π rad/sample)
Pseudospectrum estimate via MUSIC
(d) PVC
−50
0
50
100
150
200
Power (dB)
00.20.40.60.81
Normalized frequency (
×π rad/sample)
Pseudospectrum estimate via MUSIC
(e) FUSION
−50
0
50
100
150
200
Power (dB)
00.20.40.60.81
Normalized frequency (
×π rad/sample)
Pseudospectrum estimate via MUSIC
(f) APC
−50
0
50
100
150
200
Power (dB)
00.20.40.60.81
Normalized frequency (
×π rad/sample)
Pseudospectrum estimate via MUSIC
(g) PACE
−50
0
50
100
150
200
Power (dB)
00.20.40.60.81
Normalized frequency (
×π rad/sample)
Pseudospectrum estimate via MUSIC
(h) FLAW
−50
0
50
100
150
200
Power (dB)
00.20.40.60.81
Normalized frequency (
×π rad/sample)
Pseudospectrum estimate via MUSIC
(i) PFUS
Figure 3: Pseudospectrum of each class which was estimated by MUSIC algorithm.
weights is done to move the actual response of the network
closer to the desired response in a statistical way. The error
backpropagation algorithm is also referred to in the literature
as the backpropagation algorithm, or simply backprop. The
learning process performed with the algorithm is called
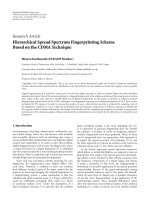
backpropagation learning. Figure 4 depicts a portion of the
multilayer perceptron. Two kinds of signals are identified in
this network [20].
2.3.2. Probabilistic neural network
For classification problems, we use probabilistic neu-
ral networks (PNNs) with straightforward and training-
independent designs. If given enough data, these networks
guarantee coverage to the Bayesian classifier. These networks
have a two-layer structure and generalize well.
The first layer function is to produce a vector possessing
elements indicative of the degree of closeness of a presented
input to a training input. It performs this by computing the
distances from the input vector to the training input vectors.
Then the second layer produces its own net output of a
network of probabilities by summing these contributions for
each class of input. The sensitivity of the radial basis neurons
can be adjusted by varying the value of smoothing factor. In
the study, we empirically determine the value of smoothing
factor as 0.08 that produces satisfactory results. Finally, a
complete transfer function on the output of the second layer
picks the maximum of these probabilities, and produces a 1
A. R. Naghsh-Nilchi and A. R. Kadkhodamohammadi 7
Function signals
Error signals
Figure 4: Illustration of the directions of two basic signal flows in a
multilayer perceptron: forward propagation of function signals and
backpropagation of error signals [20].
for that class and a 0 for the other classes [21]. The number of
neurons in the second layer is the same as that of the desired
classes, that is, nine neurons in the competition layer in our
experiments.
3. EXPERIMENT DESIGN
This study involved 22 ECG records from the MIT-BIH
arrhythmia database. Each MIT/BIH record is 30 minutes in
duration, includes two leads, and is annotated throughout;
by this we mean that each beat (QRS complex) is described
by a label called an annotation [2]. The sampling frequency
is 360 Hz.
The nine beat types employed in the study were normal
beat (NORMAL), left bundle branch block beat (LBBB),
right bundle branch block beat (RBBB), premature ventric-
ular contraction (PVC), fusion of ventricular and normal
beat (FUSION), atrial premature contraction (APC), paced
beat (PACE), ventricular flutter wave (FLWAV), and fusion
of paced and normal beat (PFUS). Testing and training sets
are separately formed by choosing 13950 vectors. For each
class, the numbers of training and testing sets are equal.
Testing and training sets are formed by data obtained from
17 records of MIT-BIH arrhythmia database. The sources of
the ECG beats are shown in Tab le 1. We randomly select the
given number of training and testing heartbeat patterns from
the selected ECG recordings.
In our experiments, we used the multilayer perceptron
(MLP) and the probabilistic neural network (PNN) as the
pattern classifiers. The original dataset was separately divided
into training and testing groups. Two factors that might affect
the efficiency of MLP are the number of hidden layer neurons
and synapses initial weight. Experiments were performed to
test the effects of the initial weight and the number of hidden
layer neurons parameter. One factor that might affect the
efficiency of the PNN is the smoothing factor, which is the
standard deviation of the Gaussian kernel. Experiments were
also performed to test the effect of the smoothing parameter.
The performances of the classification are evaluated
in terms of sensitivity, specificity, and overall accuracy.
Sensitivity and specificity are used to evaluate the ability of
the classification system to discriminate one class against
the other. The sensitivity is calculated as the proportion of
Table 1: The sources and the number of ECG samples used in this
study.
Type
MIT/BIH Training Testing
file number (no./file) (no./file)
NORMAL 100, 103, 106, 202, 209 300 300
LBBB 109, 111, 207 300 300
RBBB 118, 124, 212, 231 300 300
PVC
106, 119 200 200
200, 208 300 300
FUSION 208, 213 150 150
APC
118, 207 40 40
209, 222 100 100
232 300 300
PACE 102, 104, 107, 217 200 200
FLWAV 207 235 235
PFUS
104 330 330
217 130 130
Total 6975 6975
positive samples correctly assigned to the positive class. The
specificity is the proportion of negative samples correctly
assigned to the negative class. The overall accuracy is the
fraction of the total number of beats correctly classified.
4. EXPERIMENTAL RESULTS
The classification results using MLP and PNN are sum-
marized in Ta bl e 2. The diagonal elements in the table are
the number of correctly classified beats of specific ECG
types using the proposed method. In Ta bl e 2, MLP neural
network generally provides adequate recognition throughout
all categories. In each classifier, the lower recognition was
resulted for PFUS arrhythmia type, which means that the
proposed feature vector has a lower discrimination for them.
The system always recognizes NORMAL class correctly and
never misclassifies any other classes as NORMAL. In other
words, the specificity and sensitivity are 100% for NORMAL
class. The results of MLP classifier are more uniform than
PNN classifier. The varied range for MLP is [90.94–100] and
for PNN is [79.02–100] . It is obvious that MLP classifier has
a higher recognition than PNN classifier for the proposed
feature vectors.
Ta bl e 3 shows the average and standard deviations of
sensitivity, specificity, and overall accuracy of the extracted
feature set with MLP and PNN classifiers. For the values in
Ta bl e 3, we choose the average of the results from 20 trials.
The results are computed when the number of MLP hidden
layer neurons is 90 and the smoothing factor for PNN is
0.11. Average of specificity is above 99.57% for MLP classifier
and above 99.11% for PNN classifier. The average of overall
accuracy is 99.03% and 97.75% for MLP and PNN classifiers,
respectively.
To study the effect of the number of MLP hidden layer
neurons in differentiation of the nine ECG beat types, we
varied the numbers of hidden layer neurons from 5 to 100
and their effects were considered. Since weight initialization
8 EURASIP Journal on Advances in Signal Processing
Table 2: Classification results of the proposed scheme with MLP and PNN.
Output
NORMAL LBBB RBBB PVC APC PACE FUSION FLWAV PFUS
desired
NORMAL 1500 0 0 0 0 0 0 0 0
LBBB 1 897 0 0 0 0 0 0 2
RBBB 0 2 1194 0 1 0 0 0 3
MLP with 90 PVC 0 1 1 990 0 0 0 2 6
neuron in APC 0 0 0 0 580 0 0 0 0
hidden layer PACE 0 3 0 1 0 793 0 1 2
FUSION 0 0 0 0 0 0 300 0 0
FLWAV 0 2 0 2 0 1 0 222 8
PFUS 0 2 0 0 0 0 0 0 458
NORMAL 1500 0 0 0 0 0 0 0 0
LBBB 0 894 2 0 0 2 0 0 2
RBBB 0 0 1185 3 1 5 0 0 6
PNN with PVC 0 4 1 970 3 12 0 6 4
smoothing APC 0 0 0 0 580 0 0 0 0
factor 0.11 PACE 0 1 3 3 0 793 0 0 0
FUSION 0 1 0 0 0 1 296 2 0
FLWAV 0 2 0 7 0 3 7 183 33
PFUS 0 1 0 0 0 0 0 0 459
Table 3: Classification results of the proposed scheme with MLP
and PNN.
MLP classifier PNN classifier
Average STD Average STD
Sensitivity (%)
NORMAL 100.00 0.00 100.00 0.00
LBBB 99.46 0.11 99.15 0.04
RBBB 99.19 0.21 97.90 0.20
PVC 97.57 0.64 90.89 0.39
APC 99.88 0.10 100.00 0.00
PACE 99.17 0.20 99.11 0.06
FUSION 99.65 0.40 98.11 0.00
FLWAV 90.94 1.67 79.02 0.52
PFUS 99.66 0.35 99.87 0.11
Specificity (%)
NORMAL 100.00 0.00 100.00 0.00
LBBB 99.81 0.05 99.84 0.00
RBBB 99.97 0.02 99.86 0.02
PVC 99.95 0.03 99.75 0.03
APC 99.96 0.02 99.92 0.00
PACE 99.97 0.02 99.52 0.02
FUSION 99.95 0.04 99.90 0.01
FLWAV 99.87 0.03 99.83 0.02
PFUS 99.57 0.07 99.11 0.00
Overall accuracy (%) 99.03 0.07 97.75 0.02
is random, we repeated each of the experiment setups 20
times, and the results were averaged and showed in Figure 5.
The standard deviations of overall accuracies for different
hidden layer neurons are depicted in Figure 6.
In Figure 5, the discrimination power of MLP, revealed
as the average overall accuracy, increases rapidly at small
97
97.5
98
98.5
99
99.5
Overall accuracy
5
10
15
20
25
30
35
40
45
50
55
60
65
70
75
80
85
90
95
100
Number of hidden layer neurons
Mean of overall accuracy (%)
Figure 5: Effect of hidden layer neuron number on average overall
accuracy (%) with multilayer perceptron.
numbers of hidden layer neurons and then reaches a plateau
at around 90 hidden layer neurons. At even higher hidden
layer neuron numbers, the average overall accuracies stay
at around 99%. Further increase in hidden layer neuron
number does not significantly increase the accuracy of the
classifier. On the other hand, in Figure 6, the standard
deviations of averaged overall accuracies decrease until 75
hidden layer neurons and reach a plateau at range [75–90]
and then have an ascending approach. Figures 5 and 6 show
that the best number of hidden layer neurons is 90.
The smoothing factor of the Gaussian kernel function is
a control parameter of the probabilistic neural network. To
study the effect of the smoothing factor to the performance
of the PNN classifier, a series of experiments was conducted
and the results were shown in Figure 7. The results show that
when the smoothing factor increases, the overall accuracy
decreases. When the smoothing factor is chosen in the range
from 0.04 to 0.11, the overall accuracies are the highest.
A. R. Naghsh-Nilchi and A. R. Kadkhodamohammadi 9
0
0.05
0.1
0.15
0.2
0.25
0.3
0.35
0.4
Standard deviation
5
10
15
20
25
30
35
40
45
50
55
60
65
70
75
80
85
90
95
100
Number of hidden layer neurons
Standard deviation of overall accuracy (%)
Figure 6: Standard deviation of overall accuracy versus number of
hidden layer neurons of multilayer perceptron.
82
84
86
88
90
92
94
96
98
100
Overall accuracy
0.01
0.04
0.07
0.1
0.13
0.16
0.19
0.22
0.25
0.28
0.31
0.34
0.37
0.4
0.43
0.46
0.49
Smoothing factor
Figure 7: Effects of different smoothing factors in the probabilistic
neural network.
Where the smoothing factor value is not mentioned, it is
0.11.
5. DISCUSSIONS
Comparing the average accuracy achieved with the two neu-
ral network classifiers depicted in Ta b le 3 , the result reveals
that the MLP neural network has better performance than
PNN neural network to integrate with extracted features.
It is also interesting to compare the result of proposed
method with other heartbeat recognition systems presented
in the literature. Although a lot of studies dealing with
heartbeat classification are present in the literature, a strict
comparison with the results of the present work is difficult
to perform, since different heartbeat categories were used
and different ECG datasets were considered. The following
methods which form representative heartbeat classifications
are chosen for this comparison: a modified mixture of
experts network structure for ECG beats classification with
diverse features (MME) [22]; comparing binary and real-
valued coding in hybrid immune algorithm for feature
selection and classification of ECG signals (HIA) [23]; ECG
beat classification by a novel hybrid neural network (NHNN)
[9]; integration of independent component analysis and
neural networks for ECG beat classification (ICANN) [11];
ECG beat classification using mirrored Gauss model (MGM)
[24]; the comparison of different feedforward neural net-
work architectures for ECG signal diagnosis (DFFNN) [25].
Ta bl e 4 compares the accuracy of these systems, in which the
first row of the table is the result of the method, combining
the extracted features and MLP classifier proposed in this
Table 4: Comparative results of different ECG beat classification
methods.
Methods Number of beat types Accuracy (%)
Proposed 9 99.03
MME 5 97.78
HIA 6 97.9
NHNN 10 96
ICANN 8 98
MGM 2 93.94
DFFNN 6 93
paper. All methods that were mentioned in the table use local
learning sets taken from the same sources as the selected
testing sets. Since different numbers of beat types were
exploited in different systems, the averaged classification
accuracy was calculated for comparison. Although this
comparison may not be completely fair, the proposed system
seemstobeapowerfultooltouseasECGbeatclassification
system.
The result shows that our proposed method provides
relatively higher classification accuracy than the other sys-
tems. The main advantage of our proposed method is that
it always classifies NORMAL classes correctly and never
misclassifies any as NORMAL, the feature other methods
lack. This implies that in clinical examinations, the system
always alerts of existing arrhythmic problems correctly.
6. CONCLUSION
In this paper, we proposed a scheme based on multiple signal
classification algorithm, two morphological descriptors, and
neural networks to classify nine ECG arrhythmia signals.
MUSIC algorithm is used to compute pseudospectrum
of ECG signals. The first 28 frequency samples of the
pseudospectrum with variance of peak values and times are
combined as feature vector and then served as input for the
following neural network classifiers. Two neural networks,
including multilayered perceptron (MLP) and probabilistic
neural network (PNN), were employed in the study and their
effects were compared. Of the two neural network classifiers,
MLP shows a slightly better performance than PNN in terms
of overall accuracy. The mean of overall accuracy with 90
neurons in hidden layer was 99.03%. Because the system
can recognize NORMAL class with 100% of specificity and
sensitivity, we can use it with high confidence. The result
shows that the proposed feature vector can well show the
ECG signals nature and function. This study proves that the
proposed method is an excellent model for the computer-
aided diagnosis of heart diseases based on ECG signals.
REFERENCES
[1] M. Wiggins, A. Saad, B. Litt, and G. Vachtsevanos, “Evolving a
Bayesian classifier for ECG-based age classification in medical
applications,” Applied Soft Computing Journal,vol.8,no.1,pp.
599–608, 2008.
10 EURASIP Journal on Advances in Signal Processing
[2] G. B. Moody, WFDB Programmer’s Guide,PhysioNet,Cam-
bridge, Mass, USA, 2006.
[3]H.D.Kim,C.H.Min,andT.S.Kim,“Adaptablenoise
reduction of ECG signals for feature extraction,” in Proceedings
of the 3rd International Symposium on Neural Networks
(ISNN ’06), vol. 3973 of Lecture Notes in Computer Scie nce,pp.
586–591, Chengdu, China, May 2006.
[4] T. Y. Lo and P. C. Tang, “A fast bandpass filter for ECG
processing,” in Proceedings of the 4th Annual International
Conference of the IEEE Engineering in Medicine and Biology
Society (EMBS ’82), pp. 20–21, Philadelphia, Pa, USA, Septem-
ber 1982.
[5] S N. Yu and K T. Chou, “A switchable scheme for ECG
beat classification based on independent component analysis,”
Expert Systems with Applications, vol. 33, no. 4, pp. 824–829,
2007.
[6] P. Tadejko and W. Rakowski, “Mathematical morphology
based ECG feature extraction for the purpose of heart-
beat classification,” in Proceedings of the 6th International
Conference on Computer Information Systems and Industrial
Management Applications (CISIM ’07), pp. 322–327, Elk,
Poland, June 2007.
[7] I. Jekova, G. Bortolan, and I. Christov, “Assessment and
comparison of different methods for heartbeat classification,”
Medical Engineering & Physics, vol. 30, no. 2, pp. 248–257,
2008.
[8] R. Ceylan and Y.
¨
Ozbay, “Comparison of FCM, PCA and WT
techniques for classification ECG arrhythmias using artificial
neural network,” Expert Systems with Applications, vol. 33, no.
2, pp. 286–295, 2007.
[9] Z. Dokur and T.
¨
Olmez, “ECG beat classification by a novel
hybrid neural network,” Computer Methods and Programs in
Biomedicine, vol. 66, no. 2-3, pp. 167–181, 2001.
[10] P. de Chazal and R. B. Reilly, “A comparison of the ECG clas-
sification performance of different feature sets,” in Proceedings
of the 27th Annual Conference on Computers in Cardiology,pp.
327–330, Cambridge, Mass, USA, September 2000.
[11] S N. Yu and K T. Chou, “Integration of independent compo-
nent analysis and neural networks for ECG beat classification,”
Expert Systems with Applications, vol. 34, no. 4, pp. 2841–2846,
2008.
[12] S. Haykin, Adaptive Filter Theory , Prentice-Hall, Englewood
Cliffs, NJ, USA, 2nd edition, 1991.
[13] D. G. Manolakis, V. K. Ingle, and S. M. Kogon, Statistical and
Adaptive Signal Processing, Artech House, Boston, UK, 2005.
[14] T. Iwata, Y. Goto, and H. Susaki, “Application of the multiple
signal classification (MUSIC) method for one-pulse burst-
echo Doppler sonar data,” Measurement Science and Technol-
ogy, vol. 12, no. 12, pp. 2178–2184, 2001.
[15]T.K.MoonandW.C.Stirling,Mathematical Methods and
Algorithms for Signal Processing, Prentice-Hall, Englewood
Cliffs, NJ, USA, 2000.
[16] A. Hirata, E. Taillefer, H. Yamada, and T. Ohira, “Hand-
held direction of arrival finder with electronically steerable
parasitic array radiator using the reactance-domain MUltiple
SIgnal Classification algorithm,” IET Microwaves, Antennas &
Propagation, vol. 1, no. 4, pp. 815–821, 2007.
[17] “MIT/BIH arrhythmia database directory,” Tech. Rep. BMEC
TR010, Division of Health Sciences and Technology, Harvard
University and Massachusetts Institute of Technology, Cam-
bridge, Mass, USA, July 1992, CD-ROM.
[18] F. M. Ham and S. Han, “Classification of cardiac arrhythmias
using fuzzy ARTMAP,” IEEE Transactions on Biomedical
Engineering
, vol. 43, no. 4, pp. 425–430, 1996.
[19] K. Fukunaga, Introduction to Stat istical Pattern Recognition,
Academic Press, San Diego, Calif, USA, 2nd edition, 1990.
[20] S. Haykin, Neural Networks a Comprehensive Foundation,
Prentice-Hall, Englewood Cliffs, NJ, USA, 1999.
[21] H. Demuth and M. Beale, Neural Network T oolbox,Math-
Works, Natick, Mass, USA, 2004.
[22] I. G
¨
ulerandE.D.
¨
Ubeyli, “A modified mixture of experts
network structure for ECG beats classification with diverse
features,” Engineering Applications of Artificial Intelligence, vol.
18, no. 7, pp. 845–856, 2005.
[23] M. Bereta and T. Burczy
´
nski, “Comparing binary and real-
valued coding in hybrid immune algorithm for feature
selection and classification of ECG signals,” Engineering
Applications of Artificial Intelligence, vol. 20, no. 5, pp. 571–
585, 2007.
[24] Q. Zhou, X. Liu, and H. Duan, “ECG beat classification using
mirrored gauss model,” in Proceedings of the 27th Annual
International Conference of the IEEE Engineering in Medicine
and Biology Society (EMBS ’05), pp. 5587–5590, Shanghai,
China, September 2005.
[25] H. G. Hosseini, D. Luo, and K. J. Reynolds, “The comparison
of different feed forward neural network architectures for ECG
signal diagnosis,” Medical Engineering and Physics, vol. 28, no.
4, pp. 372–378, 2006.