Báo cáo hóa học: " Research Article Detecting Pulsing Denial-of-Service Attacks with Nondeterministic Attack Intervals" docx
Bạn đang xem bản rút gọn của tài liệu. Xem và tải ngay bản đầy đủ của tài liệu tại đây (1.23 MB, 13 trang )
Hindawi Publishing Corporation
EURASIP Journal on Advances in Signal Processing
Volume 2009, Article ID 256821, 13 pages
doi:10.1155/2009/256821
Research Article
Detecting Pulsing Denial-of-Service Attacks with
Nondeterministic Attack Intervals
XiapuLuo,EdmondW.W.Chan,andRockyK.C.Chang
Department of Computing, The Hong Kong Polytechnic University, Hung Hom, Kowloon, SAR, Hong Kong
Correspondence should be addressed to Rocky K. C. Chang,
Received 14 April 2008; Revised 29 October 2008; Accepted 21 January 2009
Recommended by Chin-Tser Huang
This paper addresses the important problem of detecting pulsing denial of service (PDoS) attacks which send a sequence of attack
pulses to reduce TCP throughput. Unlike previous works which focused on a restricted form of attacks, we consider a very broad
class of attacks. In particular, our attack model admits any attack interval between two adjacent pulses, whether deterministic or
not. It also includes the traditional flooding-based attacks as a limiting case (i.e., zero attack interval). Our main contribution is
Vanguard, a new anomaly-based detection scheme for this class of PDoS attacks. The Vanguard detection is based on three traffic
anomalies induced by the attacks, and it detects them using a CUSUM algorithm. We have prototyped Vanguard and evaluated it
on a testbed. The experiment results show that Vanguard is more effective than the previous methods that are based on other traffic
anomalies (after atransformation usingwavelet transform, Fourier transform, and autocorrelation) and detection algorithms (e.g.,
dynamic time warping).
Copyright © 2009 Xiapu Luo et al. This is an open access article distributed under the Creative Commons Attribution License,
which permits unrestricted use, distribution, and reproduction in any medium, provided the original work is properly cited.
1. Introduction
Traditional denial-of-service (DoS) attacks are flooding-
based DoS (FDDoS), which overwhelm a victim with a
constant rate of useless packets. Moreover, several low-rate
DoS attacks have recently emerged. These new attacks are
able to attack TCP flows even more effectively than the
FDDoS attacks in that their average attack rate could be
much smaller for a similar damage. These attacks usually
send a sequence of attack pulses to a victim router, and the
TCP flows traversing it will periodically experience packet
losses, thus seeing significant throughput degradation. The
shrew attack [1], for example, confines a TCP sender to the
timeout state by dispatching attack pulses at carefully chosen
time instants. The reduction of quality (RoQ) attack [2] sends
periodic attack pulses to force the victim router’s active
queue management mechanism to enter transient state. The
pulsing denial-of-service (PDoS) attack [3] uses the attack
pulses to cause victim TCP senders’ congestion windows to
drop frequently.
The low-rate attacks are harder to detect than the FDDoS
attacks because of their low average attack rate and various
attack patterns. Existing detection schemes are based on
individual flows or aggregate flows. The methods in the
flow-based detection scheme label a flow as malicious if it
will periodically occupy a large portion of the bandwidth
or cause packet loss in well-behaved flows, for example,
[4–6]. However, this scheme is resource intensive, and
characterizing a legitimate flow profile for various TCP-
based applications is also very difficult. The aggregate-based
detection scheme, on the other hand, detects attacks based
on aggregated traffic statistics.
However, there are two major shortcomings to the
aggregate-based detection mechanisms. First, all of them
have been designed and tested only for a specific low-
rate DoS attack. Therefore, they may not be effective
for detecting other kinds of low-rate attacks and even
the traditional FDDoS attack. For example, the two-stage
detection algorithm proposed in [3]couldnoteffectively
detect the FDDoS attacks. Note that employing multiple
detection algorithms is problematic and difficult to manage.
Second, they have assumed specific attack scenarios, such
as a constant attack period examined in [1–3]. An attack,
however, can be easily launched under a different set of
parameters (e.g., random intervals), which could render the
detection algorithms ineffective. The anomalies in the power
2 EURASIP Journal on Advances in Signal Processing
spectrum density, for example, may not exist if the attack
period is not constant. The dynamic time warping approach
becomes ineffective if the attack pulse’s duration is longer
than the sampling period.
In this paper we propose a single detection scheme,
named, Vanguard, for the low-rate DoS attacks as well
as the FDDoS attacks. Moreover, we do not assume a
constant attack period for the low-rate DoS attacks. We
will model the attacks as a sequence of attack pulses with
arbitrary intensity and attack interval. This model therefore
encompasses the shrew attack, RoQ attack, and PDoS attack.
From this point on, we will refer to them collectively as
polymorphic PDoS (PMDoS) attacks—DoS attacks exist in
many forms. In the Vanguard design, we first identify three
traffic anomalies which are induced by the PMDoS attacks
and then employ a change-point algorithm to detect them.
To evaluate Vanguard’s effectiveness, we have implemented it
as a Snort plug-in [7]. Extensive testbed experiment results
support that Vanguard is more effective and accurate than
the previous approaches.
The rest of this paper is organized as follows. Section 2
discusses the previous detection algorithms proposed for
low-rate DoS attacks. Section 3 presents the model for the
PMDoS attacks considered in this paper. Section 4 presents
the design of Vanguard. Section 5 presents the test-bed
evaluation results to compare Vanguard with other detection
methods. Section 6 finally concludes this paper with future
work.
2. Related Work
Luo and Chang have proposed a two-stage detection system
to detect PDoS attacks on the receiver side [3]. The detection
is based on the presence of two traffic anomalies induced
by the attacks: periodic fluctuations in the incoming TCP
data traffic and a decline in the trend of the outgoing TCP
acknowledgement (ACK) traffic. In the first stage, the system
monitors the incoming data and outgoing ACK traffic using
discrete wavelet transform. In the second stage, it employs a
nonparametric CUSUM algorithm to detect the anomalies.
We therefore refer to this system as WCM (wavelet and
CUSUM). The experiment results show that the system is
very effective in detecting the PDoS attacks with constant
attack intervals. However, it will not be able to detect the
FDDoS attacks with the same effectiveness because the attack
will not cause periodic fluctuations in the TCP data traffic.
Another approach is based on a spectral analysis of
the network traffic, and we refer to it as spectrum-based
method (STM). Hussain et al. applied an STM method
to differentiate between single-source and multisource DoS
attacks [8]. Chen et al. have proposed a spectral template
matching method to detect shrew attacks [9, 10]. They
have observed that the power spectrum density of a traffic
stream containing shrew attacks has much higher energy
in low-frequency band as compared with legitimate traffic.
Based on this observation, they have developed a scheme
for collaborative anomaly detection. However, the STM
approach will not be effective for general low-rate DoS
attacks which could be easily tuned with different attack
frequencies and intervals to evade the detection.
Sun et al. have proposed using dynamic time warping
(DTW) to detect shrew attacks [11]. Similar to other
approaches, there are two main stages. In the first stage, they
use autocorrelation to extract the periodic patterns in the
incoming network traffic. The autocorrelation is also used
to eliminate the problem of time shifting. In the second
stage, they use a slightly modified DTW algorithm to detect
the signature of a shrew attack based on its autocorrelation.
They have shown the differences between legitimate and
attack traffic in their probability density functions of DTW.
However, the DTW approach will not perform well if
the attack pulses are not separated by a constant interval.
Moreover, the DTW method will not be able to detect the
FDDoS attacks effectively because the square-wave patterns,
which are assumed by their method, do not exhibit in the
traffic under attack.
D-WARD uses a useful metric that computes the ratio of
the incoming TCP traffic to the outgoing TCP ACK traffic
to detect DDoS attack [12]. Although Vanguard adopts the
same metric, its use was different from D-WARD in two
important aspects. First, D-WARD is placed in an attacker’s
source network and monitors traffic between the source
network and a foreign host; Vanguard is located at the
TCP receiver side and monitors all incoming and outgoing
TCP traffic. Second, D-WARD uses a fixed ratio of 3 to
distinguish an attack flow from legitimate ones; Vanguard
employs a nonparametric CUSUM algorithm to identify
abrupt changes in the ratio.
3. The Polymorphic DoS Attacks
We model a PMDoS attack as a sequence of attack pulses.
Each attack pulse lasts for a short period of time T
on
> 0, and
its intensity is given by R
a
bits per second (bps). Two adjacent
pulses are separated by an interval T
off
≥ 0. Generally, T
on
,
T
off
,andR
a
can assume any acceptable values. However, to
facilitate the ensuing discussion, we consider a constant R
a
.
Note that the PMDoS attacks include the shrew, RoQ, PDoS,
and FDDoS attacks as special cases. That is, the PMDoS
attack is equivalent to a PDoS or RoQ attack when both T
on
and T
off
are constant. Moreover, if T
off
is close to 1second and
T
on
is approximately equal to the round-trip time (RTT) of
the victim TCP flows, the PMDoS attack is equivalent to the
shrew attack. Furthermore, when T
off
goes to 0, the PMDoS
attack becomes an FDDoS attack.
It is useful to consider two classes of PMDoS attacks
separately. The first class is the FDDoS attacks when T
off
= 0.
Let R
n
be the bandwidth of the victim router where packets
in the victim TCP flows are dropped due to the attack. The
FDDoS attack could be a low-rate attack (i.e., R
a
<R
n
)or
a full-fledge attack (i.e., R
a
= R
n
). We refer to this class of
attacks as flooding attacks. The second class is when T
off
> 0.
In this case, it is possible that R
a
>R
n
, but the average attack
rate
R
a
must be less than R
n
. We refer to the second class of
attacks as pulsing attacks [3]. Both attacks will cause packet
losses to victim TCP flows. A less severe packet loss will
EURASIP Journal on Advances in Signal Processing 3
cause the flows to enter the fast retransmit and fast recovery
state, and a more severe one will induce timeout events. Both
cases will effectively reduce the throughput in the victim TCP
flows. We also define the attack cost by γ
= R
a
/R
n
.
In this paper we assume that the attacker sends pulses of
useless TCP data packets in a PMDoS attack. The attacker
therefore does not need to establish TCP connections to
launch such attacks. Since the attack packets are also TCP,
they will share the same queue as the legitimate TCP
packets and will cause packet losses to these legitimate flows.
Although the attack packets generally could have various
adverse effects on routers, such as consumption of CPU
and memory, we focus only on the effect of congesting the
router buffers. Using ICMP and UDP packets for the attacks
is also possible, but they may not disrupt legitimate TCP
flows because routers will classify and buffer different types
of traffic in separate queues. Moreover, we do not consider
using nonTCP-friendly flows to launch the attack because
there are already effective mechanisms to detect and punish
such malicious flows [13].
Vanguard detects PMDoS attacks from the side of TCP
receivers by analyzing the incoming TCP data trafficand
outgoing ACK traffic. Therefore, Vanguard is designed to
detect attacks for multiple hosts placed behind it. These
hosts are running TCP application clients to receive data
from external networks. It is also assumed that the data and
ACK traffic in a TCP flow can be observed by Vanguard.
For singly-homed networks, this assumption is obviously
valid. For multihomed networks, additional mechanisms
may be needed to mirror the data or ACK trafficto
Vanguard for analysis. Furthermore, the incoming data
traffic observed by Vanguard may not contain all the
attack packets involved because many attack packets will
be dropped at the bottleneck router. Moreover, these attack
packets could carry different destination addresses or have
low IP time-to-live values. Therefore, if a legitimate TCP
flow is attacked at a router which is located before Vanguard
on the forwarding path, many attack packets may not be
observable to Vanguard. We will consider trafficanomalies
for these two cases separately in the next section.
4. Vanguard: A New Anomaly-Based Detection
Scheme for the PMDoS Attacks
In this section, we will first present three trafficanoma-
lies caused by a PMDoS attack. After that, we introduce
Vanguard, a new anomaly-based detection scheme for the
PMDoS attacks.
4.1. Three Traffic Anomalies Induced by the PMDoS Attacks
4.1.1. Traffic Anomaly for Observable Attack Traffic. When
the bulk of the attack traffic is present in the incoming data
traffic, Vanguard uses an anomalous increase in the ratio of
the incoming TCP traffic to the outgoing TCP ACK traffic to
detect the PMDoS attacks. Normally this ratio, in terms of
the number of data and ACK packets, will fall between one
(due to duplicate ACK packets [14]) and two (due to the
ACK-every-other-data-segment strategy [14]). However, the
PMDoS attack packets will inflate the ratio because the attack
traffic will significantly increase the number of TCP data
packets. On the other hand, the ACK trafficwilldecreaseasa
result of the drop in the legitimate TCP data.
4.1.2. Traffic Anomalies for Unobservable Attack Traffic. When
the attack traffic is not significant in the incoming data
traffic, Vanguard uses two other anomalies for the detection
purpose. The first is an anomalous decline in the outgoing
TCP A CK traffic.AnobviouseffectofaPMDoSattack
is a decline in the outgoing TCP ACK traffic because the
victim TCP flows drop their sending rates. This anomaly
has also been used in [3] to detect PDoS attacks. However,
this anomaly alone will cause many false alarms when the
ACK traffic decline is due to a normal decrease in the data
traffic. To decrease the false alarms, Vanguard utilizes a
second anomaly: an anomalous change in the distribution
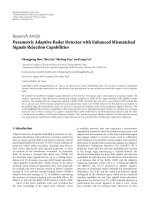
of the incoming TCP data rate. Besides the ACK traffic
decline, a PMDoS attack will also perturb the distribution
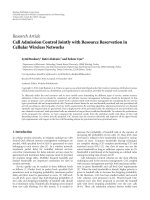
of the victim flows’ data traffic. For example, as shown
in Figure 1(a), a pulsing attack will force the victim TCP
senders’ cwnd to converge to a low value. A flooding attack
will also constrain the victim TCP flows’ cwnd, as shown
in Figure 1(b). However, the fluctuation of the cwnd for the
flooding attack is modulated by the constrained bandwidth
rather than the attack pulses.
4.2. Vanguard: A New Detection Scheme. Vanguard detects
the PMDoS attacks based on the three trafficanomalies
just described. Vanguard first constructs three corresponding
statistics: r
d
for the TCP data rate in bps, r
a
for the TCP
ACK rate in bps, and δ
f
for the absolute change in the TCP
data-rate distribution. If there is no change in the data-rate
distribution, δ
f
= 0; otherwise, δ
f
> 0. We will discuss how
they are measured shortly. Vanguard also computes r
d/a
=
r
d
/r
a
,wherer
d
and r
a
are measured in number of packets
per second. Based on the two attack scenarios discussed in
the last section, Vanguard will raise an alarm if the statement
below is true:
r
d/a
↑∨
r
a
↓∧δ
f
↑
,(1)
where
↑and ↓represent abrupt increase and abrupt decrease,
respectively. An abrupt change in the rates means a sharp
(positive or negative) change in the rates, whereas an abrupt
increase in δ
f
means a significant change in the distribution.
As we will see later, Vanguard employs a nonparametric
change-point detection algorithm to detect the abrupt
changes.
4.2.1. Measuring TCP Data Rate and ACK Rate. Vanguard
makes a detection decision at the end of a detection window of
T
w
seconds. For computing a sample data rate and a sample
ACK rate, Vanguard first obtains N
w
observations for the
volume of data and ACK packets in bytes uniformly over the
detection window. Denote the respective values by m
d
(i)and
m
a
(i) for the ith observation. Vanguard then obtains the nth
4 EURASIP Journal on Advances in Signal Processing
cwnd
Tr an si e nt
period
Steady
period
Time
Normal cwnd
cwnd under attack
Attack pulse
(a) Under a pulsing attack
cwnd
Tr an si e nt
period
Steady
period
Time
Normal cwnd
cwnd under attack
Attack traffic
(b) Under a flooding attack
Figure 1: The evolution of cwnd under a PMDoS attack [3].
sample for the data rate and ACK rate, denoted by r
d
(n)and
r
a
(n), by
r
a
(n) =
1
T
w
nN
w
i=(n−1)N
w
+1
m
a
(i),
r
d
(n) =
1
T
w
nN
w
i=(n−1)N
w
+1
m
d
(i).
(2)
Vanguard computes r
d/a
(n) = r
d
(n)/r
a
(n), where r
d
(n)and
r
a
(n) are measured in number of packets per second.
4.2.2. Measuring Changes in TCP Data-Rate Distribution.
Vanguard employs the color histogram indexing method [15]
to capture the change in the distribution. In the field of image
retrieval, it has been proven a robust method of computing
the similarity of two images [16]. In a similar way, Vanguard
uses it to measure the similarity between two TCP data-rate
distributions: the ones with and without the PMDoS attacks.
The similarity index for Vanguard is δ
f
(n). An abrupt change
in the sequence of δ
f
(n) will raise an alarm for a possible
onset of a PMDoS attack.
Vanguard computes δ
f
(n) by first generating a histogram
for the observations collected in the nth detection window.
To do so, it constructs B histogram bins for m
d
(i) obtained
from the nth detection window. Each bin’s width is given by
(m
max
d
− m
min
d
)/B,wherem
max
d
and m
min
d
are the maximum
and minimum values of the observations. The traffichis-
togram is therefore given by h(n)
= (h
n,1
, , h
n,B
), where
h
n,k
is the fraction of the observations falling into the kth
bin. Vanguard then derives a cumulative histogram (CH)
H(n)
= (H
n,1
, , H
n,B
)fromh(n): H
n,i
=
i
k=1
h
n,k
.
For detecting an anomalous data-rate distribution based
on the CH, Vanguard is also provided with a CH for the
data rates of attack-free TCP traffic which is denoted by
H = (
H
1
, ,
H
B
). A set of training data is usually provided
for deriving the CH and also other parameters for the
detection algorithm in use (see the next section on change-
point detection). Vanguard uses the Euclidean distance for
computing δ
f
(n):
δ
f
(n) =
B
k=1
H
n,k
−
H
k
2
. (3)
4.2.3. Change-Point Detection. Vanguard uses the CUSUM
algorithm to detect abrupt changes in the sequences of r
a
(n),
r
d/a
(n), and δ
f
(n). The CUSUM algorithm has been success-
fully applied to tackle many signal processing problems [17].
The algorithm assumes that the mean of the variables being
monitored will change from negative to positive. However,
r
a
, r
d/a
,andδ
f
are always nonnegative under an attack-free
environment. Vanguard therefore transforms them into three
new random sequences:
s
a
(n) = α
a
−r
a
(n),
s
d/a
(n) = r
d/a
(n) −α
d/a
,
s
δ
(n) = δ
f
(n) −α
δ
,
(4)
where α
a
, α
d/a
,andα
δ
are constants. Since a PMDoS attack
will decrease r
a
(n) and increase r
d/a
(n)andδ
f
(n), the
attack will increase the values of s
·
(n)’s. If the increases
are significant enough, the s
·
(n)’swillbecomepositive,
thus resulting in abrupt changes to the three monitored
sequences.
To determine the values of α
a
, α
d/a
,andα
δ
, a set of
attack-free training data is needed. Vanguard computes from
the training set the average and standard deviation for r
a
(denoted by avg(r
a
) and std(r
a
)), the maximum value for
EURASIP Journal on Advances in Signal Processing 5
Incoming data
and outgoing
ACK traffic
Snort IDS
Sniffer
Preprocessor
Detection engine
Alerts/logging
Vanguard preprocessor
Network traffic
analysis
CUSUM change
points detection
Previous
statistics
r
d/a
(n), r
a
(n)
and δ
f
(n)
Fetch y
s
d/a
(n − 1), y
s
a
(n − 1)
and y
s
δ
(n − 1)
Store y
s
d/a
(n), and y
s
a
(n)
and y
s
δ
(n)
If (y
s
d/a
(n) >η
d/a
)or
(y
s
a
(n) >η
a
and y
s
δ
(n) >η
δ
)
Figure 2: A Snort implementation of Vanguard.
r
d/a
(denoted by max(r
d/a
)), and the maximum value for δ
f
(denoted by max(
δ
f
)). Vanguard then sets
α
a
= avg
r
a
−β ×std
r
a
,
α
d/a
= max
r
d/a
,
α
δ
= max
δ
f
.
(5)
Note that we could have set α
a
= avg(r
a
). However,
to provide flexibility in configuring Vanguard, we have
introduced β—a configurable parameter that determines
Vanguard’s sensitivity to the decline in the ACK rate. The
value of β isusuallysetto1or2.
We denote the CUSUM values of s
a
(n)byy
s
a
(n)whichis
obtained by
y
s
a
(n) = max
0, y
s
a
(n −1) + s
a
(n)
, n ≥ 1,
y
s
a
(0) = 0.
(6)
The presence of an anomalous decline in the outgoing ACK
trafficisconfirmedify
s
a
(n) >η
a
,whereη
a
is the correspond-
ing CUSUM threshold. Similarly, by comparing the CUSUM
values y
s
d/a
(n)andy
s
δ
(n) with the corresponding CUSUM
thresholds η
d/a
and η
δ
, Vanguard can confirm an anomalous
increase in the ratio of data and ACK rates and an anomalous
change in the data-rate distribution.
5. Performance Evaluation
To evaluate the performance of Vanguard, we have imple-
mented Vanguard as a preprocessor plug-in in a Snort intru-
sion detection system (IDS) [7] and conducted experiments
on a testbed. We have also compared the WCM, DTW, and
STM methods discussed in Section 2 with Vanguard.
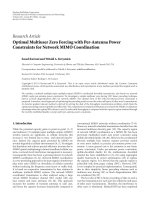
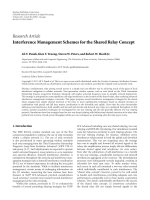
5.1. A Snort implementation of Vanguard. Figure 2 depicts
the architecture of our Snort implementation of Van-
guard. After the Vanguard preprocessor is registered
in the Snort’s preprocessor list through the function
AddFuncToPreprocList(), Snort starts intercepting the
incoming TCP data traffic and outgoing ACK traffic for the
hosts under its protection and forwards them to the Network
Tr affic Analysis (NTA) unit in the Vanguard preprocessor.
The NTA unit records the packet size and updates the
corresponding packet counter for the current sampling
interval. Whenever N
w
continuous observations (a detection
window) have been collected, they evaluate r
a
, r
d/a
,andδ
f
according to (2)and(3) and sends them to the CUSUM
Change-Points Detection (CCPD) unit. The CCPD unit is
responsible for detecting PMDoS attacks using the CUSUM
algorithm and the detection rule in (1). If an alarm is raised,
it will immediately call the function SnortEventqAdd()
to pass a PMDoS attack alert to the Snort’s Alert/Logging
module. Note that our Vanguard implementation does not
use Snort’s detection engine.
Before the Vanguard preprocessor begins the PMDoS
attack detection process, the preprocessor has to first deter-
mine the constant values (α
a
, α
d/a
, α
δ
, η
a
, η
d/a
,andη
δ
)
using a set of training data. The preprocessor therefore
provides a facility to specify the length of the training period,
in terms of the number of continuous detection windows
(denoted by N
d
), before using it for detection. At the end of
the training period, it computes α
a
, α
d/a
,andα
δ
according
to (5), respectively, and sets the CUSUM thresholds η
a
,
η
d/a
,andη
δ
to the means of the sequences {|s
a
(n)|}
N
d
n=1
,
max
{{|s
d/a
(n)|}
N
d
n=1
,2.5},and{|s
δ
(n)|}
N
d
n=1
,respectively.To
reduce the number of false alarms in the Vanguard detection,
we have applied a minimum threshold (i.e., 2.5) for η
d/a
.
However, we do not apply it to η
a
and η
δ
because normal
TCP data and ACK traffic rates could vary significantly.
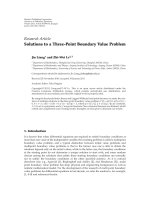
5.2. A Testbed. Figure 3 shows a general testbed for evalu-
ating Vanguard and other detection schemes. The testbed
consists of b+1 routers. All the links, except for the bottleneck
link (the last link) between X
b
(the bottleneck router) and
X
b+1
, have a one-way propagation delay of T
x
milliseconds
and a capacity of R
x
Mbps. The bottleneck link, on the other
hand, has a one-way propagation delay of T
b
milliseconds
and a capacity of R
b
Mbps, and does not carry cross-traffic.
The N
s
long-lived legitimate TCP flows traverse all routers
and arrive at the receivers. Moreover, there are N
c
cross-
traffic sources of long-lived TCP flows competing for the
router resources. A PMDoS attacker generates attack traffic
destined to the receivers. Therefore, the legitimate end-to-
end TCP flows will suffer from packet losses at X
b
. Vanguard
6 EURASIP Journal on Advances in Signal Processing
Attack source
TCP
senders
.
.
.
X
1
X
2
Cross-trafficsources
···
······
···
···
X
b
Bottleneck
link
Bottleneck
router
X
b+1
Va ng ua rd
TCP
receivers
Legitimate TCP traffic
Attack TCP traffic
One-hop cross traffic
.
.
.
Figure 3: A general testbed for the empirical evaluation of Vanguard and other detection schemes.
performs detection based on the trafficobservedfroma
receiver’s link connected to X
b+1
.
In our testbed evaluation to be presented next, we have
used the following settings: b
= 2 (three routers), N
s
= 15
(TCP New Reno), N
c
= 10 (TCP New Reno), T
x
= 15
milliseconds, T
b
= 30 milliseconds, R
x
= 100 Mbps, and
R
b
= 10 Mbps. Each legitimate TCP flow experiences a fixed
RTT of 150 milliseconds (denoted by rtt ) and employs a
minimum retransmission timeout value of 1s. The three
routers’ hardware configurations are Pentium III/500 Mhz
with 256 MB RAM running FreeBSD v4.9. The bottleneck
router X
b
is configured with Dummynet [18]tosimulate
a Random Early Detection (RED) [19] queue of size Q
=
(rtt × R
b
)/8bytes.WehaveadoptedtheREDparameters
suggested in [20]: max
th
= 0.7Q,min
th
= 0.2Q, w
q
= 0.002,
and max
p
= 0.1. We have also set-up another RED queue
in X
b
with the same parameter settings for the outgoing
TCP ACK traffic. The hardware configurations of all TCP
senders/receivers are Pentium 4/1.5 GHz with 512 MB RAM
running Linux kernel v2.6.5. The attacker has the same
hardware configurations and is running Windows XP SP1.
For the PMDoS attacks, we have considered nine attack
costs: γ
= 0.1, 0.2, ,0.9. In addition, we have tried out six
different attack configurations to achieve a given attack cost:
T
on
={150,200,250} milliseconds and R
a
={20,40}Mbps.
Although the attack cost is the same, these six configurations
areexpectedtohavedifferent impacts on the legitimate flows.
An attack with higher T
on
and R
a
willcausemorepacket
losses in a single attack pulse. We have set the minimum T
on
to rtt (i.e., 150 ms) in order to maximize the impact of an
attack pulse on the victim TCP flows. Choosing a T
on
< rtt,
on the other hand, will have less impact because the attack
pulse could miss many TCP flows. We have applied these
54 scenarios to both pulsing and periodic attacks. We have
also experimented with the FDDoS attacks using the nine
attack costs. As a result, we have evaluated Vanguard and
other detection systems based on a total of 117 (54
× 2+9)
different attack scenarios.
The experiment for each scenario lasts for 370 seconds.
At the 131st seconds, the attacker launches a PMDoS attack
that lasts to the end of the experiment. We have implemented
the PMDoS attack traffic generator using WinPcap v3.0 [21].
Both the legitimate flows and cross trafficaregenerated
using Iperf v1.7.0 [22]. We have employed the Snort
implementation of Vanguard with the following settings:
T
w
= 5 seconds and N
w
= 1000 to achieve a small detection
delay, and N
d
= 20 (a training period of 100 seconds) to
obtain an adequate training period. Moreover, Vanguard uses
B
= 25 for computing δ
f
(n)andβ = 2 for computing α
a
.
The detection time of 240 seconds (i.e., 370–130 seconds)
therefore corresponds to an unsuccessful detection.
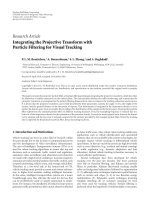
5.3. A Testbed Evaluation of Vanguard. Figures 4, 5,and6
illustrate the Vanguard detection of a periodic pulsing attack
(i.e., the attack interval is a nonzero constant), a stochastic
pulsing attack (i.e., the attack interval is random), and a
flooding attack (i.e., the attack interval is 0), respectively. The
data are based on γ
= 0.6 for both flooding and pulsing
attacks. The periodic and stochastic pulsing attacks use R
a
=
30 Mbps and T
on
= 150 milliseconds.
Subfigure (a) shows the raw incoming TCP traffic in the
upper panel and the raw outgoing ACK traffic in the lower
panel. Subfigures (b)–(d) plot the respective sequences of
r
a
(n), r
d/a
(n), and δ
f
(n). In each of them, the upper panel
shows the raw data of the statistics, and the lower panel
shows the CUSUM detection results of these statistics. We
can observe from subfigure (a) that the data and ACK traffic
exhibit abrupt changes at the onset of the attack (i.e., at the
131st seconds). There is a similar drop in the ACK rate across
the three attack scenarios. However, the impacts on the data
rates are not entirely the same. In particular, the variability
in the data rate for the flooding attack is much less than the
other two. The subfigures (b)–(d) also show that the CUSUM
can effectively detect the onsets of the three attacks.
Figure 7 plots the total time required for detecting the
PMDoS attacks against the attack cost for the 117 attack
scenarios. Each symbol represents the detection time for
a scenario. Note that the results for flooding attacks are
present in both subfigures. Figure 7(a) shows the results
for the periodic pulsing attacks, and Figure 7(b) shows the
EURASIP Journal on Advances in Signal Processing 7
0
5
10
×10
3
Incoming data
traffic(bytes)
100 110 120 130 140 150
Time (s)
Attack period
0
2
4
6
×10
2
Outgoing ACK
traffic(bytes)
100 110 120 130 140 150
Time (s)
(a) A periodic pulsing attack
0
2
4
×10
4
r
a
Attack period
100 110 120 130 140 150
Time (s)
0
1
2
×10
5
CUSUM
100 110 120 130 140 150
Time (s)
CUSUM value
CUSUM threshold
= 623.1
(b) r
a
0
5
10
r
d/a
Attack period
100 110 120 130 140 150
Time (s)
0
10
20
30
CUSUM
100 110 120 130 140 150
Time (s)
CUSUM value
CUSUM threshold
= 2.5
(c) r
d/a
0
2
4
δ
f
Attack period
100 110 120 130 140 150
Time (s)
0
2
4
6
CUSUM
100 110 120 130 140 150
Time (s)
CUSUM value
CUSUM threshold
= 0.0194
(d) δ
f
Figure 4: Detecting periodic pulsing attacks using Vanguard.
results for the stochastic pulsing attacks. Each subfigure also
includes the detection times for the flooding attacks. Note
that Vanguard can identify all the attack scenarios within six
detection windows (i.e., 30 seconds). In fact, it can detect
all the flooding attacks immediately after the first detection
window. It is not difficult to see why more time is required
to confirm a less aggressive pulsing attack (i.e., with a small
attack cost), particularly with stochastic attack intervals.
We have also repeated the experiments using a Droptail
queue with the same queue length as the RED queue. The
experiment results show that Vanguard can also identify all
the PMDoS attacks.
There are clearly tradeoffs in selecting between large
and small detection windows. A small T
w
can speed up the
Vanguard detection, but it is more sensitive to the surge of
the monitored traffic. A too large T
w
, on the other hand, will
be too slow to detect an attack. Based on the experiment
results, a suitable choice for our experiments is T
w
= 5
seconds. Another important Vanguard parameter is B that
determines the granularity of the traffichistogram.Our
experiment results show that 25 bins gives good results for
all experiments. The effect of noise could be significant
when the bin size becomes larger. In such a finely quantized
histogram, many bins will have a zero count (no traffic);
therefore, a slight change in the traffic can result in a
significant change in the resultant histogram, thus producing
a false alarm.
5.4. Vanguard’s False Positive Rates. To evaluate Vanguard’s
false positive rate (FPR), we turn to the real data traces
because they contain realistic traffic dynamic which may not
appear in our testbed environment. We have used TCP flows
collected from 13 sets of the LBNL enterprise data traces
[23] from October 2004 to January 2005 and nine sets of
WIDE backbone data traces [24] from September 2005 to
March 2006. To acquire an adequate training period, we
have run Vanguard detection for the TCP flows containing
at least 100 TCP data segments in either direction. We have
set the training period to 44% of the longest lifetime of the
target flows, so that the training periods for all the flows are
not less than 20 seconds. Accordingly, we have obtained 62
and 49 TCP flows from the LBNL and WIDE trace sets for
the evaluation, respectively. Other configuration settings for
Vanguard remain unchanged.
Vanguard raised alert for one flow in both the LBNL
trace set and WIDE trace set, thus yielding respective FPRs
of 1.62% and 2.04%. Moreover, both false alerts were due
to the criterion of r
a
↓∧δ
f
↑. The Vanguard’s false alarms
8 EURASIP Journal on Advances in Signal Processing
0
5
10
×10
3
Incoming data
traffic(bytes)
100 110 120 130 140 150
Time (s)
Attack period
0
2
4
6
×10
2
Outgoing ACK
traffic(bytes)
100 110 120 130 140 150
Time (s)
(a) A stochastic pulsing attack
0
2
4
×10
4
r
a
Attack period
100 110 120 130 140 150
Time (s)
0
1
2
×10
5
CUSUM
100 110 120 130 140 150
Time (s)
CUSUM value
CUSUM threshold
= 1039
(b) r
a
0
5
10
r
d/a
100 110 120 130 140 150
Time (s)
0
10
20
30
CUSUM
100 110 120 130 140 150
Time (s)
CUSUM value
CUSUM threshold
= 2.506
(c) r
d/a
0
2
4
δ
f
Attack period
100 110 120 130 140 150
Time (s)
0
2
4
6
CUSUM
100 110 120 130 140 150
Time (s)
CUSUM value
CUSUM threshold
= 0.0258
(d) δ
f
Figure 5: Detecting stochastic pulsing attacks using Vanguard.
are due to the idle periods existing in both TCP data traffic
and TCP ACK traffic. There are two consequences for the
legitimate idle periods existing in the flow. First, these idle
periods remain in the whole training period and thus result
in “false” thresholds for r
a
and δ
f
. Therefore, a sudden
increase in the TCP data trafficorTCPACKtrafficwillmake
thedetectionrulein(1) true. However, the threshold for r
d/a
is not affected by the idle period because of the minimum
threshold value of 2.5. Second, these idle periods abruptly
decrease r
a
and increase δ
f
during the Vanguard detection,
and, as a result, the detection rule in (1)becomestrue.A
possible way to resolve this problem is to detect and skip
these idle periods during the Vanguard detection. The idle
periods could be identified by comparing the interpacket
interval with a threshold.
5.5. Comparing with Other Detection Methods. We have also
evaluated the WCM, DTW, and STM methods and compared
their performance with Vanguard. We have implemented the
WCM [3], DTW [11], and STM [8] methods in MATLAB
and obtained their performance using the data traces cap-
tured from the testbed experiments conducted for Vanguard.
Therefore, the legitimate and attack traffic used for the
comparisons are the same as for Vanguard’s evaluation.
5.5.1. The WCM Method. Figure 8 shows the average detec-
tion time versus the attack cost for the WCM method. For the
WCM method’s configurations, we have set each sampling
window to 12.8 seconds to achieve a small detection delay
and N
d
= 6 to obtain a training period of 76.8 seconds. The
remaining configurations are the same as those used in [3].
The average detection rate is 92.31%. Although the WCM
method can discover all the ongoing periodic and stochastic
pulsing attacks within three detection windows (i.e., 38.4
seconds), the figures show that it is unable to detect any
flooding attack. Since the flooding attack traffic constantly
occupies a fixed portion of the bottleneck link capacity,
the incoming TCP data traffic adapts to the remaining
bandwidth without significant fluctuations.
5.5.2. The DTW Method. Besides filtering noise in the
incoming traffic, the DTW method also modifies the original
dynamic time warping algorithm by introducing an adaptive
penalty p to avoid matching patterns with different periods
[25]. We realized the DTW method based on the imple-
mentation of the original dynamic time warping algorithm
[26]. For the experiment setup, we have employed the same
parameters suggested in [25, Section 3.6]. In particular, we
have set the noise filter threshold β
2
= 0.3 and the penalty
EURASIP Journal on Advances in Signal Processing 9
0
5
10
×10
3
Incoming data
traffic(bytes)
100 110 120 130 140 150
Time (s)
Attack period
0
2
4
6
×10
2
Outgoing ACK
traffic(bytes)
100 110 120 130 140 150
Time (s)
(a) A flooding attack
0
2
4
×10
4
r
a
Attack period
100 110 120 130 140 150
Time (s)
0
1
2
×10
5
CUSUM
100 110 120 130 140 150
Time (s)
CUSUM value
CUSUM threshold
= 652.4
(b) r
a
0
5
10
r
d/a
Attack period
100 110 120 130 140 150
Time (s)
0
10
20
30
CUSUM
100 110 120 130 140 150
Time (s)
CUSUM value
CUSUM threshold
= 2.5
(c) r
d/a
0
2
4
δ
f
Attack period
100 110 120 130 140 150
Time (s)
0
2
4
6
CUSUM
100 110 120 130 140 150
Time (s)
CUSUM value
CUSUM threshold
= 0.0391
(d) δ
f
Figure 6: Detecting flooding attacks using Vanguard.
0
5
10
15
20
25
30
35
40
Detection time (seconds)
00.20.40.60.81
γ
Pulsing (T
on
= 150 ms, R
a
= 20 M)
Pulsing (T
on
= 150 ms, R
a
= 40 M)
Pulsing (T
on
= 200 ms, R
a
= 20 M)
Pulsing (T
on
= 200 ms, R
a
= 40 M)
Pulsing (T
on
= 250 ms, R
a
= 20 M)
Pulsing (T
on
= 250 ms, R
a
= 40 M)
Flooding
(a) Periodic pulsing attacks and flooding attacks
0
5
10
15
20
25
30
35
40
Detection time (seconds)
00.20.40.60.81
γ
Pulsing (T
on
= 150 ms, R
a
= 20 M)
Pulsing (T
on
= 150 ms, R
a
= 40 M)
Pulsing (T
on
= 200 ms, R
a
= 20 M)
Pulsing (T
on
= 200 ms, R
a
= 40 M)
Pulsing (T
on
= 250 ms, R
a
= 20 M)
Pulsing (T
on
= 250 ms, R
a
= 40 M)
Flooding
(b) Stochastic pulsing attacks and flooding attacks
Figure 7: Average detection time for pulsing and flooding attacks using Vanguard.
10 EURASIP Journal on Advances in Signal Processing
0
40
80
120
160
200
240
Detection time (seconds)
00.2
0.40.60.81
γ
Pulsing (T
on
= 150 ms, R
a
= 20M)
Pulsing (T
on
= 150 ms, R
a
= 40M)
Pulsing (T
on
= 200 ms, R
a
= 20M)
Pulsing (T
on
= 200 ms, R
a
= 40M)
Pulsing (T
on
= 250 ms, R
a
= 20M)
Pulsing (T
on
= 250 ms, R
a
= 40M)
Flooding
(a) Periodic pulsing attacks and flooding attacks
0
40
80
120
160
200
240
Detection time (seconds)
00.2
0.40.60.81
γ
Pulsing (T
on
= 150 ms, R
a
= 20M)
Pulsing (T
on
= 150 ms, R
a
= 40M)
Pulsing (T
on
= 200 ms, R
a
= 20M)
Pulsing (T
on
= 200 ms, R
a
= 40M)
Pulsing (T
on
= 250 ms, R
a
= 20M)
Pulsing (T
on
= 250 ms, R
a
= 40M)
Flooding
(b) Stochastic pulsing attacks and flooding attacks
Figure 8: Average detection time for pulsing and flooding attacks using the WCM method.
value p = 0.01. The period and the burst width of the low-
rate attack signature template are 1.2 seconds and 0.2 second,
respectively.
Figure 9 reports the DTW value versus the attack cost for
the DTW method. The dashed line with () is the DTW
threshold of 60 (28.01) for the purpose of differentiating
between Gaussian (self-similar) legitimate traffic and attack
traffic[11, 25]. If the DTW value is less than the threshold,
the algorithm will confirm the presence of a PMDoS attack.
The average detection rates with the DTW thresholds of 60
and 28.01 are 87.18% and 75.21%, respectively, which are
less than what can be achieved by Vanguard and the WCM
method. Similar to the WCM method, the DTW method also
cannot detect any flooding attack because it was designed
specifically for the shrew attack by matching the pattern of
the incoming TCP data traffic with the shrew attack traffic.
5.5.3. The STM Method. Figure 10 shows the values of
F(60%) versus the attack cost for the STM method. In [8],
F(p) is defined as the frequency at which the normalized
cumulative spectrum captures p% of the power. F(p)is
mainly used for comparing power spectral graphs. In our
experiments, we adopt F(60%) used in [8]. The experiment
results show that the values of F(60%) for the pulsing attacks
do not concentrate on a small range. Instead, they spread
from low frequencies to high frequencies. Therefore, the
STM method cannot detect a PMDoS attack based on a
static, small range of frequencies as in the case of shrew
attacks.
5.5.4. False Positive Rates. We have also evaluated the FPRs
for the WCM, DTW, and STM methods using the 62 and
49 TCP flows from the same LBNL and WIDE trace sets,
respectively, for the evaluation of Vanguard’s FPR. The
methods’ configuration settings remain unchanged. Ta bl e 1
summarizes the results for the three methods. We have also
shown Vanguard’s FPRs for comparison. Among the four
methods, Vanguard achieves the FPRs less than 3% for both
trace sets. The WCM method also achieves low FPRs for
the WIDE trace set because it does not contain significant
fluctuations of data traffic and abnormal declines in the ACK
traffic.
The DTW method, on the other hand, shows the most
disappointing performance for both sets of TCP flows with
the Gaussian and self-similar thresholds. We note that the
thresholds were determined from simulated trafficwhich
may deviate significantly from the realistic traffic. Moreover,
our FPR evaluation was based only on the TCP flows for
which the data and ACK packets were present, but the DTW
method does not have this requirement for the threshold
computation. Therefore, we have repeated the evaluation
with a DTW threshold η
DTW
44%
using the minimum DTW
values of the 44% of the TCP flows for each trace set. By
using η
DTW
44%
of 5.355 (5.530) for the LBNL (WIDE) trace set,
the FPR for the remaining 35 (27) TCP flows drops to 8.57%
(0%).
5.5.5. Time Complexity Analysis. Having a low computa-
tional complexity is a very important consideration in
designing a practical detection system. Therefore, we com-
pare the time complexity for Vanguard and other methods
in this section. Ta bl e 2 summarizes the comparison results,
where N is the number of observations collected in a
detection window. Both Vanguard and the WCM methods
achieve the lowest time complexity. Before considering each
method, we first note that the lowest time complexity for
EURASIP Journal on Advances in Signal Processing 11
0
20
40
60
80
100
120
DTW value
00.20.40.60.81
γ
Pulsing (T
on
= 150ms, R
a
= 20 M)
Pulsing (T
on
= 150ms, R
a
= 40 M)
Pulsing (T
on
= 200ms, R
a
= 20 M)
Pulsing (T
on
= 200ms, R
a
= 40 M)
Pulsing (T
on
= 250ms, R
a
= 20 M)
Pulsing (T
on
= 250ms, R
a
= 40 M)
Flooding
Threshold (Gaussian)
Threshold (self-similar)
(a) Periodic pulsing attacks and flooding attacks
0
20
40
60
80
100
120
DTW value
00.20.40.60.81
γ
Pulsing (T
on
= 150ms, R
a
= 20 M)
Pulsing (T
on
= 150ms, R
a
= 40 M)
Pulsing (T
on
= 200ms, R
a
= 20 M)
Pulsing (T
on
= 200ms, R
a
= 40 M)
Pulsing (T
on
= 250ms, R
a
= 20 M)
Pulsing (T
on
= 250ms, R
a
= 40 M)
Flooding
Threshold (Gaussian)
Threshold (self-similar)
(b) Stochastic pulsing attacks and flooding attacks
Figure 9: Average detection time for pulsing and flooding attacks using the DTW method.
0
50
100
150
200
250
300
350
400
450
500
F (60%)
00.20.40.60.81
γ
Pulsing (T
on
= 150 ms, R
a
= 20M)
Pulsing (T
on
= 150 ms, R
a
= 40M)
Pulsing (T
on
= 200 ms, R
a
= 20M)
Pulsing (T
on
= 200 ms, R
a
= 40M)
Pulsing (T
on
= 250 ms, R
a
= 20M)
Pulsing (T
on
= 250 ms, R
a
= 40M)
Flooding
(a) Periodic pulsing attacks and flooding attacks
0
50
100
150
200
250
300
350
400
450
500
F (60%)
00.20.40.60.81
γ
Pulsing (T
on
= 150 ms, R
a
= 20M)
Pulsing (T
on
= 150 ms, R
a
= 40M)
Pulsing (T
on
= 200 ms, R
a
= 20M)
Pulsing (T
on
= 200 ms, R
a
= 40M)
Pulsing (T
on
= 250 ms, R
a
= 20M)
Pulsing (T
on
= 250 ms, R
a
= 40M)
Flooding
(b) Stochastic pulsing attacks and flooding attacks
Figure 10: Average detection times for pulsing and flooding attacks using the STM method.
the methods under consideration is Θ(N) because their
detection decisions are all based on N observations.
Vanguard’s time complexity is Θ(N) which can be
obtained according to the following. Recall that there are
three statistics to compute. The statistics r
a
(n)andr
d
(n)
are updated upon receiving each observation. For δ
d
(n), by
using identical bin size, the respective bin can be quickly
located for each observation received. After that, the burden
of computing δ
d
(n) is determined by B, which is usually less
than N.
12 EURASIP Journal on Advances in Signal Processing
Table 1: A comparison of the detection methods’ false positive
rates.
Detection methods LBNL WIDE
Vanguard 1.62% 2.04%
WCM 5% 2.04%
STM 16.07% 32.39%
DTW (Gaussian) 93.55% 100%
DTW (self-similar) 89.66% 100%
DTW (η
DTW
44%
) 8.57% 0%
Table 2: A comparison of the detection methods’ time complexity.
Detection methods Time complexity
Vanguard Θ(N)
WCM Θ(N)
STM Θ(N log N)
DTW Θ(N
2
)
The WCM method’s time complexity is given by that
of the discrete wavelet transform which is Θ(N)[27]. The
STM method’s time complexity is determined mainly by
the amount of work on computing the power spectrum
density, which is Θ(N log N)[28]. For the DTW method, the
computational complexity of the autocorrelation processing
is Θ(N
2
) and that of DTW is Θ(NL), where L is the length of
selected signatures for the shrew attack. The method’s time
complexity is therefore Θ(N
2
).
6. Conclusions and Future Work
In this paper we have proposed Vanguard to detect a class of
pulsing and flooding DoS attacks, which we refer to them
collectively as polymorphic DoS (PMDoS) attacks. Unlike
the traditional flooding-based DoS attack, the PMDoS attack
may exhibit various traffic patterns that cannot be easily
detected. The detection engine in Vanguard is based on three
traffic anomalies. A single anomaly is used for the case of
observable attack traffic, whereas the other two cases are
used for the case of unobservable attack traffic. We have
subsequently designed a detection algorithm based on the
relevant statistics and a CUSUM algorithm to detect abrupt
changes in them.
To evaluate Vanguard on a testbed, we have implemented
it as a Snort plug-in. The experiment results have confirmed
Vanguard’s capability of detecting a wide range of PMDoS
attacks with a short detection time. We have also evaluated
other detection methods on the testbed. None of them could
effectively detect the diverse attack scenarios as Vanguard
does because they were designed for either specific DoS
attacks or restricted attack scenarios. In the future work,
we will mainly concentrate on applying effective machine
learning algorithms to improve the detection performance.
Acknowledgments
The work described in this paper was partially supported by
a grant from the Research Grant Council of the Hong Kong
Special Administrative Region (Project no. PolyU 5080/02E),
a grant from the Areas of Excellence Scheme established
under the University Grants Committee of the Hong Kong
Special Administrative Region (Project no. AoE/E-01/99),
a grant from the Cisco University Research Program Fund
at Community Foundation Silicon Valley, and a PolyU
Research Grant (Project no. G-T848). The authors are also
indebted to the three reviewers and Professor Chin-Tser
Huang for meticulously reviewing the manuscripts and for
offering many useful comments and questions to improve
the readability and technical accuracy of this paper.
References
[1] A. Kuzmanovic and E. W. Knightly, “Low-rate TCP-targeted
denial of service attacks: the shrew vs. the mice and elephants,”
in Proceedings of the Conference on Applications, Technologies,
Architectures, and Protocols for Computer Communications
(SIGCOMM ’03), pp. 75–86, Karlsruhe, Germany, August
2003.
[2] M. Guirguis, A. Bestavros, and I. Matta, “Exploiting the tran-
sients of adaptation for RoQ attacks on internet resources,”
in Proceedings of the 12th IEEE International Conference on
Network Protocols (ICNP ’04), pp. 184–195, Berlin, Germany,
October 2004.
[3] X. Luo and R. K. C. Chang, “On a new class of pulsing
denial-of-service attacks and the defense,” in Proceedings of the
Network and Distributed System Security Symposium (NDSS
’05), pp. 1–19, San Diego, Calif, USA, February 2005.
[4] A. Shevtekar, K. Anantharam, and N. Ansari, “Low rate
TCP denial-of-service attack detection at edge routers,” IEEE
Communications Letters, vol. 9, no. 4, pp. 363–365, 2005.
[5] Y K. Kwok, R. Tripathi, Y. Chen, and K. Hwang, “HAWK:
halting anomalies with weighted choKing to rescue well-
behaved TCP sessions from shrew DDoS attacks,” in Pro-
ceedings of the 3rd International Conference on Computer
Network and Mobile Computing (ICCNMC ’05), pp. 423–432,
Zhangjiajie, China, August 2005.
[6] Y. Xu and R. Gu
´
erin, “On the robustness of router-based
denial-of-service (DoS) defense systems,” ACM SIGCOMM
Computer Communication Review, vol. 35, no. 3, pp. 47–60,
2005.
[7] The open source network intrusion detection system: Snort,
.
[8] A. Hussain, J. Heidemann, and C. Papadopoulos, “A frame-
work for classifying denial of service attacks,” in Proceedings of
the Conference on Applications, Technologies, Architectures, and
Protocols for Computer Communications (SIGCOMM ’03),pp.
99–110, Karlsruhe, Germany, August 2003.
[9] Y. Chen, K. Hwang, and Y K. Kwok, “Filtering of shrew
DDoS attacks in frequency domain,” in Proceedings of the 30th
Anniversary of IEEE Conference on Local Computer Networks
(LCN ’05), pp. 786–793, Sydney, Australia, November 2005.
[10] Y. Chen and K. Hwang, “Collaborative detection and filtering
of shrew DDoS attacks using spectral analysis,” Journal of
Parallel and Distributed Computing, vol. 66, no. 9, pp. 1137–
1151, 2006.
[11] H. Sun, J. C. S. Lu, and D. K. Y. Yau, “Defending against
low-rate TCP attacks: dynamic detection and protection,”
in Proceedings of the 12th IEEE International Conference on
Network Protocols (ICNP ’04), pp. 196–205, Berlin, Germany,
October 2004.
EURASIP Journal on Advances in Signal Processing 13
[12] J. Mirkovic, G. Prier, and P. Reiher, “Attacking DDoS at
the source,” in Proceedings of the 10th IEEE International
Conference on Network Protocols (ICNP ’02), pp. 312–321,
Paris, France, November 2002.
[13] K. Chandrayana and S. Kalyanaraman, “Uncooperative con-
gestion control,” in Proceedings of the ACM Joint International
Conference on Measurement and Modeling of Computer Systems
(SIGMETRICS ’04), pp. 258–269, New York, NY, USA, June
2004.
[14] M. Allman, V. Paxson, and W. Stevens, “TCP congestion
control,” Tech. Rep. RFC 2581, IETF, San Francisco, Calif,
USA, April 1999.
[15] M. A. Stricker and M. Orengo, “Similarity of color images,” in
Storage and Retrieval for Image and Video Databases III, vol.
2420 of Proceedings of SPIE, pp. 381–392, San Jose, Calif, USA,
February 1995.
[16] A. W. M. Smeulders, M. Worring, S. Santini, A. Gupta, and
R. Jain, “Content-based image retrieval at the end of the early
years,” IEEE Transactions on Pattern Analysis and Machine
Intelligence, vol. 22, no. 12, pp. 1349–1380, 2000.
[17] B. Brodsky and B. Darkhovsky, Non-Parametric Statistical
Diagnosis: Problems and Methods, Kluwer Academic Publish-
ers, Dordrecht, The Netherlands, 2000.
[18] L. Rizzo, “Dummynet: a simple approach to the evaluation of
network protocols,” ACM SIGCOMM Computer Communica-
tion Review, vol. 27, no. 1, pp. 31–41, 1997.
[19] S. Floyd and V. Jacobson, “Random early detection gateways
for congestion avoidance,” IEEE/ACM Transactions on Net-
working, vol. 1, no. 4, pp. 397–413, 1993.
[20] S. Floyd, “RED: Discussions of Setting Parameters,” 1997,
/>[21] “WinPcap: The Windows Packet Capture Library,” 2008,
.
[22] “NLANR/DAST: Iperf 1.7.0 - The TCP/UDP bandwidth
measurement tool,” 2003, />[23] “Lawrence Berkeley National Laboratory (LBNL)
and ICSI,”LBNL’s internal enterprise traffic, 2005,
/>[24] MAWI Working Group, “Packet traces from WIDE backbone,”
2006, />[25] H. Sun, J. C. S. Lui, and D. K. Y. Yau, “Distributed mechanism
in detecting and defending against the low-rate TCP attack,”
Computer Networks, vol. 50, no. 13, pp. 2312–2330, 2006.
[26] J S. R. Jang and H R. Lee, “A general framework of
progressive filtering and its application to query by
singing/humming,” IEEE Transactions on Audio, Speech,
and Language Processing, vol. 16, no. 2, pp. 350–358, 2008.
[27] M. Weeks and M. Bayoumi, “Discrete wavelet transform:
architectures, design and performance issues,” The Journal of
VLSI Signal Processing, vol. 35, no. 2, pp. 155–178, 2003.
[28] A. Oppenheim, A. Willsky, and S. Nawab, Signals and Systems,
Prentice-Hall, Englewood Cliffs, NJ, USA, 2nd edition, 1996.